Posts Tagged ‘timestamp’

How to install and configure AIDE ( Advanced Intrusion Detection Environment ) on Debian GNU / Linux 11 to monitor files for changes

Thursday, March 9th, 2023

aide-logo-linux

How to install and configure AIDE ( Advanced Intrusion Detection Environment ) on Debian GNU / Linux 11 to monitor files for changes

Having a intrusion detection system is essential to keeping a server security to good level and being compliant with PCI (Payment Card Industry) DSS Standards. It is a great thing for the sake to protect oneself from hackers assaults. 

There is plenty of Intrusion Detection systems available all around since many years, in the past one of main ones for Linux as older system administrators should remember was Tripwire – integrity tool for monitoring and alerting on specific file change(s) on a range of systems

Tripwire is still used today but many today prefer to use AIDE that is a free software replacement for Tripwire under GPL (General Public License), that is starting to become like a "standard"  for many Unix-like systems as an inexpensive baseline control and rootkit detection system.

In this article I'll explain shortly how to Install / Configure and Use AIDE to monitor, changes with files on the system.

But before proceeding it is worthy to mention on some of the alternatives companies and businesses choose to as an IDS (Intrusion Detection Systems), that is useful to give a brief idea of the sysadmins that has to deal with Security, on what is some of the main Intrusion Detection Systems adopted on UNIX OSes today:
 

  • Samhain

    An integrity checker and host intrusion detection system that can be used on single hosts as well as large, UNIX-based networks. It supports central monitoring as well as powerful (and new) stealth features to run undetected in memory, using steganography. Samhain is an open-source multiplatform application for POSIX systems (Unix, Linux, Cygwin/Windows).

  • OSSEC 
    OSSEC uses a centralized, cross-platform architecture allowing multiple systems to be monitored and managed.
     
  • Snort
    IDS which has the capabilities to prevent attacks. By taking a particular action based on traffic patterns, it can become an intrusion prevention system (IPS). – written in Pure C.
     
  • Zeek (Bro)
    Zeek helps to perform security monitoring by looking into the network's activity. It can find suspicious data streams. Based on the data, it alert, react, and integrate with other tools – written in C++.
  • Maltrail (Maltrail monitors for traffic on the network that might indicate system compromise or other bad behavior. It is great for intrusion detection and monitoring. – written in Python).

1. Install aide deb package

# apt -y install aide

root@haproxy2:~# aide -v
Aide 0.17.3

Compiled with the following options:

WITH_MMAP
WITH_PCRE
WITH_POSIX_ACL
WITH_SELINUX
WITH_XATTR
WITH_CAPABILITIES
WITH_E2FSATTRS
WITH_ZLIB
WITH_MHASH
WITH_AUDIT

Default config values:
config file: <none>
database_in: <none>
database_out: <none>

Available hashsum groups:
md5: yes
sha1: yes
sha256: yes
sha512: yes
rmd160: yes
tiger: yes
crc32: yes
crc32b: yes
haval: yes
whirlpool: yes
gost: yes
stribog256: no
stribog512: no

Default compound groups:
R: l+p+u+g+s+c+m+i+n+md5+acl+selinux+xattrs+ftype+e2fsattrs+caps
L: l+p+u+g+i+n+acl+selinux+xattrs+ftype+e2fsattrs+caps
>: l+p+u+g+i+n+acl+S+selinux+xattrs+ftype+e2fsattrs+caps
H: md5+sha1+rmd160+tiger+crc32+haval+gost+crc32b+sha256+sha512+whirlpool
X: acl+selinux+xattrs+e2fsattrs+caps

2. Prepare AIDE configuration and geenrate (initialize) database

Either you can use the default AIDE configuration which already has a preset rules for various files and directories to be monitored,
or you might add up additional ones.
 

  • For details on configuration of aide.conf accepted options "man aide.conf"

The rules and other configurations resides lays under  /etc/aide/ directory
 

The AIDE database is located under /var/lib/aide

root@server:~# ls -al /var/lib/aide/
общо 33008
drwxr-xr-x  2 root root     4096  9 мар 12:38 ./
drwxr-xr-x 27 root root     4096  9 мар 12:01 ../
-rw——-  1 root root 16895467  9 мар 16:03 aide.db
-rw——-  1 root root 16895467  9 мар 18:49 aide.db.new


Also, details about major setting rules config regarding how AIDE will run via cronjob as with most debian services are into /etc/default/aide

Default aide.conf config is in /etc/aide/aide.conf if you need custom stuff to do with it simply edit it.

Here is an Example:
Lets say you want to omit some directory to not be monitored by aide, which would otherwise do, i.e.
omit /var/log/* from monitoring

# At the end of file /etc/aide/aide.conf

add:

!/var/log
!/home/
!/var/lib
!/proc

  • Initialize the aide database first time

Run aideinit command, aideinit will create a new baseline database –  /var/lib/aide/aide.db.new (a baseline)
Note that, /var/lib/aide/aide.db is the old database that aide uses to check against for any changes of files / directories on the configured monitored filesystem objects.

root@server:~# aideinit
Running aide –init…

debug1: client_input_channel_req: channel 0 rtype keepalive@openssh.com reply 1
Start timestamp: 2023-03-09 12:06:16 +0200 (AIDE 0.17.3)
AIDE initialized database at /var/lib/aide/aide.db.new

Number of entries:      66971

—————————————————
The attributes of the (uncompressed) database(s):
—————————————————

/var/lib/aide/aide.db.new
 SHA256    : nVrYljiBFM/KaKCTjbaJtR2w6N8vc8qN
             DPObbo2UMVo=
 SHA512    : S1ZNB0DCqb4UTmuqaalTgiQ3UAltTOzO
             YNfEQJldp32q5ahplBo4/65uwgtGusMy
             rJC8nvxvYmh+mq+16kfrKA==
 RMD160    : xaUnfW1+/DJV/6FEm/nn1k1UKOU=
 TIGER     : nGYEbX281tsQ6T21VPx1Hr/FwBdwF4cK
 CRC32     : fzf7cg==
 HAVAL     : yYQw/87KUmRiRLSu5JcEIvBUVfsW/G9H
             tVvs6WqL/0I=
 WHIRLPOOL : 6b5y42axPjpUxWFipUs1PtbgP2q0KJWK
             FwFvAGxHXjZeCBPEYZCNkj8mt8MkXBTJ
             g83ZELK9GQBPLea7UF3tng==
 GOST      : sHAzx7hkr5H3q8TCSGCKjndEiZgcvCEL
             E45qcRb25tM=


End timestamp: 2023-03-09 12:38:30 +0200 (run time: 32m 14s)


Be patient now, go grab a coffee / tea or snack as the command might take up to few minutes for the aide to walk through the whole monitored filesystems and built its database.

root@server:~# echo cp /var/lib/aide/aide.db{.new,}
cp /var/lib/aide/aide.db.new /var/lib/aide/aide.db


root@server:~# cp /var/lib/aide/aide.db{.new,}

root@server:~# aide –check –config /etc/aide/aide.conf

Start timestamp: 2023-03-09 13:01:32 +0200 (AIDE 0.17.3)
AIDE found differences between database and filesystem!!

Summary:
  Total number of entries:      66972
  Added entries:                1
  Removed entries:              0
  Changed entries:              7

—————————————————
Added entries:
—————————————————

f+++++++++++++++++: /var/lib/aide/aide.db

—————————————————
Changed entries:
—————————————————

d =…. mc.. .. . : /etc/aide
d =…. mc.. .. . : /root
f <…. mci.H.. . : /root/.viminfo
f =…. mc..H.. . : /var/lib/fail2ban/fail2ban.sqlite3
d =…. mc.. .. . : /var/lib/vnstat
f =…. mc..H.. . : /var/lib/vnstat/vnstat.db
f >b… mc..H.. . : /var/log/sysstat/sa09

—————————————————
Detailed information about changes:
—————————————————

Directory: /etc/aide
 Mtime     : 2023-03-09 12:04:03 +0200        | 2023-03-09 12:51:11 +0200
 Ctime     : 2023-03-09 12:04:03 +0200        | 2023-03-09 12:51:11 +0200

Directory: /root
 Mtime     : 2023-03-09 12:06:13 +0200        | 2023-03-09 12:51:11 +0200
 Ctime     : 2023-03-09 12:06:13 +0200        | 2023-03-09 12:51:11 +0200

File: /root/.viminfo
 Size      : 18688                            | 17764
 Mtime     : 2023-03-09 12:06:13 +0200        | 2023-03-09 12:51:11 +0200
 Ctime     : 2023-03-09 12:06:13 +0200        | 2023-03-09 12:51:11 +0200
 Inode     : 133828                           | 133827
 SHA256    : aV54gi33aA/z/FuBj2ZioU2cTa9H16TT | dnFdLVQ/kx3UlTah09IgEMrJ/aYgczHe
             TzkLSxBDSB4=                     | DdxDAmPOSAM=

3. Test aide detects file changes

Create a new file and append some text and rerun the aide check


root@server:~# touch /root/test.txt
root@server:~# echo aaa > /root/test.txt
root@server:~# aide –check –config /etc/aide/aide.conf


Start timestamp: 2023-03-09 13:07:21 +0200 (AIDE 0.17.3)
AIDE found differences between database and filesystem!!

Summary:
  Total number of entries:      66973
  Added entries:                2
  Removed entries:              0
  Changed entries:              7

—————————————————
Added entries:
—————————————————

f+++++++++++++++++: /root/test.txt
f+++++++++++++++++: /var/lib/aide/aide.db

—————————————————
Changed entries:
—————————————————

d =…. mc.. .. . : /etc/aide
d =…. mc.. .. . : /root
f <…. mci.H.. . : /root/.viminfo
f =…. mc..H.. . : /var/lib/fail2ban/fail2ban.sqlite3
d =…. mc.. .. . : /var/lib/vnstat
f =…. mc..H.. . : /var/lib/vnstat/vnstat.db
f >b… mc..H.. . : /var/log/sysstat/sa09

….


The same command can be shortened for the lazy typist:

root@server:~# aide -c /etc/aide/aide.conf -C

The command will basically try to check the deviation between the AIDE database and the filesystem.

4. Limiting AIDES Integrity Checks to Specific Files / Directories

In order to limit the integrity checks to a specific entries for example /etc, pass the –limit REGEX option to AIDE check command where REGEX is the entry to check.

For example, check and update the database entries matching /etc, you would run aide command as shown below;
 

root@server:~# aide -c /etc/aide/aide.conf –limit /etc –check


AIDE found differences between database and filesystem!!
Limit: /etc

Summary:
  Total number of entries:      66791
  Added entries:                0
  Removed entries:              0
  Changed entries:              2

—————————————————
Changed entries:
—————————————————

d =…. mc.. .. . : /etc/aide
d =…. mc.. .. . : /etc/default

—————————————————
Detailed information about changes:
—————————————————

Directory: /etc/aide
 Mtime     : 2023-03-09 15:59:53 +0200        | 2023-03-09 16:43:03 +0200
 Ctime     : 2023-03-09 15:59:53 +0200        | 2023-03-09 16:43:03 +0200

Directory: /etc/default
 Mtime     : 2023-03-09 12:06:13 +0200        | 2023-03-09 18:42:12 +0200
 Ctime     : 2023-03-09 12:06:13 +0200        | 2023-03-09 18:42:12 +0200


—————————————————
The attributes of the (uncompressed) database(s):
—————————————————

/var/lib/aide/aide.db
 SHA256    : sjCxyIkr0nC/gTkNmn7DNqAQWttreDF6
             vSUV4jBoFY4=
 SHA512    : vNMpb54qxrbOk6S1Z+m9r0UwGvRarkWY
             0m50TfMvGElfZWR1I3SSaeTdORAZ4rQe
             17Oapo5+Sc0E2E+STO93tA==
 RMD160    : anhm5E6UlKmPYYJ4WYnWXk/LT3A=
 TIGER     : 5e1wycoF35/ABrRf7FNypZ45169VTuV4
 CRC32     : EAJlFg==
 HAVAL     : R5imONWRYgNGEfhBTc096K+ABnMFkMmh
             Hsqe9xt20NU=
 WHIRLPOOL : c6zySLliXNgnOA2DkHUdLTCG2d/T18gE
             4rdAuKaC+s7gqAGyA4p2bnDHhdd0v06I
             xEGY7YXCOXiwx8BM8xHAvQ==
 GOST      : F5zO2Ovtvf+f7Lw0Ef++ign1znZAQMHM
             AApQOiB9CqA=


End timestamp: 2023-03-09 20:02:18 +0200 (run time: 1m 32s)

5. Add the modified /root/test.txt to AIDE list of known modified files database
 

root@server:~# aide –update –config /etc/aide/aide.
  ERROR: cannot open config file '/etc/aide/aide.': No such file or directory


root@server:~# ​ aide –update –config /etc/aide/aide.conf
 

Start timestamp: 2023-03-09 18:45:17 +0200 (AIDE 0.17.3)
AIDE found differences between database and filesystem!!
New AIDE database written to /var/lib/aide/aide.db.new

Summary:
  Total number of entries:      66791
  Added entries:                0
  Removed entries:              0
  Changed entries:              8

—————————————————
Changed entries:
—————————————————

d =…. mc.. .. . : /etc/aide
d =…. mc.. .. . : /etc/default
d =…. mc.. .. . : /root
f >…. mci.H.. . : /root/.viminfo
f >…. mci.H.. . : /root/test.txt
f =…. mc..H.. . : /var/lib/fail2ban/fail2ban.sqlite3
d =…. mc.. .. . : /var/lib/vnstat
f =…. mc..H.. . : /var/lib/vnstat/vnstat.db

—————————————————
Detailed information about changes:
—————————————————

Directory: /etc/aide
 Mtime     : 2023-03-09 15:59:53 +0200        | 2023-03-09 16:43:03 +0200
 Ctime     : 2023-03-09 15:59:53 +0200        | 2023-03-09 16:43:03 +0200

Directory: /etc/default
 Mtime     : 2023-03-09 12:06:13 +0200        | 2023-03-09 18:42:12 +0200
 Ctime     : 2023-03-09 12:06:13 +0200        | 2023-03-09 18:42:12 +0200

Directory: /root
 Mtime     : 2023-03-09 15:59:53 +0200        | 2023-03-09 18:44:34 +0200
 Ctime     : 2023-03-09 15:59:53 +0200        | 2023-03-09 18:44:34 +0200

File: /root/.viminfo
 Size      : 16706                            | 16933
 Mtime     : 2023-03-09 15:59:53 +0200        | 2023-03-09 18:44:34 +0200
 Ctime     : 2023-03-09 15:59:53 +0200        | 2023-03-09 18:44:34 +0200
 Inode     : 136749                           | 133828
 SHA256    : KMHGoMVJo10BtafVrWIOLt3Ht9gK8bc+ | rrp8S3VftzZzvjBP1JC+PBpODv9wPKGw
             9uHh/z7iJWA=                     | TA+hyhTiY+U=
 SHA512    : ieDHy7ObSTfYm5d8DtYcHKxHya13CS65 | PDAJjyZ39uU3kKFo2lHBduTqxMDq4i01
             ObMYIRAre6IgvLslEs0ZodQFyrczMyRt | 1Kvm/h6xzFhHtFgjidtcemG8wDcjtfNF
             +d6SrW0gn3skKn2B7G09eQ==         | Z7LO230fgGeO7UepqtxZjQ==
 RMD160    : nUgg/G4zsVGKzVmmrqltuYUDvtg=     | jj61KAFONK92mj+u66RDJmxFhmI=
 TIGER     : 3vPSOrla5k+k2br1E2ES4eNiSZ2novFX | mn4kNCzd8SQr2ID2VSe4f4l0ta7pO/xo
 CRC32     : NDnMgw==                         | AyzVUQ==
 HAVAL     : Q9/KozxRiPbLEkaIfnBUZdEWftaF52Mw | 6jADKV6jg7ZVr/A/oMhR4NXc8TO1AOGW
             7tiR7DXhl0o=                     | NrYe+j6UcO0=
 WHIRLPOOL : vB/ZMCul4hN0aYd39gBu+HmZT/peRUI8 | mg6c1lYYVNZcy4mVzGojwraim8e3X2/R
             KDkaslNb8+YleoFWx0mbhAbkGurc0+jh | urVvEmbsgTuUCJOuf9+OrEACiF0fbe/x
             YPBviZIKcxUbTc2nGthTWw==         | t+BXnSQWk08OL9EI6gMGqA==
 GOST      : owVGTgU9BH3b0If569wQygw3FAbZIZde | ffx29GV2jaCB7XzuNjdiRzziIiZYnbi3
             eAfQfzlRPGY=                     | Ar7jyNMUutk=

File: /root/test.txt
 Size      : 4                                | 8
 Mtime     : 2023-03-09 13:07:12 +0200        | 2023-03-09 18:44:34 +0200
 Ctime     : 2023-03-09 13:07:12 +0200        | 2023-03-09 18:44:34 +0200
 Inode     : 133828                           | 136751
 SHA256    : F+aC8GC1+OR+oExcSFWQiwpa1hICImD+ | jUIZMGfiMdAlWFHu8mmmlml4qAGNQNL5
             UOEeywzAq3Y=                     | 6NhzJ1sYFZE=
 SHA512    : d+UmFKFBzvGadt5hk+nIRbjP//7PSXNl | ixn20lcEMDEtsJo3hO90Ea/wHWLCHcrz
             Pl16XRIUUPq2FCiQ4PeUcVciukJX7ijL | seBWunbBysY0z3BWcfgnN2vH05WfRfvA
             D045ZvGOEcnmL6a6vwp0jw==         | QiNtQS1tStuEdB3Voq54zQ==
 RMD160    : I6waxKN3rMx4WTz4VCUQXoNoxUg=     | urTh1j1t3UHchnJGnBG4lUZnjI4=
 TIGER     : cwUYgfKHcJnWXcA0pr/OKuxuoxh+b9lA | prstKqCfMXL39aVGFPA0kX4Q9x7a+hUn
 CRC32     : UD78Dw==                         | zoYiEA==
 HAVAL     : bdbKR9LvPgsYClViKiHx48fFixfIL/jA | ZdpdeMhw4MvKBgWsM4EeyUgerO86Rt82
             F3tjdc2Gm8Y=                     | W94fJFRWbrM=
 WHIRLPOOL : OLP0Y4oKcqW2yEvme8z419N1KE4TB9GJ | Xk8Ujo3IU2SzSqbJFegq7p1ockmrnxJF
             biHn/9XgrBz4fQiDJ8eHpx+0exA9hXmY | R3Rfstd1jWSwLFNTEwfbRRw+TARtRK50
             EbbakMJJdzLt1ipKWiV9gg==         | iWJeHLsD5dZ+CzV0tf4sUg==
 GOST      : ystISzoeH/ZznYrrXmxe4rwmybWMpGuE | GhMWNxg7Is0svJ+5LP+DVWbgt+CDQO+3
             0PzRnVEqnR8=                     | 08dwBuVAwB8=

File: /var/lib/fail2ban/fail2ban.sqlite3
 Mtime     : 2023-03-09 15:55:01 +0200        | 2023-03-09 18:45:01 +0200
 Ctime     : 2023-03-09 15:55:01 +0200        | 2023-03-09 18:45:01 +0200
 SHA256    : lLilXNleqSgHIP1y4o7c+oG5XyUPGzgi | NCJJ2H6xgCw/NYys1LMA7hOWwoOoxI8Y
             RHYH+zvlAL4=                     | 4SJygfqEioE=
 SHA512    : iQj2pNT4NES4fBcujzdlEEGZhDnkhKgc | ClQZ5HMOSayUNb//++eZc813fiMJcXnj
             QDlGFSAn6vi+RXesFCjCABT7/00eEm5/ | vTGs/2tANojoe6cqpsT/LaJ3QZXpmrfh
             ILcaqlQtBSLJgHjMQehzdg==         | syVak1I4n9yg8cDKEkZUvw==
 RMD160    : Xg4YU8YI935L+DLvkRsDanS4DGo=     | SYrQ27n+/1fvIZ7v+Sar/wQHulI=
 TIGER     : 2WhhPq9kuyeNJkOicDTDeOeJB8HR8zZe | o1LDZtRclri2KfZBe5J3D4YhM05UaP4E
 CRC32     : NQmi4A==                         | tzIsqg==
 HAVAL     : t1ET+84+8WgfwqlLy4R1Qk9qGZQRUbJI | MwVnjtM3dad/RuN2BfgsySX2DpfYq4qi
             z2J0ROGduXc=                     | H1pq6RYsA6o=
 WHIRLPOOL : xKSn71gFIVhk5rWJIBaYQASl0V+pGn+3 | m5LEXfhBbhWFg/d8CFJhklOurmRSkDSG
             N85R0tiCKsTZ2+LRkxDrzcVQdss2k8+z | LC/vICnbEWzLwrCuMwBi1/e5wDNIY8gK
             oqExhoXtPsMaREjpCugd3Q==         | mvGn40x+G4cCYNZ6lGT9Zg==
 GOST      : WptpUlfooIlUjzDHU8XGuOU2waRud5SR | i6K4COXU0nyZ1mL3ZBuGUPz/ZXTj8KKQ
             E/tnoBqk+q0=                     | L6VNyS8/X2Y=

Directory: /var/lib/vnstat
 Mtime     : 2023-03-09 16:00:00 +0200        | 2023-03-09 18:45:01 +0200
 Ctime     : 2023-03-09 16:00:00 +0200        | 2023-03-09 18:45:01 +0200

File: /var/lib/vnstat/vnstat.db
 Mtime     : 2023-03-09 16:00:00 +0200        | 2023-03-09 18:45:00 +0200
 Ctime     : 2023-03-09 16:00:00 +0200        | 2023-03-09 18:45:00 +0200
 SHA256    : X/lnJuuSo4jX4HRzxMBodnKHAjQFvugi | oqtY3HTNds/qDNFCRAEsfN5SuO0U5LRg
             2sh2c0u69x8=                     | otc5z1y+eGY=
 SHA512    : U/g8O6G8cuhsqCUCbrElxgiy+naJKPkI | y+sw4LX8mlDWkRJMX38TsYSo1DQzxPOS
             hG7vdH9rBINjakL87UWajT0s6WSy0pvt | 068otnzw2FSSlM5X5j5EtyJiY6Hd5P+A
             ALaTcDFKHBAmmFrl8df2nQ==         | jFiWStMbx+dQidXYZ4XFAw==
 RMD160    : F6YEjIIQu2J3ru7IaTvSemA9e34=     | bmVSaRKN2qU7qpEWkzfXFoH4ZK4=
 TIGER     : UEwLoeR6Qlf2oOI58pUCEDaWk0pHDkcY | 0Qb4nUqe3cKh/g5CQUnOXGfjZwJHjeWa
 CRC32     : Bv3/6A==                         | jvW6mg==
 HAVAL     : VD7tjHb8o8KTUo5xUH7eJEmTWgB9zjft | rumfiWJvy/sTK/09uj7XlmV3f7vj6KBM
             kOkzKxFWqqU=                     | qeOuKvu0Zjc=
 WHIRLPOOL : wR0qt8u4N8aQn8VQ+bmfrxB7CyCWVwHi | FVWDRE3uY6qHxLlJQLU9i9QggLW+neMj
             ADHpMTUxBEKOpOBlHTWXIk13qYZiD+o/ | Wt+Dj9Rz92BG9EomgLUgUkxfiVFO8cMq
             XtzTB4rMbxS4Z5PAdC/07A==         | WaR/KKq3Z7R8f/50tc9GMQ==
 GOST      : l3ibqMkHMSPpQ+9ok51/xBthET9+JQMd | qn0GyyCg67KRGP13At52tnviZfZDgyAm
             OZtiFGYXmgU=                     | c82NXSzeyV0=


—————————————————
The attributes of the (uncompressed) database(s):
—————————————————

/var/lib/aide/aide.db
 SHA256    : sjCxyIkr0nC/gTkNmn7DNqAQWttreDF6
             vSUV4jBoFY4=
 SHA512    : vNMpb54qxrbOk6S1Z+m9r0UwGvRarkWY
             0m50TfMvGElfZWR1I3SSaeTdORAZ4rQe
             17Oapo5+Sc0E2E+STO93tA==
 RMD160    : anhm5E6UlKmPYYJ4WYnWXk/LT3A=
 TIGER     : 5e1wycoF35/ABrRf7FNypZ45169VTuV4
 CRC32     : EAJlFg==
 HAVAL     : R5imONWRYgNGEfhBTc096K+ABnMFkMmh
             Hsqe9xt20NU=
 WHIRLPOOL : c6zySLliXNgnOA2DkHUdLTCG2d/T18gE
             4rdAuKaC+s7gqAGyA4p2bnDHhdd0v06I
             xEGY7YXCOXiwx8BM8xHAvQ==
 GOST      : F5zO2Ovtvf+f7Lw0Ef++ign1znZAQMHM
             AApQOiB9CqA=

/var/lib/aide/aide.db.new
 SHA256    : QRwubXnz8md/08n28Ek6DOsSQKGkLvuc
             gSZRsw6gRw8=
 SHA512    : 238RmI1PHhd9pXhzcHqM4+VjNzR0es+3
             6eiGNrXHAdDTz7GlAQQ4WfKeQJH9LdyT
             1r5ho/oXRgzfa2BfhKvTHg==
 RMD160    : GJWuX/nIPY05gz62YXxk4tWiH5I=
 TIGER     : l0aOjXlM4/HjyN9bhgBOvvCYeqoQyjpw
 CRC32     : KFz6GA==
 HAVAL     : a//4jwVxF22URf2BRNA612WOOvOrScy7
             OmI44KrNbBM=
 WHIRLPOOL : MBf+NeXElUvscJ2khIuAp+NDu1dm4h1f
             5tBQ0XrQ6dQPNA2HZfOShCBOPzEl/zrl
             +Px3QFV4FqD0jggr5sHK2g==
 GOST      : EQnPh6jQLVUqaAK9B4/U4V89tanTI55N
             K7XqZR9eMG4=


End timestamp: 2023-03-09 18:49:51 +0200 (run time: 4m 34s)
 

6. Substitute old aide database with the new that includes the modified files

As you see AIDE detected the changes in /root/test.txt

To apply the changes be known by AIDE for next time (e.g. this file was authorized and supposed to be written there) simply move the new generated database
to current aide database.

# copy generated DB to master DB
root@dlp:~# cp -p /var/lib/aide/aide.db.new /var/lib/aide/aide.db

7. Check once again to make sure recently modified files are no longer seen as changed by AIDE

Recheck again the database to make sure the files you wanted to omit are no longer mentioned as changed

root@server:~# aide –check –config /etc/aide/aide.conf
Start timestamp: 2023-03-09 16:23:05 +0200 (AIDE 0.17.3)
AIDE found differences between database and filesystem!!

Summary:
  Total number of entries:      66791
  Added entries:                0
  Removed entries:              0
  Changed entries:              3

—————————————————
Changed entries:
—————————————————

f =…. mc..H.. . : /var/lib/fail2ban/fail2ban.sqlite3
d =…. mc.. .. . : /var/lib/vnstat
f =…. mc..H.. . : /var/lib/vnstat/vnstat.db

—————————————————
Detailed information about changes:
—————————————————

File: /var/lib/fail2ban/fail2ban.sqlite3
 Mtime     : 2023-03-09 15:55:01 +0200        | 2023-03-09 16:25:02 +0200
 Ctime     : 2023-03-09 15:55:01 +0200        | 2023-03-09 16:25:02 +0200
 SHA256    : lLilXNleqSgHIP1y4o7c+oG5XyUPGzgi | MnWXC2rBMf7DNJ91kXtHXpM2c2xxF60X
             RHYH+zvlAL4=                     | DfLUQLHiSiY=
 SHA512    : iQj2pNT4NES4fBcujzdlEEGZhDnkhKgc | gxHVBxhGTKi0TjRE8/sn6/gtWsRw7Mfy
             QDlGFSAn6vi+RXesFCjCABT7/00eEm5/ | /wCfPlDK0dkRZEbr8IE2BNUhBgwwocCq
             ILcaqlQtBSLJgHjMQehzdg==         | zuazTy4N4x6X8bwOzRmY0w==
 RMD160    : Xg4YU8YI935L+DLvkRsDanS4DGo=     | +ksl9kjDoSU9aL4tR7FFFOK3mqw=
 TIGER     : 2WhhPq9kuyeNJkOicDTDeOeJB8HR8zZe | 9cvXZNbU+cp5dA5PLiX6sGncXd1Ff5QO
 CRC32     : NQmi4A==                         | y6Oixg==
 HAVAL     : t1ET+84+8WgfwqlLy4R1Qk9qGZQRUbJI | aPnCrHfmZAUm7QjROGEl6rd3776wO+Ep
             z2J0ROGduXc=                     | s/TQn7tH1tY=
 WHIRLPOOL : xKSn71gFIVhk5rWJIBaYQASl0V+pGn+3 | 9Hu6NBhz+puja7uandb21Nt6cEW6zEpm
             N85R0tiCKsTZ2+LRkxDrzcVQdss2k8+z | bTsq4xYA09ekhDHMQJHj2WpKpzZbA+t0
             oqExhoXtPsMaREjpCugd3Q==         | cttMDX8J8M/UadqfL8KZkQ==
 GOST      : WptpUlfooIlUjzDHU8XGuOU2waRud5SR | WUQfAMtye4wADUepBvblvgO+vBodS0Ej
             E/tnoBqk+q0=                     | cIbXy4vpPYc=

Directory: /var/lib/vnstat
 Mtime     : 2023-03-09 16:00:00 +0200        | 2023-03-09 16:25:01 +0200
 Ctime     : 2023-03-09 16:00:00 +0200        | 2023-03-09 16:25:01 +0200

File: /var/lib/vnstat/vnstat.db
 Mtime     : 2023-03-09 16:00:00 +0200        | 2023-03-09 16:25:01 +0200
 Ctime     : 2023-03-09 16:00:00 +0200        | 2023-03-09 16:25:01 +0200
 SHA256    : X/lnJuuSo4jX4HRzxMBodnKHAjQFvugi | N1lzhV3+tkDBud3AVlmIpDkU1c3Rqhnt
             2sh2c0u69x8=                     | YqE8naDicoM=
 SHA512    : U/g8O6G8cuhsqCUCbrElxgiy+naJKPkI | +8B9HvHhOp1C/XdlOORjyd3J2RtTbRBF
             hG7vdH9rBINjakL87UWajT0s6WSy0pvt | b0Moo2Gj+cIxaMCu5wOkgreMp6FloqJR
             ALaTcDFKHBAmmFrl8df2nQ==         | UH4cNES/bAWtonmbj4W7Vw==
 RMD160    : F6YEjIIQu2J3ru7IaTvSemA9e34=     | 8M6TIOHt0NWgR5Mo47DxU28cp+4=
 TIGER     : UEwLoeR6Qlf2oOI58pUCEDaWk0pHDkcY | Du9Ue0JA2URO2tiij31B/+663OaWKefR
 CRC32     : Bv3/6A==                         | v0Ai4w==
 HAVAL     : VD7tjHb8o8KTUo5xUH7eJEmTWgB9zjft | XA+vRnMNdVGFrO+IZtEA0icunWqBGaCf
             kOkzKxFWqqU=                     | leR27LN4ejc=
 WHIRLPOOL : wR0qt8u4N8aQn8VQ+bmfrxB7CyCWVwHi | HG31dNEEcak2zZGR24W7FDJx8mh24MaJ
             ADHpMTUxBEKOpOBlHTWXIk13qYZiD+o/ | BQNhqkuS6R/bmlhx+P+eQ/JimwPAPOaM
             XtzTB4rMbxS4Z5PAdC/07A==         | xWG7cMETIXdT9sUOUal8Sw==
 GOST      : l3ibqMkHMSPpQ+9ok51/xBthET9+JQMd | y6Ek/TyAMGV5egkfCu92Y4qqk1Xge8c0
             OZtiFGYXmgU=                     | 3ONXRveOlr0=


—————————————————
The attributes of the (uncompressed) database(s):
—————————————————

/var/lib/aide/aide.db
 SHA256    : sjCxyIkr0nC/gTkNmn7DNqAQWttreDF6
             vSUV4jBoFY4=
 SHA512    : vNMpb54qxrbOk6S1Z+m9r0UwGvRarkWY
             0m50TfMvGElfZWR1I3SSaeTdORAZ4rQe
             17Oapo5+Sc0E2E+STO93tA==
 RMD160    : anhm5E6UlKmPYYJ4WYnWXk/LT3A=
 TIGER     : 5e1wycoF35/ABrRf7FNypZ45169VTuV4
 CRC32     : EAJlFg==
 HAVAL     : R5imONWRYgNGEfhBTc096K+ABnMFkMmh
             Hsqe9xt20NU=
 WHIRLPOOL : c6zySLliXNgnOA2DkHUdLTCG2d/T18gE
             4rdAuKaC+s7gqAGyA4p2bnDHhdd0v06I
             xEGY7YXCOXiwx8BM8xHAvQ==
 GOST      : F5zO2Ovtvf+f7Lw0Ef++ign1znZAQMHM
             AApQOiB9CqA=


End timestamp: 2023-03-09 16:27:33 +0200 (run time: 4m 28s)

As you can see there are no new added entries for /root/test.txt and some other changed records for vnstat service as well as fail2ban ones, so the Intrusion detection system works just as we expected it.

8. Configure Email AIDE changed files alerting Email recipient address

From here on aide package has set its own cron job which is automatically doing the check operation every day and any new file modifications will be captured and alerts sent to local root@localhost mailbox account, so you can check it out later with mail command.

If you want to sent the Email alert for any files modifications occured to another email, assuming that you have a locally running SMTP server with a mail relay to send to external mails, you can do it via /etc/default/aide via:

MAILTO=root


For example change it to a FQDN email address

MAILTO=external_mail@your-mail.com

9.Force AIDE to run AIDE at specitic more frequent time intervals

You can as well install a cron job to execute AIDE at specific time intervals, as of your choice

Lets say you want to run a custom prepared set of files to monitor in /etc/aide/aide_custom_config.conf configure a new cronjob like below:

root@server:~# crontab -u root -e
*/5 * * * * aide -c /etc/aide/aide_custom_config.conf -u && cp /var/lib/custom-aide/aide.db{.new,}


This will execute AIDE system check every 5 minutse and email the report to ealier configured email username@whatever-your-smtp.com via /etc/default/aide

10. Check the output of AIDE for changes – useful for getting a files changes from aide from scripts

Check the command exit status.

root@server:~# echo $?

According to AIDE man pages, the AIDE’s exit status is normally 0 if no errors occurred. Except when the –check, –compare or –update command was requested, in which case the exit status is defined as:

   1 * (new files detected?)     +

   2 * (removed files detected?) +

   4 * (changed files detected?)


   Since  those three cases can occur together, the respective error codes are added. For example, if there are new files and removed files detected, the exit status will be 1 + 2 = 3.

   Additionally, the following exit codes are defined for generic error conditions in aide help manual:

   14 Error writing error

   15 Invalid argument error

   16 Unimplemented function error

   17 Invalid configureline error

   18 IO error

   19 Version mismatch error

PLEASE CONSIDER

  • That AIDE checks might be resource intensive
    and could cause a peak in CPU use and have a negative effect on lets very loaded application server machines,
    thus causing a performance issuea during integrity checks !
     
  • If you are scanning file system wide and you do it frequent, be sure to provide “enough” resources or schedule the scan at a times that the Linux host will be less used !
     
  • Whenever you made any AIDE configuration changes, remember to initialize the database to create a baseline !

Install and enable Sysstats IO / DIsk / CPU / Network monitoring console suite on Redhat 8.3, Few sar useful command examples

Tuesday, September 28th, 2021

linux-sysstat-monitoring-logo


Why to monitoring CPU, Memory, Hard Disk, Network usage etc. with sysstats tools?
 

Using system monitoring tools such as Zabbix, Nagios Monit is a good approach, however sometimes due to zabbix server interruptions you might not be able to track certain aspects of system performance on time. Thus it is always a good idea to 
Gain more insights on system peroformance from command line. Of course there is cmd tools such as iostat and top, free, vnstat that provides plenty of useful info on system performance issues or bottlenecks. However from my experience to have a better historical data that is systimized and all the time accessible from console it is a great thing to have sysstat package at place. Since many years mostly on every server I administer, I've been using sysstats to monitor what is going on servers over a short time frames and I'm quite happy with it. In current company we're using Redhats and CentOS-es and I had to install sysstats on Redhat 8.3. I've earlier done it multiple times on Debian / Ubuntu Linux and while I've faced on some .deb distributions complications of making sysstat collect statistics I've come with an article on Howto fix sysstat Cannot open /var/log/sysstat/sa no such file or directory” on Debian / Ubuntu Linux
 

Sysstat contains the following tools related to collecting I/O and CPU statistics:
iostat
Displays an overview of CPU utilization, along with I/O statistics for one or more disk drives.
mpstat
Displays more in-depth CPU statistics.
Sysstat also contains tools that collect system resource utilization data and create daily reports based on that data. These tools are:
sadc
Known as the system activity data collector, sadc collects system resource utilization information and writes it to a file.
sar
Producing reports from the files created by sadc, sar reports can be generated interactively or written to a file for more intensive analysis.

My experience with CentOS 7 and Fedora to install sysstat it was pretty straight forward, I just had to install it via yum install sysstat wait for some time and use sar (System Activity Reporter) tool to report collected system activity info stats over time.
Unfortunately it seems on RedHat 8.3 as well as on CentOS 8.XX instaling sysstats does not work out of the box.

To complete a successful installation of it on RHEL 8.3, I had to:

[root@server ~]# yum install -y sysstat


To make sysstat enabled on the system and make it run, I've enabled it in sysstat

[root@server ~]# systemctl enable sysstat


Running immediately sar command, I've faced the shitty error:


Cannot open /var/log/sysstat/sa18:
No such file or directory. Please check if data collecting is enabled”


Once installed I've waited for about 5 minutes hoping, that somehow automatically sysstat would manage it but it didn't.

To solve it, I've had to create additionally file /etc/cron.d/sysstat (weirdly RPM's post install instructions does not tell it to automatically create it)

[root@server ~]# vim /etc/cron.d/sysstat

# run system activity accounting tool every 10 minutes
0 * * * * root /usr/lib64/sa/sa1 60 59 &
# generate a daily summary of process accounting at 23:53
53 23 * * * root /usr/lib64/sa/sa2 -A &


  • /usr/local/lib/sa1 is a shell script that we can use for scheduling cron which will create daily binary log file.
  • /usr/local/lib/sa2 is a shell script will change binary log file to human-readable form.


[root@server ~]# chmod 600 /etc/cron.d/sysstat

[root@server ~]# systemctl restart sysstat


In a while if sysstat is working correctly you should get produced its data history logs inside /var/log/sa

[root@server ~]# ls -al /var/log/sa 


Note that the standard sysstat history files on Debian and other modern .deb based distros such as Debian 10 (in  y.2021) is stored under /var/log/sysstat

Here is few useful uses of sysstat cmds


1. Check with sysstat machine history SWAP and RAM Memory use


To lets say check last 10 minutes SWAP memory use:

[hipo@server yum.repos.d] $ sar -W  |last -n 10
 

Linux 4.18.0-240.el8.x86_64 (server)       09/28/2021      _x86_64_        (8 CPU)

12:00:00 AM  pswpin/s pswpout/s
12:00:01 AM      0.00      0.00
12:01:01 AM      0.00      0.00
12:02:01 AM      0.00      0.00
12:03:01 AM      0.00      0.00
12:04:01 AM      0.00      0.00
12:05:01 AM      0.00      0.00
12:06:01 AM      0.00      0.00

[root@ccnrlb01 ~]# sar -r | tail -n 10
14:00:01        93008   1788832     95.06         0   1357700    725740      9.02    795168    683484        32
14:10:01        78756   1803084     95.81         0   1358780    725740      9.02    827660    652248        16
14:20:01        92844   1788996     95.07         0   1344332    725740      9.02    813912    651620        28
14:30:01        92408   1789432     95.09         0   1344612    725740      9.02    816392    649544        24
14:40:01        91740   1790100     95.12         0   1344876    725740      9.02    816948    649436        36
14:50:01        91688   1790152     95.13         0   1345144    725740      9.02    817136    649448        36
15:00:02        91544   1790296     95.14         0   1345448    725740      9.02    817472    649448        36
15:10:01        91108   1790732     95.16         0   1345724    725740      9.02    817732    649340        36
15:20:01        90844   1790996     95.17         0   1346000    725740      9.02    818016    649332        28
Average:        93473   1788367     95.03         0   1369583    725074      9.02    800965    671266        29


2. Check system load? Are my processes waiting too long to run on the CPU?

[root@server ~ ]# sar -q |head -n 10
Linux 4.18.0-240.el8.x86_64 (server)       09/28/2021      _x86_64_        (8 CPU)

12:00:00 AM   runq-sz  plist-sz   ldavg-1   ldavg-5  ldavg-15   blocked
12:00:01 AM         0       272      0.00      0.02      0.00         0
12:01:01 AM         1       271      0.00      0.02      0.00         0
12:02:01 AM         0       268      0.00      0.01      0.00         0
12:03:01 AM         0       268      0.00      0.00      0.00         0
12:04:01 AM         1       271      0.00      0.00      0.00         0
12:05:01 AM         1       271      0.00      0.00      0.00         0
12:06:01 AM         1       265      0.00      0.00      0.00         0


3. Show various CPU statistics per CPU use
 

On a multiprocessor, multi core server sometimes for scripting it is useful to fetch processor per use historic data, 
this can be attained with:


[hipo@server ~ ] $ mpstat -P ALL
Linux 4.18.0-240.el8.x86_64 (server)       09/28/2021      _x86_64_        (8 CPU)

06:08:38 PM  CPU    %usr   %nice    %sys %iowait    %irq   %soft  %steal  %guest  %gnice   %idle
06:08:38 PM  all    0.17    0.02    0.25    0.00    0.05    0.02    0.00    0.00    0.00   99.49
06:08:38 PM    0    0.22    0.02    0.28    0.00    0.06    0.03    0.00    0.00    0.00   99.39
06:08:38 PM    1    0.28    0.02    0.36    0.00    0.08    0.02    0.00    0.00    0.00   99.23
06:08:38 PM    2    0.27    0.02    0.31    0.00    0.06    0.01    0.00    0.00    0.00   99.33
06:08:38 PM    3    0.15    0.02    0.22    0.00    0.03    0.01    0.00    0.00    0.00   99.57
06:08:38 PM    4    0.13    0.02    0.20    0.01    0.03    0.01    0.00    0.00    0.00   99.60
06:08:38 PM    5    0.14    0.02    0.27    0.00    0.04    0.06    0.01    0.00    0.00   99.47
06:08:38 PM    6    0.10    0.02    0.17    0.00    0.04    0.02    0.00    0.00    0.00   99.65
06:08:38 PM    7    0.09    0.02    0.15    0.00    0.02    0.01    0.00    0.00    0.00   99.70


sar-sysstat-cpu-statistics-screenshot

Monitor processes and threads currently being managed by the Linux kernel.

[hipo@server ~ ] $ pidstat

pidstat-various-random-process-statistics

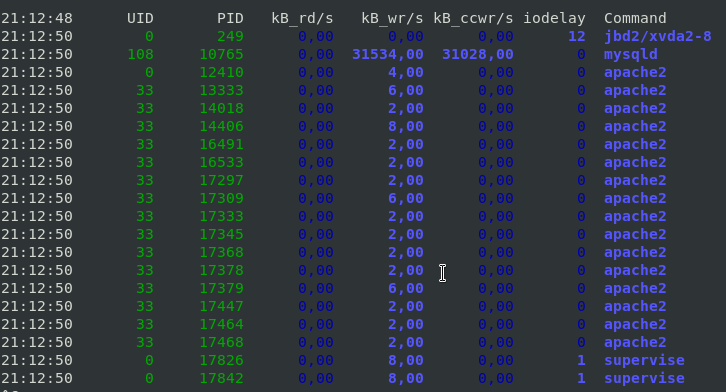
[hipo@server ~ ] $ pidstat -d 2


pidstat-show-processes-with-most-io-activities-linux-screenshot

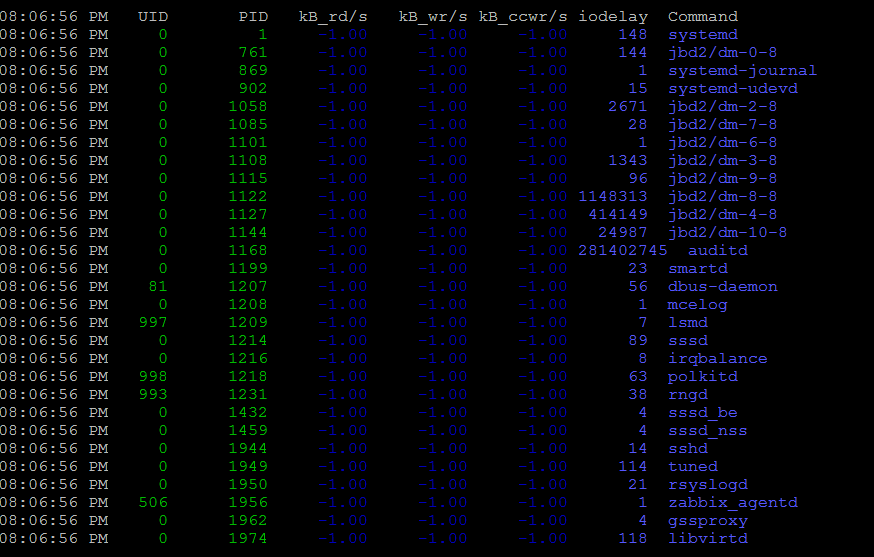
This report tells us that there is few processes with heave I/O use Filesystem system journalling daemon jbd2, apache, mysqld and supervise, in 3rd column you see their respective PID IDs.

To show threads used inside a process (like if you press SHIFT + H) inside Linux top command:

[hipo@server ~ ] $ pidstat -t -p 10765 1 3

Linux 4.19.0-14-amd64 (server)     28.09.2021     _x86_64_    (10 CPU)

21:41:22      UID      TGID       TID    %usr %system  %guest   %wait    %CPU   CPU  Command
21:41:23      108     10765         –    1,98    0,99    0,00    0,00    2,97     1  mysqld
21:41:23      108         –     10765    0,00    0,00    0,00    0,00    0,00     1  |__mysqld
21:41:23      108         –     10768    0,00    0,00    0,00    0,00    0,00     0  |__mysqld
21:41:23      108         –     10771    0,00    0,00    0,00    0,00    0,00     5  |__mysqld
21:41:23      108         –     10784    0,00    0,00    0,00    0,00    0,00     7  |__mysqld
21:41:23      108         –     10785    0,00    0,00    0,00    0,00    0,00     6  |__mysqld
21:41:23      108         –     10786    0,00    0,00    0,00    0,00    0,00     2  |__mysqld

10765 – is the Process ID whose threads you would like to list

With pidstat, you can further monitor processes for memory leaks with:

[hipo@server ~ ] $ pidstat -r 2


4. Report paging statistics for some old period


[root@server ~ ]# sar -B -f /var/log/sa/sa27 |head -n 10
Linux 4.18.0-240.el8.x86_64 (server)       09/27/2021      _x86_64_        (8 CPU)

15:42:26     LINUX RESTART      (8 CPU)

15:55:30     LINUX RESTART      (8 CPU)

04:00:01 PM  pgpgin/s pgpgout/s   fault/s  majflt/s  pgfree/s pgscank/s pgscand/s pgsteal/s    %vmeff
04:01:01 PM      0.00     14.47    629.17      0.00    502.53      0.00      0.00      0.00      0.00
04:02:01 PM      0.00     13.07    553.75      0.00    419.98      0.00      0.00      0.00      0.00
04:03:01 PM      0.00     11.67    548.13      0.00    411.80      0.00      0.00      0.00      0.00


5.  Monitor Received RX and Transmitted TX network traffic perl Network interface real time
 

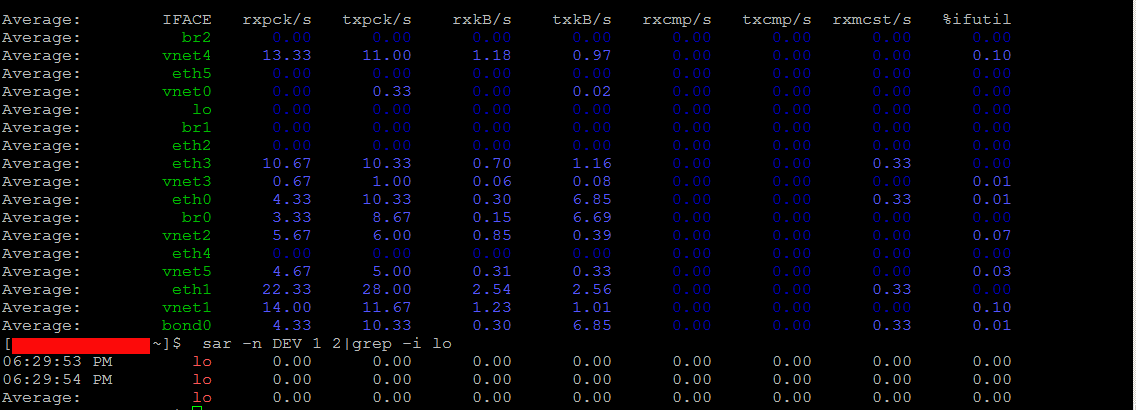
To print out Received and Send traffic per network interface 4 times in a raw

sar-sysstats-network-traffic-statistics-screenshot
 

[hipo@server ~ ] $ sar -n DEV 1 4


To continusly monitor all network interfaces I/O traffic

[hipo@server ~ ] $ sar -n DEV 1


To only monitor a certain network interface lets say loopback interface (127.0.0.1) received / transmitted bytes

[hipo@server yum.repos.d] $  sar -n DEV 1 2|grep -i lo
06:29:53 PM        lo      0.00      0.00      0.00      0.00      0.00      0.00      0.00      0.00
06:29:54 PM        lo      0.00      0.00      0.00      0.00      0.00      0.00      0.00      0.00
Average:           lo      0.00      0.00      0.00      0.00      0.00      0.00      0.00      0.00


6. Monitor block devices use
 

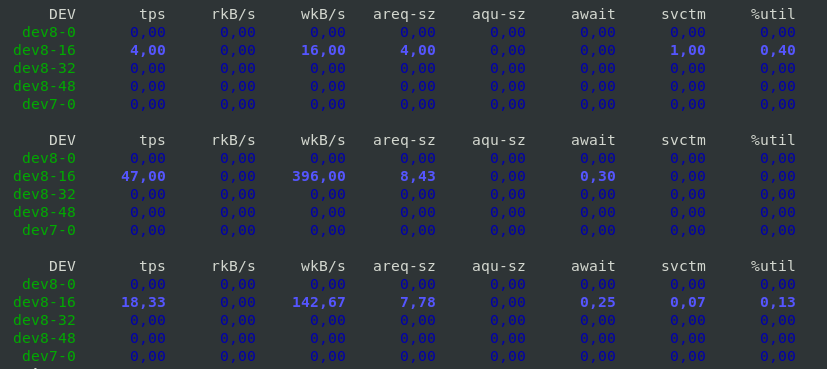
To check block devices use 3 times in a raw
 

[hipo@server yum.repos.d] $ sar -d 1 3


sar-sysstats-blockdevice-statistics-screenshot
 

7. Output server monitoring data in CSV database structured format


For preparing a nice graphs with Excel from CSV strucuted file format, you can dump the collected data as so:

 [root@server yum.repos.d]# sadf -d /var/log/sa/sa27 — -n DEV | grep -v lo|head -n 10
server-name-fqdn;-1;2021-09-27 13:42:26 UTC;LINUX-RESTART    (8 CPU)
# hostname;interval;timestamp;IFACE;rxpck/s;txpck/s;rxkB/s;txkB/s;rxcmp/s;txcmp/s;rxmcst/s;%ifutil
server-name-fqdn;-1;2021-09-27 13:55:30 UTC;LINUX-RESTART    (8 CPU)
# hostname;interval;timestamp;IFACE;rxpck/s;txpck/s;rxkB/s;txkB/s;rxcmp/s;txcmp/s;rxmcst/s;%ifutil
server-name-fqdn;60;2021-09-27 14:01:01 UTC;eth1;19.42;16.12;1.94;1.68;0.00;0.00;0.00;0.00
server-name-fqdn;60;2021-09-27 14:01:01 UTC;eth0;7.18;9.65;0.55;0.78;0.00;0.00;0.00;0.00
server-name-fqdn;60;2021-09-27 14:01:01 UTC;eth2;5.65;5.13;0.42;0.39;0.00;0.00;0.00;0.00
server-name-fqdn;60;2021-09-27 14:02:01 UTC;eth1;18.90;15.55;1.89;1.60;0.00;0.00;0.00;0.00
server-name-fqdn;60;2021-09-27 14:02:01 UTC;eth0;7.15;9.63;0.55;0.74;0.00;0.00;0.00;0.00
server-name-fqdn;60;2021-09-27 14:02:01 UTC;eth2;5.67;5.15;0.42;0.39;0.00;0.00;0.00;0.00

To graph the output data you can use Excel / LibreOffice's Excel equivalent Calc or if you need to dump a CSV sar output and generate it on the fly from a script  use gnuplot 


What we've learned?


How to install and enable on cron sysstats on Redhat and CentOS 8 Linux ? 
How to continuously monitor CPU / Disk and Network, block devices, paging use and processes and threads used by the kernel per process ?  
As well as how to export previously collected data to CSV to import to database or for later use inrder to generate graphic presentation of data.
Cheers ! 🙂


Get dmesg command kernel log report with human date / time timestamp on older Linux distributions

Friday, June 18th, 2021

how-to-get-dmesg-human-readable-timestamp-kernel-log-command-linux-logo

If you're a sysadmin you surely love to take a look at dmesg kernel log output. Usually on many Linux distributions there is a setup that dmesg keeps logging to log files /var/log/dmesg or /var/log/kern.log. But if you get some inherited old Linux servers it is quite possible that the previous machine maintainer did not enable the output of syslog to get logged in /var/log/{dmesg,kern.log,kernel.log}  or even have disabled the kernel log for some reason. Even though that in dmesg output you might find some interesting events reporting issues with Hard drives on its way to get broken / a bad / reads system processes crashing or whatever of other interesting information that could help you prevent severe servers downtimes or problems earlier but due to an old version of Linux distribution lets say Redhat 5 / Debian 6 or old CentOS / Fedora, the version of dmesg command shipped does not support the '-T' option that is present in util-linux package shipped with newer versions of  Redhat 7.X  / 8.X / SuSEs etc.  

 -T, –ctime
              Print human readable timestamps.  The timestamp could be inaccurate!

To illustrate better what I mean, here is an example from the non-human readable timestamp provided by older dmesg command

root@web-server~:# dmesg |tail -n 5
[4505913.361095] hid-generic 0003:1C4F:0002.000E: input,hidraw1: USB HID v1.10 Device [SIGMACHIP USB Keyboard] on usb-0000:00:1d.0-1.3/input1
[4558251.034024] Process accounting resumed
[4615396.191090] r8169 0000:03:00.0 eth1: Link is Down
[4615397.856950] r8169 0000:03:00.0 eth1: Link is Up – 100Mbps/Full – flow control rx/tx
[4644650.095723] Process accounting resumed

Thanksfully using below few lines of shell or perl scripts the dmesg -T  functionality could be added to the system , so you can easily get the proper timestamp out of the obscure default generated timestamp in the same manner as on newer distros.

Here is how to do with it with bash script:

#!/bin/sh paste in .bashrc and use dmesgt to get human readable timestamp
dmesg_with_human_timestamps () {
    FORMAT="%a %b %d %H:%M:%S %Y"


    now=$(date +%s)
    cputime_line=$(grep -m1 "\.clock" /proc/sched_debug)

    if [[ $cputime_line =~ [^0-9]*([0-9]*).* ]]; then
        cputime=$((BASH_REMATCH[1] / 1000))
    fi

    dmesg | while IFS= read -r line; do
        if [[ $line =~ ^\[\ *([0-9]+)\.[0-9]+\]\ (.*) ]]; then
            stamp=$((now-cputime+BASH_REMATCH[1]))
            echo "[$(date +”${FORMAT}” –date=@${stamp})] ${BASH_REMATCH[2]}"
        else
            echo "$line"
        fi
    done
}

Copy the script somewhere under lets say /usr/local/bin or wherever you like on the server and add into your HOME ~/.bashrc some alias like:
 

alias dmesgt=dmesg_with_timestamp.sh


You can get a copy dmesg_with_timestamp.sh of the script from here

Or you can use below few lines perl script to get the proper dmeg kernel date / time


#!/bin/perl
# on old Linux distros CentOS 6.0 etc. with dmesg (part of util-linux-ng-2.17.2-12.28.el6_9.2.x86_64) etc. dmesg -T not available
# workaround is little pl script below
dmesg_with_human_timestamps () {
    $(type -P dmesg) "$@" | perl -w -e 'use strict;
        my ($uptime) = do { local @ARGV="/proc/uptime";<>}; ($uptime) = ($uptime =~ /^(\d+)\./);
        foreach my $line (<>) {
            printf( ($line=~/^\[\s*(\d+)\.\d+\](.+)/) ? ( “[%s]%s\n", scalar localtime(time – $uptime + $1), $2 ) : $line )
        }'
}


Again to make use of the script put it under /usr/local/bin/check_dmesg_timestamp.pl

alias dmesgt=dmesg_with_human_timestamps

root@web-server:~# dmesgt | tail -n 20

[Sun Jun 13 15:51:49 2021] usb 2-1.3: USB disconnect, device number 9
[Sun Jun 13 15:51:50 2021] usb 2-1.3: new low-speed USB device number 10 using ehci-pci
[Sun Jun 13 15:51:50 2021] usb 2-1.3: New USB device found, idVendor=1c4f, idProduct=0002, bcdDevice= 1.10
[Sun Jun 13 15:51:50 2021] usb 2-1.3: New USB device strings: Mfr=1, Product=2, SerialNumber=0
[Sun Jun 13 15:51:50 2021] usb 2-1.3: Product: USB Keyboard
[Sun Jun 13 15:51:50 2021] usb 2-1.3: Manufacturer: SIGMACHIP
[Sun Jun 13 15:51:50 2021] input: SIGMACHIP USB Keyboard as /devices/pci0000:00/0000:00:1d.0/usb2/2-1/2-1.3/2-1.3:1.0/0003:1C4F:0002.000D/input/input25
[Sun Jun 13 15:51:50 2021] hid-generic 0003:1C4F:0002.000D: input,hidraw0: USB HID v1.10 Keyboard [SIGMACHIP USB Keyboard] on usb-0000:00:1d.0-1.3/input0
[Sun Jun 13 15:51:50 2021] input: SIGMACHIP USB Keyboard Consumer Control as /devices/pci0000:00/0000:00:1d.0/usb2/2-1/2-1.3/2-1.3:1.1/0003:1C4F:0002.000E/input/input26
[Sun Jun 13 15:51:50 2021] input: SIGMACHIP USB Keyboard System Control as /devices/pci0000:00/0000:00:1d.0/usb2/2-1/2-1.3/2-1.3:1.1/0003:1C4F:0002.000E/input/input27
[Sun Jun 13 15:51:50 2021] hid-generic 0003:1C4F:0002.000E: input,hidraw1: USB HID v1.10 Device [SIGMACHIP USB Keyboard] on usb-0000:00:1d.0-1.3/input1
[Mon Jun 14 06:24:08 2021] Process accounting resumed
[Mon Jun 14 22:16:33 2021] r8169 0000:03:00.0 eth1: Link is Down
[Mon Jun 14 22:16:34 2021] r8169 0000:03:00.0 eth1: Link is Up – 100Mbps/Full – flow control rx/tx

Squid Proxy log timestamp human readable / Convert and beautify Proxy unixtime logs in human-readable form howto

Thursday, February 21st, 2019

ccze-squid-access-log-colorized-with-log-analizer-linux-tool

If you have installed Squid Cache Proxy recently and you need to watch who is accessing the proxy and what Internet (website is viewed) under /var/log/squid/access.log /var/log/store.log /var/log/access.log etc., you will be unpleasently surprised the log's records are logged in a weird human unreadable format called UTC as Squid Proxy server does not store the date / year / hour time information in a human readable format.

Squid uses the format:
<UNIX timestamp>.<Centiseconds> and you have to be a robot of a kind or a math genious to read it 🙂

To display Squid Proxy log in a human readable, luckily you can use below one-liner  regular expression.
 

cat access.log | perl -p -e 's/^([0-9]*)/”[“.localtime($1).”]"/e'


If you have to review squid logs multiple times and on a regular basis you can either set some kind of cmd alias in $HOME/.bashrc such as:

alias readproxylog='cat access.log | perl -p -e 's/^([0-9]*)/”[“.localtime($1).”]"/e'

Or for those who prefer beauty install and use a log beatifier / colorizer such as ccze
 

root@pcfreak:/home/hipo# apt-cache show ccze|grep -i desc -A 3
Description-en: robust, modular log coloriser
 CCZE is a robust and modular log coloriser, with plugins for apm,
 exim, fetchmail, httpd, postfix, procmail, squid, syslog, ulogd,
 vsftpd, xferlog and more.

Description-md5: 55cd93dbcf614712a4d89cb3489414f6
Homepage: https://github.com/madhouse/ccze
Tag: devel::prettyprint, implemented-in::c, interface::commandline,
 role::program, scope::utility, use::checking, use::filtering,

root@pcfreak:/home/hipo# apt-get install –yes ccze


tail -f /var/log/squid/access.loc | ccze -CA


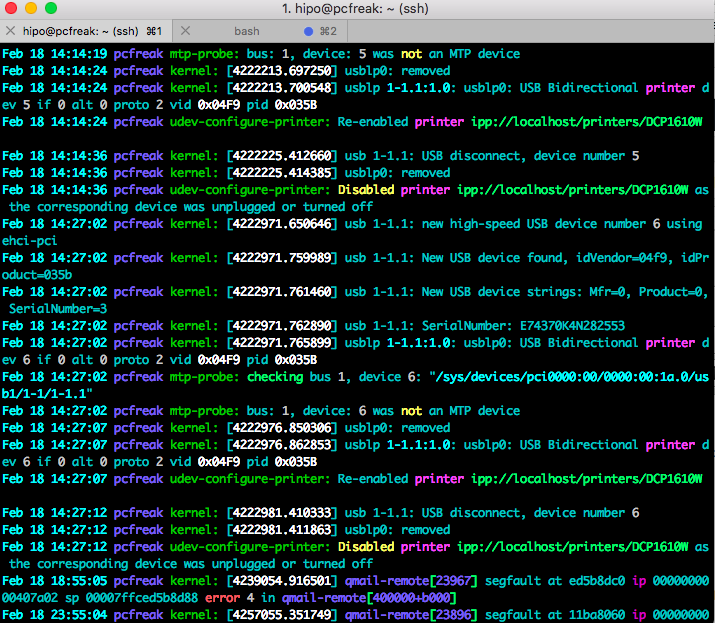
ccze is really nice to view /var/log/syslog errors and make your daily sysadmin life a bit more colorful


tail -f -n 200 /var/log/messages | ccze


tail-ccze-syslog-screenshot viewing in Colors your Linux logs

For a frequent tail + ccze usage with ccze you can add to ~/.bashrc following shell small function
 

tailc () { tail $@ | ccze -A }


Below is a list of supported syntax highlighting colorizer:

$ ccze -l
Available plugins:

Name      | Type    | Description
————————————————————
apm       | Partial | Coloriser for APM sub-logs.
distcc    | Full    | Coloriser for distcc(1) logs.
dpkg      | Full    | Coloriser for dpkg logs.
exim      | Full    | Coloriser for exim logs.
fetchmail | Partial | Coloriser for fetchmail(1) sub-logs.
ftpstats  | Full    | Coloriser for ftpstats (pure-ftpd) logs.
httpd     | Full    | Coloriser for generic HTTPD access and error logs.
icecast   | Full    | Coloriser for Icecast(8) logs.
oops      | Full    | Coloriser for oops proxy logs.
php       | Full    | Coloriser for PHP logs.
postfix   | Partial | Coloriser for postfix(1) sub-logs.
procmail  | Full    | Coloriser for procmail(1) logs.
proftpd   | Full    | Coloriser for proftpd access and auth logs.
squid     | Full    | Coloriser for squid access, store and cache logs.
sulog     | Full    | Coloriser for su(1) logs.
super     | Full    | Coloriser for super(1) logs.
syslog    | Full    | Generic syslog(8) log coloriser.
ulogd     | Partial | Coloriser for ulogd sub-logs.
vsftpd    | Full    | Coloriser for vsftpd(8) logs.
xferlog   | Full    | Generic xferlog coloriser.

At many cases for sysadmins like me that prefer clarity over obscurity, even a better solution is to just change in /etc/squid/squid.conf
the logging to turn it in human-readable form
, to do so add to config somewhere:


Logformat squid %tl.%03tu %6tr %>a %Ss/%03Hs %


You will get log output in format like:


18/Feb/2019:18:38:47 +0200.538 4787 y.y.y.y TCP_MISS/200 41841 GET https://google.com – DIRECT/x.x.x.x text/html


SQUID's format recognized parameters in above example are as follows:


%    a literal % character
>a    Client source IP address
>A    Client FQDN
>p    Client source port
la    Local IP address (http_port)
lp    Local port number (http_port)
sn    Unique sequence number per log line entry
ts    Seconds since epoch
tu    subsecond time (milliseconds)
tl    Local time. Optional strftime format argument
default %d/%b/%Y:%H:%M:%S %z
tg    GMT time. Optional strftime format argument
default %d/%b/%Y:%H:%M:%S %z
tr    Response time (milliseconds)
dt    Total time spent making DNS lookups (milliseconds)