Posts Tagged ‘statistics’

Linux: Understanding uptime command Load Avarage statistics / When load avarage is high?

Wednesday, May 8th, 2013

GNU / Linux load avarage explained load avarage from top command

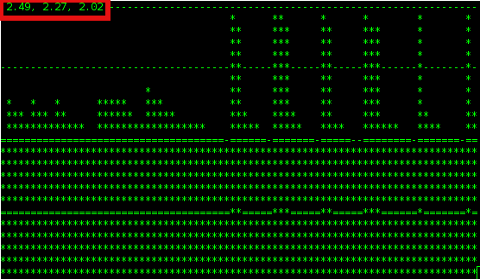
There is probably no Linux system administrator who, don't have idea about system  Load Avarage. Most of admins however does have some brought idea about what kind of load avarage is critical but doesn't have good understanding on the 3 digits returned as a load avarage i.e. – load average: 2.47, 2.27, 2.02 shown in above ascii graphs ( generated by tload command).
 

What is Load Avarage ?

  •  The number of blocking processes in the run queue averaged over a certain time period.

A blocking process is a process that is waiting for something to continue. Typically, a process is waiting to use:
 

  •  CPU Time,  Disk Input / Output oper. or Network I / O

Thus logically the higher the Load Avarage, the more processes has to wait for access to CPU, HDD and Network I/O.

The most two common commands used where load avarage appear are;
 

w – who

and

uptime

mx:/home/hipo# w
 11:07:56 up 513 days,  1:04,  1 user,  load average: 1.92, 1.95, 1.84
USER     TTY      FROM              LOGIN@   IDLE   JCPU   PCPU WHAT
hipo     pts/0    www.pc-freak.net     Thu19    0.00s  0.06s  0.02s sshd: hipo [priv]

mail:/home/hipo# uptime
 11:03:59 up 513 days,  1:00,  2 users,  load average: 2.11, 1.91, 1.81

Other common place to check load avarage is in top cmd:

mail:/home/hipo# top

Linux top command load avarage showing server system load 3 digits of load avarage explained

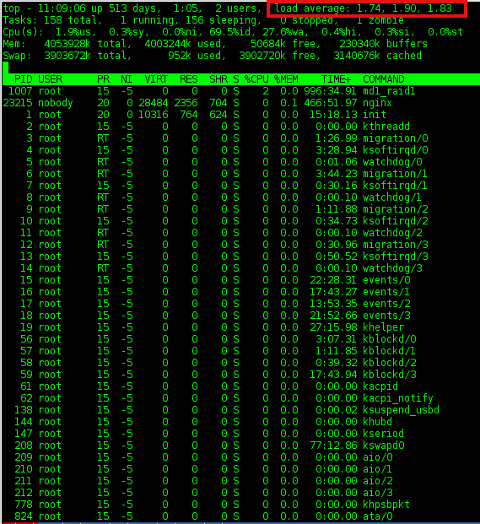
a) Optimum machine use – Load Avarage 1 

So what does load avarage: 1.74, 1.90, 1.83 really means? The 3 digits are showing system load avarage over the last 1, 5 and 15 minutes time. Meaning;


– before 1 minute system had a load of 1.74
– 5 minutes before it was 1.90
– and 15 minutes back 1.83

Usually Load Avarage of more than 1 is considered critical. If a system is working with a load avarage of 1 this means the system is working capacity. In best cases in terms of optimizing processes on server with hardware it is good the system is working in load of 0.70 or 0.80. Whether a traffic the machine gets is planned in most cases a load avarage of exactly 1 means machine hardware is properly utilized. However whether the load avarage is hitting over 1 this usually means you have to think about moving server to new hardware. It is general rule of thumb that if system load is exceeeding 0.70 it is time to migrate to better hardware.

b) Load avarage on Multi-core / Multiprocessor servers

Load avarage of 4 on 4 CPU cores server hardware is optimum one. Each core / CPU on machine should get maximum of load avarage 1. Load avarage of 1 means CPU is utilized in 100%. Load avarage of 4 on 4 CPU server hardware means all 4 processors are working in their maximum power of 100%. For people who have multi processor server the best way to show utilization is by running htop. There all 4 CPUs will show idle of 0%.

Hence rule to calculate normal load avarage for server is;

1 Load Avarage per CPU. Therefore for 24 CPU Intel Xeon hardware. Load Avarage under 1*24.00 = 24.00 is considered normal. On such a server whether load avarage jumps to 50.00 / 70.00 or above server becomes totally irresponsive and it is very likely to hang because of over-heating. Even if it continues working it will work extremely slow and even simply operations like ssh to it will become hardly possible and sometimes even access via ssh will be not possible.

Therefore Rule of Thumb for calculating which load avarage is okay for a server is;

Number of CPU / Cores should not exceed digit returned in Load Avarage stats

c) Critical – Load avarage >5 – A sure sign for unresponsive or soon to hang server

On Computers with just 1 CPU, load avarage of 5 is sure sign running services will lag brutally and server will become inaccessible. For multicore / multiprocessor servers big troubles can be expected, whether load avarage is about  1/2 of the maximum number of of Load Avarage; (for 8 CPU Multicore hardware). A load avarage of 8 + ( 1/2 * 8 ) = 12 is sure sign system is stoned and running services inaccessible.

d) load avarage: 1.74, 1.90, 1.83 – Is 1 / 5 or 15 minutes LA numbers more important to consider?

All are important however 5 and 15 minutes load avg. give better indication on what's happening with machine as current load can peak for just a second to a higher number, being misleading.

To get number of CPU / Cores use cmd;

mail:/home/hipo# grep 'model name' /proc/cpuinfo | wc -l
24

For more precise info on CPU type and model use;

mail:/home/hipo# cat /proc/cpuinfo

processor       : 0
vendor_id       : GenuineIntel
cpu family      : 6
model           : 44
model name      : Intel(R) Xeon(R) CPU           E5645  @ 2.40GHz
stepping        : 2
cpu MHz         : 2400.094
cache size      : 12288 KB
physical id     : 0
siblings        : 12
core id         : 0
cpu cores       : 6
apicid          : 0
initial apicid  : 0
fpu             : yes
fpu_exception   : yes
cpuid level     : 11
wp              : yes
flags           : fpu vme de pse tsc msr pae mce cx8 apic sep mtrr pge mca cmov pat pse36 clflush dts acpi mmx fxsr sse sse2 ss ht tm pbe syscall nx pdpe1gb rdtscp lm constant_tsc arch_perfmon pebs bts rep_good xtopology nonstop_tsc aperfmperf pni dtes64 monitor ds_cpl vmx smx est tm2 ssse3 cx16 xtpr pdcm dca sse4_1 sse4_2 popcnt lahf_lm ida arat tpr_shadow vnmi flexpriority ept vpid
bogomips        : 4800.18
clflush size    : 64
cache_alignment : 64
address sizes   : 40 bits physical, 48 bits virtual
power management:
……
………
 

If you hit abnormal high load avarage, it is useful to check in top process list what is top process / processes causing highest system load. It is useful to run ps with following arguments

mail:/home/hipo# ps axuwwf

Look in STAT column. Processes in STAT have 3 states;

  • R – Running
  • S – Sleeping
  • D – Waiting for something

Usually processes with status of D – are ones causing problems. If you get D STAT-ed processes check further what's wrong with them and fix it. If there are none,  simply, number of clients using machine pop-ed up meaning you need to quickly move to better hardware host.

e) Getting notified via email whether load avarage exceeds certain value

A good way to get notified or do certain action like restarting Apache WebServer or other common process causing high loads is through monit. Monit is very usefukl for notifying on high load avarages or even better for Restarting processes imposing high loads.

You can always use a few liners shell script to mail to email or SMS2Email mailbox similar to this tiny shell script to restart apache on high load.There is also a Ruby lang tool – Scout to monitor and report high load avarages

How to install Awstats Apache weblog statistics on Debian Squeeze GNU Linux

Monday, October 8th, 2012

I like using Webalizer to keep an eye in web of my access.log, however since the information it shows is a bit chaotic and much less than one in Awstats statistics, I decided to install awstats. I haven’t installed awstats for a long time so I have no exact memory how I previously did it and hence run quick search too see if there is information on specifics concerning Debian Squeeze. I did not find any specific article and therefore decided to write this short one to document how awstats install is done on Debian Squeeze Linux.

1. Installing awstats deb package

There is already a deb package so no need to hunt for specific perl CPAN modules and manually fulfill dependencies.

Installation is as straight as any other deb package:


debian:~# apt-get install --yes awstats
...

2. Change basic awstats.conf configurations to make it properly working

First thing to do immediately after install is to set the primary SiteDomain= for which Awstats will process site statistics.

For that in the beginning (first line) of /etc/awstats/awstats.conf add directive:


SiteDomain="www.your-domain-name.com"

Substitution www.your-domain-name.com with whatever your primary domain will be.

Next in /etc/awstats/awstats.conf change value for DNSLookup. By default DNSLookup is 1, which means each of the IP request in /var/log/apache2/access.log is attempted be resolved via separate DNS request; Most IP Addresses that have quieried Apache webserver however miss proper PTR DNS record and hence attempts to be resolved fail after 10 to 20 seconds.
The overall result of this is processing execution of /var/log/apache2/access.log takes hours in case access.log is >100MB or so. This slow processing slowness is due to failed DNS requests. Besides that it does useless hundreds of queries to DNS servers which take up bandwidth for nothing …

To prevent this I disabled immediately DNSLookup right after install by substituting


DNSLookup=1

with:


DNSLookup=0

Other thing is by default Awstats is set to use LogFormat=4. As you can read in awstats.conf (Comments section) 4 stands for:


# 4 - Apache or Squid native common log format (NCSA common/CLF log format)

However in Debian Linux Apache2 default config is done in a way that Apache keeps logged requests formatted in combined (not in common log

Here is LogFormat directive extracted from /etc/apache2/apache2.conf:


LogFormat "%v:%p %h %l %u %t \"%r\" %>s %O \"%{Referer}i\" \"%{User-Agent}i\"" vhost_combined
LogFormat "%h %l %u %t \"%r\" %>s %O" common
LogFormat "%{Referer}i -> %U" referer
LogFormat "%{User-agent}i" agent

With that said in awstats.conf to match (combined) Apache set logging change LogFormat to 1:


LogFormat=1

3. Generate manual AWStats access.log statistics for first time

You will have to run as superuser following cmd:


debian:~# /usr/lib/cgi-bin/awstats.pl -config=/etc/awstats/awstats.conf
Create/Update database for config "/etc/awstats/awstats.conf" by AWStats version 6.95 (build 1.943)
From data in log file "/var/log/apache2/access.log"...
Phase 1 : First bypass old records, searching new record...
Searching new records from beginning of log file...
Phase 2 : Now process new records (Flush history on disk after 20000 hosts)...
Flush history file on disk (unique url reach flush limit of 5000)
Jumped lines in file: 0
Parsed lines in file: 602983
Found 8 dropped records,
Found 5 corrupted records,
Found 0 old records,
Found 602970 new qualified records.

4. Access awstats statistics in Web Browser

Once the command execution completes, open in Epiphany, Firefox or whatever browser you like URL:


http://www.your-domain-name.com/cgi-bin//awstats.pl?config

If all is okay you should see some numbers on Unique Visitors like in below browser screenshot:

Screenshot Awstats example Statistics for www.pc-freak.net in Epiphany

5. Set ScriptAlias for easier awstats access path and set directory permissions

In /etc/apache2/apache2.conf or in VirtualHost file, lets say /etc/apache2/sites-enabled/your-domain-name.com, place following configs:


Alias /awstats-icon/ /usr/share/awstats/icon/
ScriptAlias /awstats/ /usr/lib/cgi-bin/

Options None
AllowOverride None
Order allow,deny
Allow from all

For new configs to take effect as usual Apache should be restarted:


debian:~# /etc/init.d/apache2 restart
....

From now on Awstats can be accessed via the much easier to remember access URL:


http://your-domain-name.com/awstats/awstats.pl

6. Protecting Awstats statistics with Apache HTACCESS password

It is a must to protect awstats statistics with password via .htaccess and htpasswd

a.) Use htpasswd to generate user/pass:


linux:~# htpasswd -c /etc/apache2/awstats.passwd admin
New password:
Re-type new password:
Adding password for user admin

b.) Create /usr/lib/cgi-bin/.htaccess with following content:


linux:~# vim /usr/lib/cgi-bin/.htaccess

AuthType Basic
AuthUserFile /etc/apache2/awstats.passwd
AuthGroupFile /dev/null
AuthName "Please Enter Password to access AWstat"
AuthType Basic
Require valid-user

7. Set awstats to generate statistics via daily cron job:

awstats binary deb automatically installs a cron job in /etc/cron.d/awstats:


linux:~# cat /etc/cron.d/awstats
*/10 * * * * www-data [ -x /usr/share/awstats/tools/update.sh ] && /usr/share/awstats/tools/update.sh
# Generate static reports:
10 03 * * * www-data [ -x /usr/share/awstats/tools/buildstatic.sh ] && /usr/share/awstats/tools/buildstatic.sh

I prefer not to use it but use a custom root cron job. To stop /etc/cron.d/awstats from executing I move it to /root:


mv /etc/cron.d/awstats /root

Then I set a new root user cron job to process Apache access.log. The reason I use root user crontab, instead of Apache’s www-data is with www-data user, /var/log/apache2/access.log is unreadable ,…


linux:~# crontab -u root -e
8,18,27,38,48,59 * * * * [ -x /usr/lib/cgi-bin/awstats.pl -a -f /etc/awstats/awstats.conf -a -r /var/log/apache2/access.log ] && /usr/lib/cgi-bin/awstats.pl -config=awstats -update >/dev/null

This cron makes awstats web statistics be refreshed every our in minutes 8,18,27,38,48,59.

That’s it. Enjoy 🙂

How to add visitor/visitors counter in Joomla based website using the VINAORA joomla plugin

Wednesday, December 29th, 2010

One of the websites based on Joomla, that I’m managing, had to have the option to show a Visitors Counter on the page bottom.

I did some research online to check for some Joomla plugins that are capable of aiming my Joomla installation with the Visitor Counter feature.

There are a couple of plugins available out there that are able to provide a Joomla installation with a Web Counter, however I’ll just mention the few which I have tested myself.
The ones I’ve tested myself are;

1. VCNT
2. Count your Visitors
3. Cool Hits Counter
and finally the one that I really liked the most:

4. VINAORA

All the prior 3 aforementioned VCNT, Count your Visitors and Cool Hits Counter, are actually working right after installation. I haven’t had the time to test them thoroughfully but from a first look they appear to be counting the visitors.

The Count your visitors – joomla plugin’s download main page was in German with no option to revert to English, so that wasn’t nice.

Though the plugin seems to work fine after just downloaded and installed and configured from

Extensions -> Module Manager

The configuration options for Count your visitors are quite obscure but if you’re a looking for a really simple way to count your Joomla based website visitors it might be a good choice. The plugin is based on the initial Joomla module called Statistics.

By the way I’ve read some reports online that actually Joomla 1.5 also includes some kind of minimal integrated web counter embedded in itself throughout the Joomla Statistics module .
However I personally couldn’t really follow the methods describe to take advantage of the Joomla install integrated Statistics module, however if somebody has already succeeded in using the Statistics default joomla module I’ll be glad, if he shares with me.

I’ve found the VCNT visitor statistics plugin a handy one, but this module had this major problem that the VCNT 1.5 text which was appearing as a heading before the statistics was hard to wipe out of my web page, so eventually I got pissed of and thought and tested the Cool Hits Counter.

The Cool Hits Counter is actually a simplistic module which presents a counter about visitors on the web site in numeric digit numbers.
These module uses the integrated Joomla 1.5 module mod_stats the only difference is the support for numeric digit numbers.

As I’ve said none of the above modules wasn’t flexible enough and therefore wasn’t what I was looking for, thus I decided to use my installed VINAORA Joomla web(users) counter plugin.

The VINAORA is actually quite straight foward to configure, right after installation to start with the configuration I had to navigate to:

Extension -> Module Manager -> Vinaora Visitors Counter -> Module Parameters

Since I wanted just a simple counter without any external statistics I personally prefered using Vinaora’s counter with the optionsDisplay Mode: Simple as well as the Zero-Statistics turned on to (Yes)

Some of the other options I found to be best matching my desires for the Visitors Counter was:

Show Title: No and Position: Left

Now I had this shiny visitors statistics in my Joomla installation but there was the annoying Link in my Visitors Counter appearing on the page, thus in order to remove the default link Visitors Counter which was pointing to the VINAORA’s web page, I had to edit the file:
modules/mod_vvisit_counter/tmpl/default.php located in my Joomla Document Root directory.

First I’ve edited the code on line 21 where I’ve removed out the Vinaora string since I didn’t wanted any reference to Vinaora to occur in my Joomla HTML code.

In line 162 in the code:

$html .= ….

By removing it I’ve completed scraped out the annoying references to VINAORA and their link to http://vinaora.com website and thus made the Visitors counter a look a bit more professional.

Now the counter is working with a graphical numeric digits and everything is just fine with my Web counter Joomla counter thanks to VINAORA 🙂
 

diskinfo Linux hdparm FreeBSD equivalent command for disk info and benchmarking

Thursday, March 8th, 2012

FreeBSD Linux hdparm equivalent is diskinfo artistic logo

On Linux there is the hdparm tool for various hard disk benchmarking and extraction of hard disk operations info.
As the Linux manual states hdparmget/set SATA/IDE device parameters

Most Linux users should already know it and might wonder if there is hdparm port or equivalent for FreeBSD, the aim of this short post is to shed some light on that.

The typical use of hdparm is like this:

linux:~# hdparm -t /dev/sda8

/dev/sda8:
Timing buffered disk reads: 76 MB in 3.03 seconds = 25.12 MB/sec
linux:~# hdparm -T /dev/sda8
/dev/sda8:
Timing cached reads: 1618 MB in 2.00 seconds = 809.49 MB/sec

The above output here is from my notebook Lenovo R61i.
If you're looking for alternative command to hdparm you should know in FreeBSD / OpenBSD / NetBSD, there is no exact hdparm equivalent command.
The somehow similar hdparm equivallent command for BSDs (FreeBSD etc.) is:
diskinfo

diskinfo is not so feature rich as linux's hdparm. It is just a simple command to show basic information for hard disk operations without no possibility to tune any hdd I/O and seek operations.
All diskinfo does is to show statistics for a hard drive seek times I/O overheads. The command takes only 3 arguments.

The most basic and classical use of the command is:

freebsd# diskinfo -t /dev/ad0s1a
/dev/ad0s1a
512 # sectorsize
20971520000 # mediasize in bytes (20G)
40960000 # mediasize in sectors
40634 # Cylinders according to firmware.
16 # Heads according to firmware.
63 # Sectors according to firmware.
ad:4JV48BXJs0s0 # Disk ident.

Seek times:
Full stroke: 250 iter in 3.272735 sec = 13.091 msec
Half stroke: 250 iter in 3.507849 sec = 14.031 msec
Quarter stroke: 500 iter in 9.705555 sec = 19.411 msec
Short forward: 400 iter in 2.605652 sec = 6.514 msec
Short backward: 400 iter in 4.333490 sec = 10.834 msec
Seq outer: 2048 iter in 1.150611 sec = 0.562 msec
Seq inner: 2048 iter in 0.215104 sec = 0.105 msec

Transfer rates:
outside: 102400 kbytes in 3.056943 sec = 33498 kbytes/sec
middle: 102400 kbytes in 2.696326 sec = 37978 kbytes/sec
inside: 102400 kbytes in 3.178711 sec = 32214 kbytes/sec

Another common use of diskinfo is to measure hdd I/O command overheads with -c argument:

freebsd# diskinfo -c /dev/ad0s1e
/dev/ad0s1e
512 # sectorsize
39112312320 # mediasize in bytes (36G)
76391235 # mediasize in sectors
75784 # Cylinders according to firmware.
16 # Heads according to firmware.
63 # Sectors according to firmware.
ad:4JV48BXJs0s4 # Disk ident.

I/O command overhead:
time to read 10MB block 1.828021 sec = 0.089 msec/sector
time to read 20480 sectors 4.435214 sec = 0.217 msec/sector
calculated command overhead = 0.127 msec/sector

Above diskinfo output is from my FreeBSD home router.

As you can see, the time to read 10MB block on my hard drive is 1.828021 (which is very high number),
this is a sign the hard disk experience too many read/writes and therefore needs to be shortly replaced with newer faster one.
diskinfo is part of the basis bsd install (bsd world). So it can be used without installing any bsd ports or binary packages.

For the purpose of stress testing hdd, or just some more detailed benchmarking on FreeBSD there are plenty of other tools as well.
Just to name a few:
 

  • rawio – obsolete in FreeBSD 7.x version branch (not available in BSD 7.2 and higher)
  • iozone, iozone21 – Tools to test the speed of sequential I/O to files
  • bonnie++ – benchmark tool capable of performing number of simple fs tests
  • bonnie – predecessor filesystem benchmark tool to bonnie++
  • raidtest – test performance of storage devices
  • mdtest – Software to test metadata performance on filsystems
  • filebench – tool for micro-benchmarking storage subsystems

Linux hdparm allows also changing / setting various hdd ATA and SATA settings. Similarly, to set and change ATA / SATA settings on FreeBSD there is the:

  • ataidle

tool.

As of time of writting ataidle is in port path /usr/ports/sysutils/ataidle/

To check it out install it as usual from the port location:

FreeBSD also has also the spindown port – a small program for handling automated spinning down ofSCSI harddrive
spindown is useful in setting values to SATA drives which has problems with properly controlling HDD power management.

To keep constant track on hard disk operations and preliminary warning in case of failing hard disks on FreeBSD there is also smartd service, just like in Linux.
smartd enables you to to control and monitor storage systems using the Self-Monitoring, Analysisand Reporting Technology System (S.M.A.R.T.) built into most modern ATA and SCSI hard disks.
smartd and smartctl are installable via the port /usr/ports/sysutils/smartmontools.

To install and use smartd, ataidle and spindown run:

freebsd# cd /usr/ports/sysutils/smartmontools
freebsd# make && make install clean
freebsd# cd /usr/ports/sysutils/ataidle/
freebsd# make && make install clean
freebsd# cd /usr/ports/sysutils/spindown/
freebsd# make && make install clean

Check each one's manual for more info.

Knowing Not! :]

Monday, January 22nd, 2007

Today I have Marketing exam. Ofcourse as usual when I have exams I haven’t studied enough, and again I’m in the situation realizing I don’t know anything. I depend 100% on God’s grace to take that exam. Why I’m so dumb never study when

I have what I have. I can’t change my self I can’t study something I’m not interested into. Marketing is a subject which is simple but for Jerks IMHO :]. The logic of marketing is too abstract.

And yes what’s happening with me the last days. Well I’m feeling good now Praise the Lord. I’ve no idea what I should do with my life. I have 2 re-exams for now or maybe 3 ( I don’t know the results from the Research & Statistics Exam ).

The last few days I ran FreeDOS and Windows 2000 Pro SP4 under FreeBSD 6.2 with qemu. FreeDOS’s performance is very nice despite the fact it is emulated. The Windows is running a little laggish although I ran it with kqemu ( Experimental Module for qemu which enhances the typical qemu speed ). Yesterday we drink a dark beer with Nomen into the “Happy Person” Pub. My passion for computers is starting to come back again.

No Title

Tuesday, February 26th, 2008

Today I helped my cousing to fix his internet connection on a laptop.
The laptop was running Vista. A real nightmare, this OS is really heavy and even messier than Windows XP.
What else I’m trying to cope with life. Life is tough. What I can say….

Also I started a vsftp server on a FreeBSD box it took me some time because of configuration issues.

Right now I’mtrying to run a snort server still unsuccessfully for some reason the snort daemon does not start.

In the college everything is going in the old manner, except we have started studying Marketing II and another subject I forgot the name it is supposed to be something like statistics. The day was quiet with a bit of work.

END—–

Fix vnstat error “eth0: Not enough data available yet.” on Debian GNU / Linux

Monday, November 21st, 2011

Vnstat GNU Linux console terminal traffic statistics logo

After installing vnstat to keep an eye on server IN and OUT traffic on a Debian Squeeze server. I used the usual:

debian:~# vnstat -u -i eth0

In order to generate the initial database for the ethernet interface used by vnstat to generate its statistics.

However even though /var/lib/vnstat/eth0 got generated with above command statistics were not further generated and trying to check them with command:

debian:~# vnstat --days

Returned the error message:

eth0: Not enough data available yet.

To solve the eth0: Not enough data available yet. message I tried completely removing vnstat package by purging the package e.g.:

debian:~# apt-get --yes remove vnstat
...
debian:~# dpkg --purge vnstat
...

Even though dpkg –purge was invoked /var/lib/vnstat/ refused to be removed since it contained vnstat’s db file eth0

Therefore I deleted by hand before installing again vnstat:

debian:~# rm -rf /var/lib/vnstat/

Tried installing once again vnstat “from scratch”:

debian:~# apt-get install vnstat
...

After that I tried regenerating the vnstat db file eth0 once again with vnstat -u -i eth0 , hoping this should fix the error but it was no go and after that the error:

debian:~# vnstat --hours
eth0: Not enough data available yet.

persisted.

I checked in Debian bugs mailing lists and I found, some people complaining about the same issue with some suggsetions on how the error can be work arouned, anyways none of the suggestions worked for me.

Being irritated I further removed / purged once again vnstat and decided to give it a try by installing vnstat from source
As of time of writting this article, the latest stable vnstat version is 1.11 .
Therefore to install vnstat from source I issued:

debian:~# cd /usr/local/src
debian:/usr/local/src# wget http://humdi.net/vnstat/vnstat-1.11.tar.gz
...
debian:/usr/local/src# tar -zxvvf vnstat-1.11.tar.gz
debian:/usr/local/src# cd vnstat-1.11
debian:/usr/local/src/vnstat-1.11# make & make all & make install
debian:/usr/local/src/vnstat-1.11# cp examples/vnstat.cron /etc/cron.d/vnstat
debian:/usr/local/src/vnstat-1.11# vnstat -u -i eth0
Error: Unable to read database "/var/lib/vnstat/eth0".
Info: -> A new database has been created.

As a last step I put on root crontab to execute:

debian:~# crontab -u root -e

*/5 * * * * /usr/bin/vnstat -u >/dev/null 2>&1

This line updated vnstat db eth0 database, every 5 minutes. After the manual source install vnstat works, just fine 😉

Installing qmailmrtg (qmail graph statistics on qmail activity) on Debian Lenny

Monday, April 19th, 2010

1. First it’s necessery to have the mrtg debian package installed.
If it’s not installed then we have to install it:

debian-server:~# apt-get install mrtg

2. Second download the qmailmrtg source binary
To download the latest current source release of qmailmrtg execute:

debian-server:~# wget http://www.inter7.com/qmailmrtg7/qmailmrtg7-4.2.tar.gz

It’s a pity qmailmrtg is not available for download via debian repositories.

3. Third download the qmail.mrtg.cfg configuration file

debian-server~# wget https://www.pc-freak.net/files/qmail.mrtg.cfg

Now you have to put the file somewhere, usually it’s best to put it in the /etc/ directory.
Make sure the file is existing in /etc/qmail.mrtg.cfg
4. Untar compile and install qmailmrtg binary


debian-server:~# tar -xzvvf qmailmrtg7-4.2.tar.gz
...
debian-server:~# make && make install

strip qmailmrtg7
cp qmailmrtg7 /usr/local/bin
rm -rf *.o qmailmrtg7 checkq core
cc checkq.c -o checkq
./checkq
cc -s -O qmailmrtg7.c -o qmailmrtg7
qmailmrtg7.c: In function ‘main’:
qmailmrtg7.c:69: warning: incompatible implicit declaration of
built-in function ‘exit’
qmailmrtg7.c:93: warning: incompatible implicit declaration of
built-in function ‘exit’
qmailmrtg7.c:131: warning: incompatible implicit declaration of
built-in function ‘exit’
qmailmrtg7.c:137: warning: incompatible implicit declaration of
built-in function ‘exit’

5. Set proper file permissions according to the user you indent to execute qmailmrtg as
I personally execute it as root user, if you intend to do so as well set a permissions to
/etc/qmail.mrtg.cfg of 700.
In order to do that issue the command:

debian-server:~# chmod 700 /etc/qmail.mrtg.cfg

6. You will now need to modify the qmail.mrtg.cfg according to your needs
There you have to set a proper location where the qmailmrtg shall generate it’s html data files.
I use the /var/www/qmailmrtg qmailmrtg log file location. If you will do so as wellyou have to create the directory.

7. Create qmailmrtg html log files directory

debian-server:~# mkdir /var/log/qmailmrtg

8. Now all left is to set a proper cron line to periodically invoke qmailmrtg in order to generate qmail activity statistics.

Before we add the desired root’s crontab instructions we have to open the crontab for edit, using the command.

debian-server:~# crontab -u root -e

I personally use and recommend the following line as a line to be added to root’s crontab.

0-55/5 * * * * env LANG=C /usr/bin/mrtg /etc/qmail.mrtg.cfg > /dev/null
9. Copy index.html from qmailmrtg source directory to /var/log/qmailmrtg


debian-server:/usr/local/src/qmailmrtg7-4.2# cp -rpf index.html /var/log/qmailmrtg

10. Last step is to make sure Apache’s configuration contains lines that will enable you to access the qmail activity statistics.

The quickest way to do that in Debian running Apache 2.2 is to edit /etc/apache2/apache2.conf and add a directory Alias as follows

Alias /qmailmrtg/ "/var/www/qmailmrtg/"

Now after Apache restart /etc/init.d/apache2 restart
You should be now able to access the qmail mrtg qmail log statistics through your Apache’s default configured host.
For instance, assuming your default configured Apache host is domain.com. You’ll be able to reach the qmailmrtg statistics through an url like:

http://domain.com/qmailmrtg/

After I verified and ensured myself qmail mrtg is working correctly after all the above explained steps partook I wasn’t happy with some headlines in the index.html and the html tile of qmailmrtg,
so as a last step I manually edited the /var/www/qmailmrtg/index.html to attune it to my likings.

Here is a screenshot of the qmailmrtg web statistics in action.

qmail mrtg on debian lenny