As Docker containerization is starting to become a standard for installing a brand new servers especially servers who live in Self-Made Clusters based on Orchestration technologites like Kubernetes (k8s) (check out – http://kubernetes.io),
Recently, I've had the task to set-up a Squid Cache (Open Proxy) server on a custom Port number to make it harder for internet open proxy scanners to identify and ship it to a customer.
What is Squid Open Proxy?
An open proxy is a proxy server that is accessible by any Internet user, in other words anyone could access the proxy without any authentication.
Squid is a caching proxy for the Web supporting HTTP, HTTPS, FTP and other protocols.
It reduces bandwidth and improves response times by caching and reusing frequently-requested web pages.
Squid has extensive access controls and makes a great server accelerator.
It runs on most available operating systems, including Windows and is licensed under the GNU GPL.
What is Docker?
For those who hear about Docker for a first time, Docker is an open-source software platform to create, deploy and manage virtualized application containers on a common OS such as GNU / Linux or Windows, it has a surrounding ecosystem of tools. Besides its open source version there is also a commercial version of the product by Docker Inc. the original company that developed docker and is today in active help of the project.
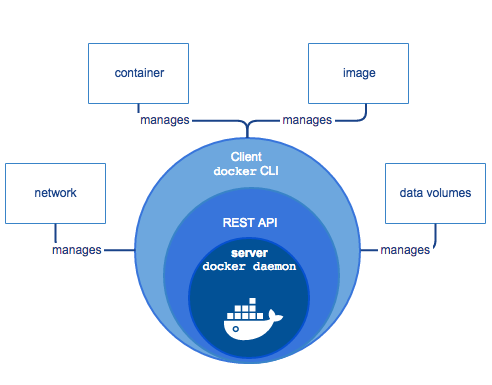
Docker components – picture source docker.com
What is Kubernetes?
Kubernetes, in short, is an open source system for managing clusters of containers. To do this, it provides tools for deploying applications, scaling those application as needed, managing changes to existing containerized applications, and helps you optimize the use of the underlying hardware beneath your containers.
Kubernetes is designed to be extensible and fault-tolerant by allowing application components to restart and move across systems as needed.
Kubernetes is itself not a Platform as a Service (PaaS) tool, but it serves as more of a basic framework, allowing users to choose the types of application frameworks, languages, monitoring and logging tools, and other tools of their choice. In this way, Kubernetes can be used as the basis for a complete PaaS to run on top of; this is the architecture chosen by the OpenShift Origin open source project in its latest release.
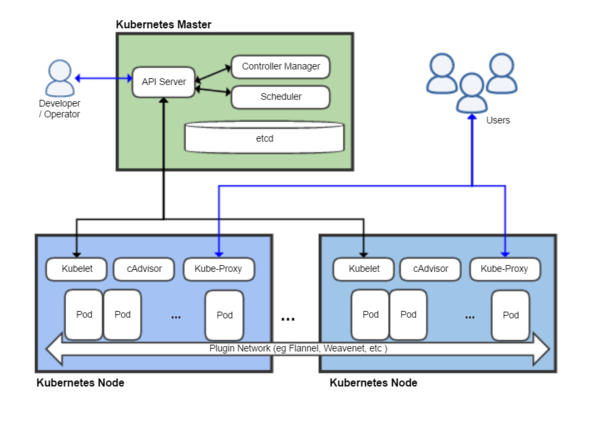
Kubernetes architecture (shortly explained) – picture source Wikipedia
The Kubernetes project is written in the Google developed Go programming language, and you can browse its source code on GitHub.
Hence, In this article I'll give a brief introuduction on what is Docker and show you, how to easily:
a. Build Docker Image with Ubuntu, Update the system and Install Squid inside the container
using a sample Dockerfile build file
b. Run Docker Image to test deployed Ubuntu Linux and Squid on top of it works fine
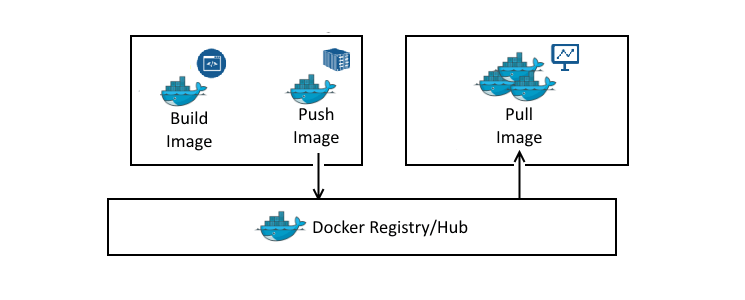
c. Push Docker Image to DockerHub (Docker Images Central Official repository)
d. Deploy (Pull and Run) the new built Docker Ubuntu / Squid Open Proxy Image to the Kubernetes Cluster slave nodes – the K8S Cluster was created using Rancher Enterprise Kubernetes Platform (check out Rancher.net – a bleeding edge tool for k8s quick GUI cluster creation / integration)
1. Install Docker Containerization Software Community Edition
Docker containers are similar to virtual machines, except they run as normal processes (containers), that does not use a Hypervisor of Type 1 or Type 2 and consume less resources than VMs and are easier to manage, nomatter what the OS environment is.
Docker uses cgroups and namespace to allow independent containers to run within a single Linux instance.

Docker Architecture – Picture source docker.com
Below docker install instructions are for Debian / Ubuntu Linux, the instructions for RPM package distros Fedora / CentOS / RHEL are very similar except yum or dnf tool is to be used.
a) Uninstall older versions of docker , docker-engine if present
apt-get -y remove docker docker-engine docker.io
! Previously running docker stuff such as Volumes, Images and networks will be preserved in /var/lib/docker/
b) install prerequired packages and add apt repositories for doko
apt-get update
apt-get install -y apt-transport-https ca-certificates wget software-properties-common
wget https://download.docker.com/linux/debian/gpg
apt-key add gpg
rm -f gpg
Create docker.list apt sources file
echo "deb [arch=amd64] https://download.docker.com/linux/debian $(lsb_release -cs) stable" | sudo tee -a /etc/apt/sources.list.d/docker.list
apt-get update
c) check out the docker policy (will list you a multiple installable versoins of docker).
apt-cache policy docker-ce
docker-ce:
Installed: (none)
Candidate: 17.06.0~ce-0~debian
Version table:
17.06.0~ce-0~debian 500
500 https://download.docker.com/linux/debian stretch/stable amd64 Packages
17.03.2~ce-0~debian-stretch 500
500 https://download.docker.com/linux/debian stretch/stable amd64 Packages
17.03.1~ce-0~debian-stretch 500
500 https://download.docker.com/linux/debian stretch/stable amd64 Packages
17.03.0~ce-0~debian-stretch 500
d) Install and run docker
apt-get -y install docker-ce
systemctl start docker
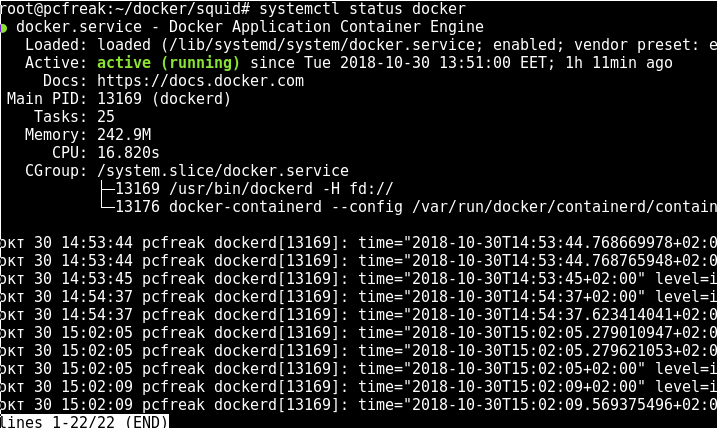
systemctl status docker
Previously running docker stuff such as Volumes, Images and networks will be preserved in /var/lib/docker/
2. Build Docker image with Ubuntu Linux OS and Squid inside
To build a docker image all you need to do is have the Dockerfile (which is docker definitions build file), an Official image of Ubuntu Linux OS (that is provided / downloaded from dockerhub repo) and a bunch of docker commands to use apt / apt-get to install the Squid Proxy inside the Docker Virtual Machine Container
In dockerfile it is common to define for use an entrypoint.sh which is file with shell script commands definitions, that gets executed immediately after Docker fetches the OS from its remote repository on top of the newly run OS. It is pretty much like you have configured your own Linux distribution like using Linux from Scratch! to run on a bare-metal (hardware) server and part of the installation OS process you have made the Linux to run a number of scripts or commands during install not part of its regular installation process.
a) Go to https://hub.docker.com/ and create an account for free
The docker account is necessery in order to push the built docker image later on.
Creating the account creates just few minutes time.
b) Create a Dockerfile with definitions for Squid Open Proxy setup
I'll not get into details on the syntax that Dockerfile accepts, as this is well documented on Docker Enterprise Platform official website but in general gettings the basics and starting it is up to a 30 minutes to maximum 1h time.
After playing a bit to achieve the task to have my Linux distribution OS (Ubuntu Xenial) with Squid on installed on top of it with the right configuration of SQUID Cacher to serve as Open Proxy I've ended up with the following Dockerfile.
FROM ubuntu:xenial
LABEL maintainer="hipo@www.pc-freak.net"
ENV SQUID_VERSION=3.5.12-1ubuntu7 \
SQUID_CACHE_DIR=/var/spool/squid \
SQUID_LOG_DIR=/var/log/squid \
SQUID_USER=proxy
RUN apt-get update \
&& apt-get upgrade && apt-get dist-upgrade && DEBIAN_FRONTEND=noninteractive apt-get install -y squid=${SQUID_VERSION}* \
&& rm -rf /var/lib/apt/lists/*
COPY entrypoint.sh /sbin/entrypoint.sh
COPY squid.conf /etc/squid/squid.conf
RUN chmod 755 /sbin/entrypoint.sh
EXPOSE 3128/tcp
ENTRYPOINT [“/sbin/entrypoint.sh”]
You can download the Dockerfile here.
c) Create entrypoint.sh and squid.conf files
Apart from that I've used the following entrypoint.sh (which creates and sets necessery caching and logging directories and launches script on container set-up) permissions for SQUID proxy file that is loaded from the Dockerfile on docker image build time.
To have the right SQUID configuration shipped up into the newly built docker container, it is necessery to prepare a template configuration file – which is pretty much a standard squid.conf file with the following SQUID Proxy configuration for Open Proxy
acl SSL_ports port 443
acl CONNECT method CONNECT
http_access deny !Safe_ports
http_access deny CONNECT !SSL_ports
http_access allow localhost manager
http_access deny manager
http_access allow localhost
http_access allow all
http_port 3128
coredump_dir /var/spool/squid
refresh_pattern ^ftp: 1440 20% 10080
refresh_pattern ^gopher: 1440 0% 1440
refresh_pattern -i (/cgi-bin/|\?) 0 0% 0
refresh_pattern (Release|Packages(.gz)*)$ 0 20% 2880
refresh_pattern . 0 20% 4320
Once, I've created, the proper Dockerfile configuration, I've made a tiny shell script, that can create / re-create my docker image multiple times.
Here is the build-docker-image.sh :
#!/bin/sh
username='hipod';
password='';
docker login –username="$username" –password=""
DOCKER_ACC=hipod
#DOCKER_REPO=squid-3.5.12-1ubuntu7
DOCKER_REPO=squid-ubuntu
IMG_TAG=latest
docker build -t $DOCKER_ACC/$DOCKER_REPO:$IMG_TAG .
docker push $DOCKER_ACC/$DOCKER_REPO:$IMG_TAG
– You can download build-docker-image.sh script here
The script uses the docker login command to authenticate non-interactively to https://hub.docker.com
docker build command with properly set DOCKER_ACC (docker account – which is the username of your hub.docker.com account as I've pointed earlier in article), then DOCKER_REPO (docker repository name) – you can get it either from a browser, after you've logged in to dockerhub or assuming you know your username, it should look like:
https://hub.docker.com/u/your-username-name – for example mine is hipod with repository name squid-ubuntu, my squid-ubuntu docker image build is here, you'll also need to provide the password inside the script or if you consider it a security concern, instead type manually from command line docker login and authenticate in advance before running the script, finally the last line docker push pushes to remote docker hub the new build of Ubuntu + SQUID Proxy with a predefined TAG that in my case is latest (as this is my latest build of Squid – if you need a multiple version number of Squid repository just change the tag to the version tag line number.
d) Use the script to build Squid docker image
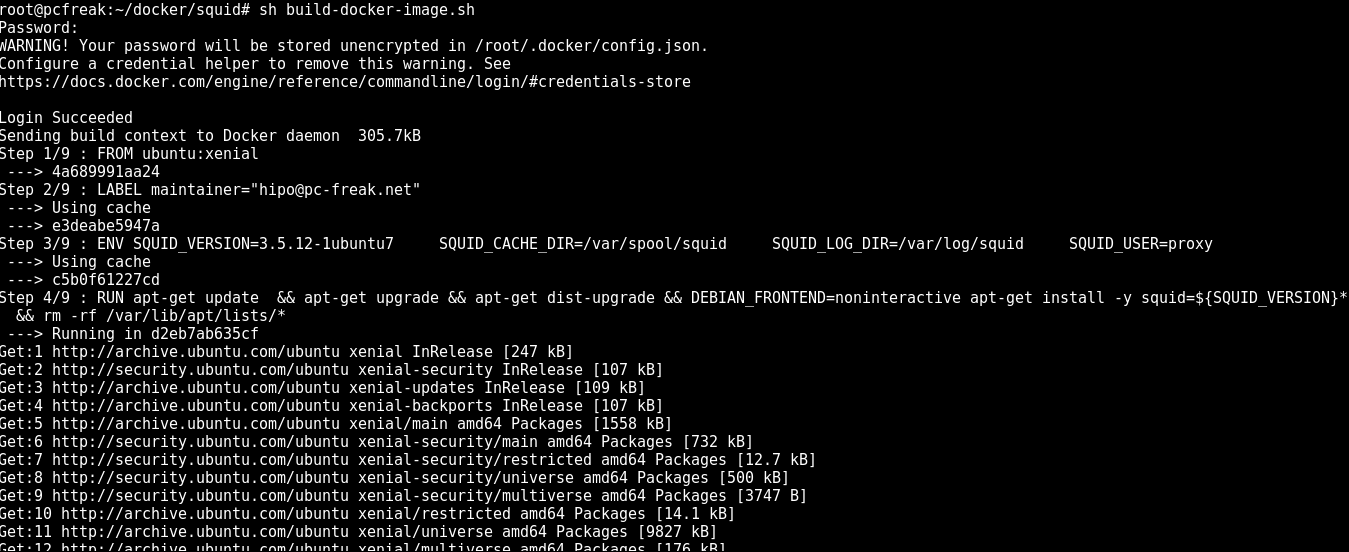
Next run the script to make and push into docker your new image:
sh build-docker-image.sh
Please consider that in order to work with docker hub push / pull, you will need to have a firewall that allows connection to dockerhub site repo, if for some reason the push / pull fails, check closely your firewall as it is the most likely cause for failure.
3. Run the new docker image to test Squid runs as expected
To make sure the docker image runs properly, you can test it on any machine that has docker.io installed, this is done with a simple cmd:
docker run -d –restart=always -p 3128:3128 hipod/squid-ubuntu:latest
The -d option tells docker to background process / run in detached mode
-p option tells docker to expose port (e.g. make NAT with iptables from the docker virtual container with Linux OS + SQUID listening inside the container on port 3128 to the TCP / IP 3128 server port).
You can use iptables to check the created Network Address Translation rules.
–restart=always option sets the docker restart policy (e.g. when the container is terminating it tells the container to restart the container (OS) after exit), there, you can use as a resetart policy (no, on-failure[:max_retries] , unless-stopped)
For clarity I've created one liner script run-squid.sh you can download here.
sh run-squid.sh
You can use a
ps aux|grep -i docker
root 13169 0.2 0.4 591300 77984 ? Ssl 13:50 0:09 /usr/bin/dockerd -H fd://
root 13176 0.0 0.2 408244 34972 ? Ssl 13:50 0:03 docker-containerd –config /var/run/docker/containerd/containerd.toml
root 20875 0.0 0.0 132348 948 pts/1 S+ 14:52 0:00 grep -i docker
to see it running as well as the:
docker ps -a
CONTAINER ID IMAGE COMMAND CREATED STATUS PORTS NAMES
d2eb7ab635cf c5b0f61227cd "/bin/sh -c 'apt-get…" 12 minutes ago Exited (1) 3 minutes ago trusting_elion
18476f546562 c5b0f61227cd "/bin/sh -c 'apt-get…" 37 minutes ago Exited (1) 37 minutes ago admiring_wilson
To connect to the running container later you can use docker attach ID_of_container
docker attach d2eb7ab635cf
command to see the new container runs as well as attach to the newly spawned container
4. Deploying Dockerized SQUID Open Proxy Cache server to Kubernetes cluster
My task was to deploy the newly built squid doko image to remote K8s cluster which was set as a default cluster via a context in .kube/config/ or manually set via:
kubectl config use-context my.k8s-cluster.net
I've used the following YAML file with kubectl to deploy:
—
apiVersion: extensions/v1beta1
kind: Deployment
metadata:
labels:
app: squid-app-33128
name: squid-app-33128
spec:
replicas: 1
template:
metadata:
labels:
app: squid-app-33128
spec:
containers:
– name: squid
image: hipod/squid-ubuntu:latest
imagePullPolicy: Always
ports:
– containerPort: 3128
protocol: TCP
volumeMounts:
– mountPath: /var/spool/squid
name: squid-cache
– mountPath: /var/log/squid
name: squid-log
livenessProbe:
tcpSocket:
port: 3128
initialDelaySeconds: 40
timeoutSeconds: 4
volumes:
– name: squid-cache
emptyDir: {}
– name: squid-log
emptyDir: {}
The task included to deploy two different Open Proxy squid servers on separate ports in order to add them external cluster Ingress load balancing via Amazon AWS, thus I actually used following 2 yaml files.
1. squid-app-33128.yaml
2. squid-app-33129.yaml
The actual deployment command was like that:
# deploys pods and adds services to kubernetes cluster
kubectl create -f squid-app-33129.yaml -f squid-app-33128.yaml -f squid-service-33129.yaml squid-service-33128.yaml
You can download the 2 squid-service .yaml below:
1. squid-service-33129.yaml
2. squid-service-33128.yaml
The service is externally exposed via later configured LoadBalancer to make the 2 squid servers deployed into k8s cluster accessible from the Internet by anyoneone without authorization (as a normal open proxies) via TCP/IP ports 33128 and 33129.
Conclusion
Below I explained a few easy steps to follow to;
– build docker image Ubuntu + Squid
– test the image
– deploy the image into a previously prepared k8s cluster
Though it all looks quite simplistic I should say creating the .yaml file took me long. Creating system configuration is not as simple as using the good old .conf files and getting used with the identation takes time.
Now once the LB are configured to play with k8s, you can enjoy the 2 proxy servers. If you need to do some similar task and you don't have to do it for a small fee, contact me.