To find out which programs are causing the most read/write overhead on a Linux server one can use iotop
Here is the description of iotop – simple top-like I/O monitor, taken from its manpage.
iotop does precisely the same as the classic linux top but for hard disk IN/OUT operations.
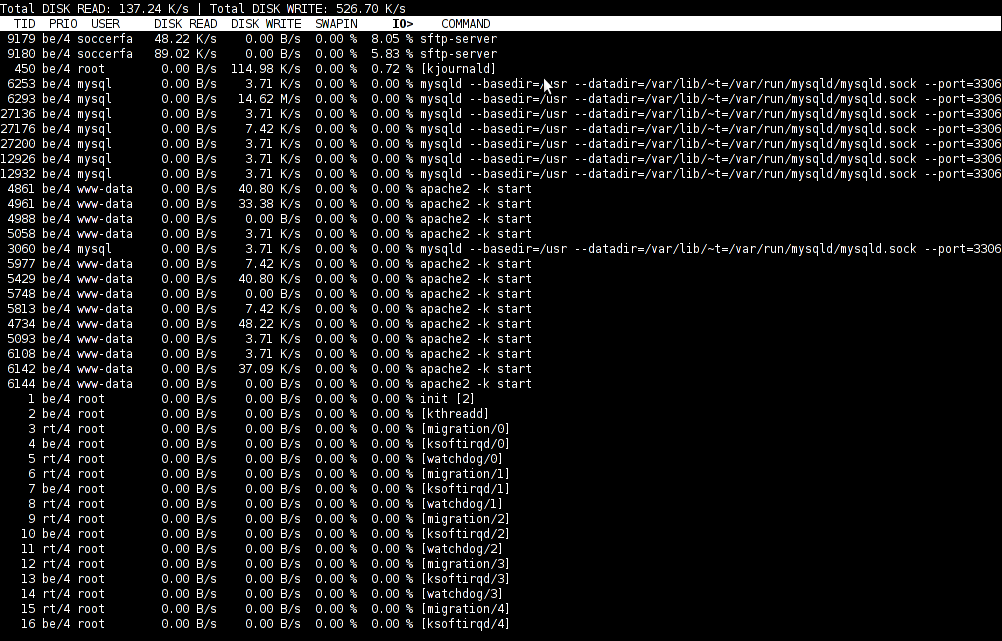
To check the overhead caused by some daemon on the system or some random processes launching iotop without any arguments is enough;
debian:~# iotop
The main overview of iostat statistics, are the:
Total DISK READ: xx.xx MB/s | Total DISK WRITE: xx.xx K/s
If launching iotop, shows a huge numbers and the server is facing performance drop downs, its a symptom for hdd i/o overheads.
iotop is available for Debian and Ubuntu as a standard package part of the distros repositories. On RHEL based Linuxes unfortunately, its not available as RPM.
While talking about keeping an eye on hard disk utilization and disk i/o’s as bottleneck and a possible pitfall to cause a server performance down, it’s worthy to mention about another really great tool, which I use on every single server I administrate. For all those unfamiliar I’m talking about dstat
dstat is a – versatile tool for generating system resource statistics as the description on top of the manual states. dstat is great for people who want to have iostat, vmstat and ifstat in one single program.
dstat is nowdays available on most Linux distributions ready to be installed from the respective distro package manager. I’ve used it and I can confirm tt is installable via a deb/rpm package on Fedora, CentOS, Debian and Ubuntu linuces.
Here is how the tool in action looks like:
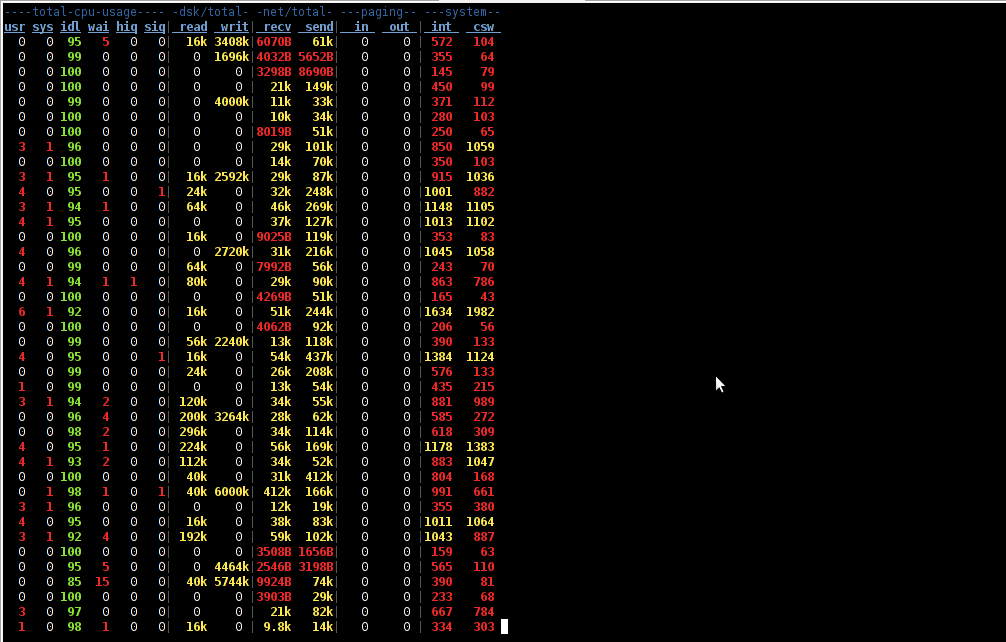
The most interesting things from all the dstat cmd output are read, writ and recv, send , they give a good general overview on hard drive performance and if tracked can reveal if the hdd disk/writes are a bottleneck to create server performance issues.
Another handy tool in tracking hdd i/o problems is iostat its a tool however more suitable for the hard core admins as the tool statistics output is not easily readable.
In case if you need to periodically grasp data about disks read/write operations you will definitely want to look at collectl i/o benchmarking tool .Unfortunately collect is not included as a packaget for most linux distributions except in Fedora. Besides its capabilities to report on servers disk usage, collect is also capable to show brief stats on cpu, network.
Collectl looks really promosing and even seems to be in active development the latest tool release is from May 2011. It even supports NVidia’s GPU monitoring 😉 In short what collectl does is very similar to sysstat which by the way also has some possibilities to track disk reads in time. collectl’s website praises the tool, much and says that in most machines the extra load the tool would add to a system to generate reports on cpu, disk and disk io is < 0.1%. I couldn’t find any data online on how much sysstat (sar) extra loads a system. It will be interesting if some of someone concluded some testing and can tell which of the two puts less load on a system.