Posts Tagged ‘handy tool’

How to find out all programs bandwidth use with (nethogs) top like utility on Linux

Friday, September 30th, 2011

Just run across across a super nice top like, program for system administrators, its called nethogs and is definitely entering my “l337” admin outfit next to tools like iftop, nettop, ettercap, darkstat htop, iotop etc.

nethogs is ultra easy to use, to get immediately in console statistics about running processes UPLOAD and DOWNLOAD bandwidth consumption just run it:

linux:~# nethogs

Nethogs screenshot on Linux Server with Nginx
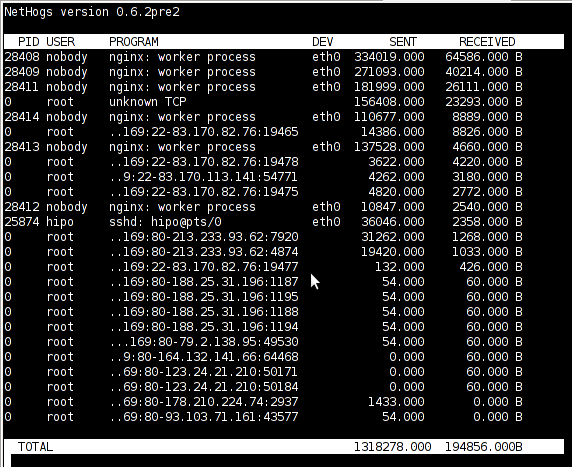
Nethogs running on Debian GNU/Linux serving static web content with Nginx

If you need to check what program is using what amount of network bandwidth, you will definitely love this tool. Having information of bandwidth consumption is also viewable partially with iftop, however iftop is unable to track the bandwidth consumption to each process using the network thus it seems nethogs is unique at what it does.

Nethogs supports IPv4 and IPv6 as well as supports network traffic over ppp. The tool is available via package repositories for Debian GNU/Lenny 5 and Debian Squeeze 6.

To install Nethogs on CentOS and Fedora distributions, you will have to install it from source. On CentOS 5.7, latest nethogs which as of time of writting this article is 0.8.0 compiles and installs fine with make && make install commands.

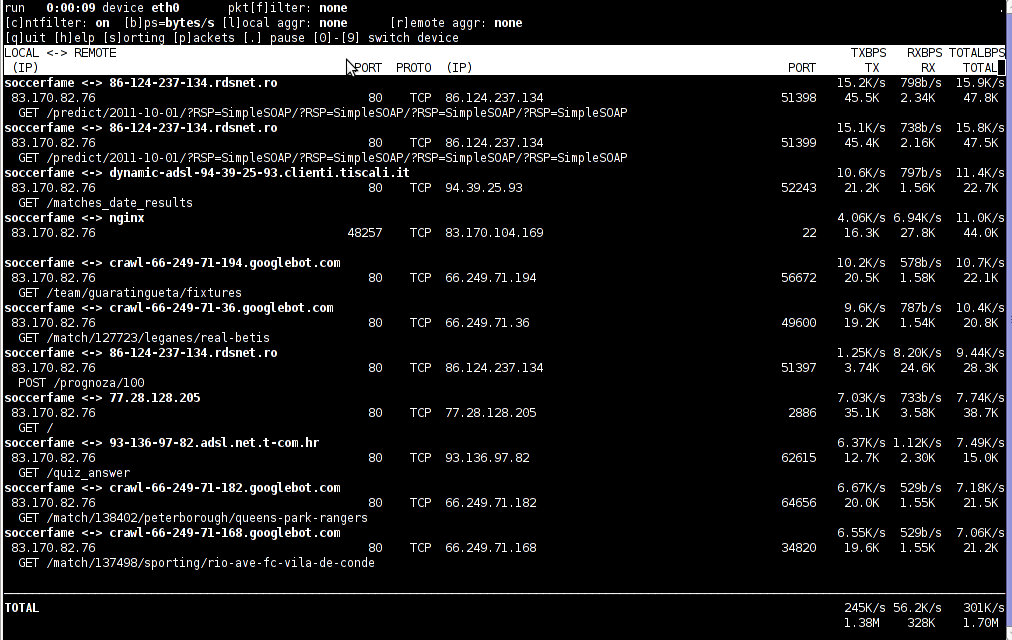
In the manner of thoughts of network bandwidth monitoring, another very handy tool to add extra understanding on what kind of traffic is crossing over a Linux server is jnettop
jnettop shows which hosts/ports is taking up the most network traffic.
It is available for install via apt in Debian 5/6).

Here is a screenshot on jnettop in action:

Jnettop check network traffic in console

To install jnettop on latest Fedoras / CentOS / Slackware Linux it has to be download and compiled from source via jnettop’s official wiki page
I’ve tested jnettop install from source on CentOS release 5.7 and it seems to compile just fine using the usual compile commands:

[root@prizebg jnettop-0.13.0]# ./configure
...
[root@prizebg jnettop-0.13.0]# make
...
[root@prizebg jnettop-0.13.0]# make install

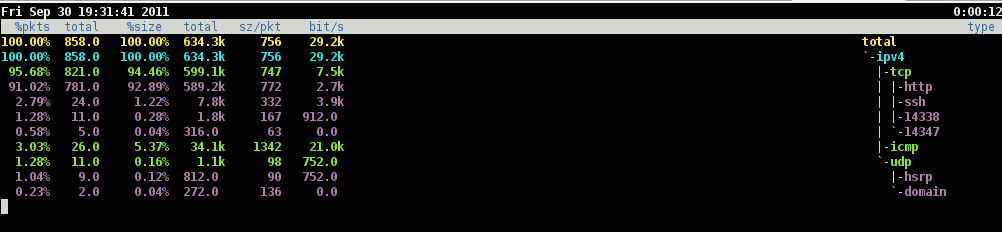
If you need to have an idea on the network traffic passing by your Linux server distringuished by tcp/udp/icmp network protocols and services like ssh / ftp / apache, then you will definitely want to take a look at nettop (if of course not familiar with it yet).
Nettop is not provided as a deb package in Debian and Ubuntu, where it is included as rpm for CentOS and presumably Fedora?
Here is a screenshot on nettop network utility in action:

Nettop server traffic division by protocol screenshot
FreeBSD users should be happy to find out that jnettop and nettop are part of the ports tree and the two can be installed straight, however nethogs would not work on FreeBSD, I searched for a utility capable of what Nethogs can, but couldn’t find such.
It seems the only way on FreeBSD to track bandwidth back and from originating process is using a combination of iftop and sockstat utilities. Probably there are other tools which people use to track network traffic to the processes running on a hos and do general network monitoringt, if anyone knows some good tools, please share with me.

How to find out which processes are causing a hard disk I/O overhead in GNU/Linux

Wednesday, September 28th, 2011

iotop monitor hard disk io bottlenecks linux
To find out which programs are causing the most read/write overhead on a Linux server one can use iotop

Here is the description of iotop – simple top-like I/O monitor, taken from its manpage.

iotop does precisely the same as the classic linux top but for hard disk IN/OUT operations.

To check the overhead caused by some daemon on the system or some random processes launching iotop without any arguments is enough;

debian:~# iotop

The main overview of iostat statistics, are the:

Total DISK READ: xx.xx MB/s | Total DISK WRITE: xx.xx K/s
If launching iotop, shows a huge numbers and the server is facing performance drop downs, its a symptom for hdd i/o overheads.
iotop is available for Debian and Ubuntu as a standard package part of the distros repositories. On RHEL based Linuxes unfortunately, its not available as RPM.

While talking about keeping an eye on hard disk utilization and disk i/o’s as bottleneck and a possible pitfall to cause a server performance down, it’s worthy to mention about another really great tool, which I use on every single server I administrate. For all those unfamiliar I’m talking about dstat

dstat is a – versatile tool for generating system resource statistics as the description on top of the manual states. dstat is great for people who want to have iostat, vmstat and ifstat in one single program.
dstat is nowdays available on most Linux distributions ready to be installed from the respective distro package manager. I’ve used it and I can confirm tt is installable via a deb/rpm package on Fedora, CentOS, Debian and Ubuntu linuces.

Here is how the tool in action looks like:

dstat Linux hdd load stats screenshot

The most interesting things from all the dstat cmd output are read, writ and recv, send , they give a good general overview on hard drive performance and if tracked can reveal if the hdd disk/writes are a bottleneck to create server performance issues.
Another handy tool in tracking hdd i/o problems is iostat its a tool however more suitable for the hard core admins as the tool statistics output is not easily readable.

In case if you need to periodically grasp data about disks read/write operations you will definitely want to look at collectl i/o benchmarking tool .Unfortunately collect is not included as a packaget for most linux distributions except in Fedora. Besides its capabilities to report on servers disk usage, collect is also capable to show brief stats on cpu, network.

Collectl looks really promosing and even seems to be in active development the latest tool release is from May 2011. It even supports NVidia’s GPU monitoring 😉 In short what collectl does is very similar to sysstat which by the way also has some possibilities to track disk reads in time.  collectl’s website praises the tool, much and says that in most machines the extra load the tool would add to a system to generate reports on cpu, disk and disk io is < 0.1%.  I couldn’t find any data online on how much sysstat (sar) extra loads a system. It will be interesting if some of someone concluded some testing and can tell which of the two puts less load on a system.

Runing sudo command simultaneously on multiple servers with SSHSUDO

Tuesday, June 21st, 2011

ssh multiple server command execute
I just was recommended by a friend a nifty tool, which is absoutely nifty for system administrators.

The tool is called sshsudo and the project is hosted on http://code.google.com/p/sshsudo/.

Let’s say you’re responsible for 10 servers with the same operating system let’s say; CentOS 4 and you want to install tcpdump and vnstat on all of them without logging one by one to each of the nodes.

This task is really simple with using sshsudo.
A typical use of sshsudo is:


[root@centos root]# sshsudo -u root \
comp1,comp2,comp3,comp4,comp5,comp6,comp7,comp8,comp9,comp10 yum install tcpdump vnstat

Consequently a password prompt will appear on the screen;
Please enter your password:

If all the servers are configured to have the same administrator root password then just typing one the root password will be enough and the command will get issued on all the servers.

The program can also be used to run a custom admin script by automatically populating the script (upload the script), to all the servers and issuing it next on.

One typical use to run a custom bash shell script on ten servers would be:


[root@centos root]# sshsudo -r -u root \
comp1,comp2,comp3,comp4,comp5,comp6,comp7,comp8,comp9,comp10 /pathtoscript/script.sh

I’m glad I found this handy tool 😉