Posts Tagged ‘cron’
Saturday, July 14th, 2012 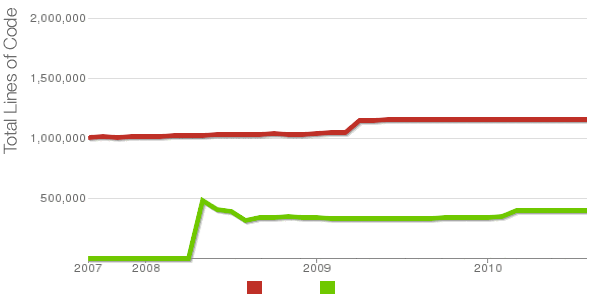
Being able to count the number of PHP source code lines for a website is a major statistical information for timely auditting of projects and evaluating real Project Managment costs. It is inevitable process for any software project evaluation to count the number of source lines programmers has written.
In many small and middle sized software and website development companies, it is the system administrator task to provide information or script quickly something to give info on the exact total number of source lines for projects.
Even for personal use out of curiousity it is useful to know how many lines of PHP source code a wordpress or Joomla website (with the plugins) contains.
Anyone willing to count the number of PHP source code lines under one directory level, could do it with:::
serbver:~# cd /var/www/wordpress-website

server:/var/www/wordpress-website:# wc -l *.php

17 index.php

101 wp-activate.php

1612 wp-app.php

12 wp-atom.php

19 wp-blog-header.php

105 wp-comments-post.php

12 wp-commentsrss2.php

90 wp-config-sample.php

85 wp-config.php

104 wp-cron.php

12 wp-feed.php

58 wp-links-opml.php

59 wp-load.php

694 wp-login.php

236 wp-mail.php

17 wp-pass.php

12 wp-rdf.php

15 wp-register.php

12 wp-rss.php

12 wp-rss2.php

326 wp-settings.php

451 wp-signup.php

110 wp-trackback.php

109 xmlrpc.php

4280 total
This will count and show statistics, for each and every PHP source file within wordpress-website (non-recursively), to get only information about the total number of PHP source code lines within the directory, one could grep it, e.g.:::
server:/var/www/wordpress-website:# wc -l *.php |grep -i '\stotal$'

4280 total
The command grep -i '\stotal$' has \s in beginning and $ at the end of total keyword in order to omit erroneously matching PHP source code file names which contain total in file name; for example total.php …. total_blabla.php …. blabla_total_bla.php etc. etc.
The \s grep regular expression meaning is "put empty space", "$" is placed at the end of tital to indicate to regexp grep only for words ending in string total.
So far, so good … Now it is most common that instead of counting the PHP source code lines for a first directory level to count complete number of PHP, C, Python whatever source code lines recursively – i. e. (a source code of website or projects kept in multiple sub-directories). To count recursively lines of programming code for any existing filesystem directory use find in conjunction with xargs:::
server:/var/www/wp-website1# find . -name '*.php' | xargs wc -l

1079 ./wp-admin/includes/file.php

2105 ./wp-admin/includes/media.php

103 ./wp-admin/includes/list-table.php

1054 ./wp-admin/includes/class-wp-posts-list-table.php

105 ./wp-admin/index.php

109 ./wp-admin/network/user-new.php

100 ./wp-admin/link-manager.php

410 ./wp-admin/widgets.php

108 ./wp-content/plugins/akismet/widget.php

104 ./wp-content/plugins/google-analytics-for-wordpress/wp-gdata/wp-gdata.php

104 ./wp-content/plugins/cyr2lat-slugs/cyr2lat-slugs.php

,,,,

652239 total
As you see the cmd counts and displays the number of source code lines encountered in each and every file, for big directory structures the screen gets floated and passing | less is nice, e.g.:
find . -name '*.php' | xargs wc -l | less
Displaying lines of code for each file within the directories is sometimes unnecessery, whether just a total number of programming source code line is required, hence for scripting purposes it is useful to only get the source lines total num:::
server:/var/www/wp-website1# find . -name '*.php' | xargs wc -l | grep -i '\stotal$'
Another shorter and less CPU intensive one-liner to calculate the lines of codes is:::
server:/var/www/wp-website1# ( find ./ -name '*.php' -print0 | xargs -0 cat ) | wc -l
Here is one other shell script which displays all file names within a directory with the respective calculated lines of code
For more professional and bigger projects using pure Linux bash and command line scripting might not be the best approach. For counting huge number of programming source code and displaying various statistics concerning it, there are two other tools – SLOCCount
as well as clock (count lines of code)
Both tools, are written in Perl, so for IT managers concerned for speed of calculating projects source (if too frequent source audit is necessery) this tools might be a bit sluggish. However for most projects they should be of a great add on value, actually SLOCCount was already used for calculating the development costs of GNU / Linux and other projects of high importance for Free Software community and therefore it is proven it works well with ENORMOUS software source line code calculations written in programming languages of heterogenous origin.
sloccount and cloc packages are available in default Debian and Ubuntu Linux repositories, so if you're a Debilian user like me you're in luck:::
server:~# apt-cache search cloc$

cloc - statistics utility to count lines of code

server:~# apt-cache search sloccount$

sloccount - programs for counting physical source lines of code (SLOC)
Well that's all folks, Cheers en happy counting 😉
Tags: Auto, blabla, code, cron, curiousity, cyr, directory level, Draft, expression, file, file names, header php, index, info, information, level, mail php, middle, number, opml, personal use, php, programmers, project, project evaluation, project managment, quot, rdf, script, show, SLOCCount, software, software project, something, source code, source file, source lines, statistical information, system administrator, totalThe, website server, Wordpress, wp
Posted in Business Management, Programming, System Administration | 2 Comments »
Monday, April 2nd, 2012 I've hit an interesting article explaining how to check unread gmail email messages in Linux terminal. The original article is here
Being able to read your latest gmail emails in terminal/console is great thing, especially for console geeks like me.
Here is the one liner script:
curl -u GMAIL-USERNAME@gmail.com:SECRET-PASSWORD \

--silent "https://mail.google.com/mail/feed/atom" | tr -d '\n' \

| awk -F '' '{for (i=2; i<=NF; i++) {print $i}}' \

| sed -n "s/
Linux Users Group M. – [7] discussions, [10] comments and [2] jobs on LinkedIn

Twitter – Lynn Serafinn (@LynnSerafinn) has sent you a direct message on Twitter!

Facebook – Sys, you have notifications pending

Twitter – Email Marketing (@optinlists) is now following you on Twitter!

Twitter – Lynn Serafinn (@LynnSerafinn) is now following you on Twitter!

NutshellMail – 32 New Messages for Sat 3/31 12:00 PM

Linux Users Group M. – [10] discussions, [5] comments and [8] jobs on LinkedIn

eBay – Deals up to 60% OFF + A Sweepstakes!

LinkedIn Today – Top news today: The Magic of Doing One Thing at a Time

NutshellMail – 29 New Messages for Fri 3/30 12:00 PM

Linux Users Group M. – [16] discussions, [8] comments and [8] jobs on LinkedIn

Ervan Faizal Rizki . – Join my network on LinkedIn

Twitter – LEXO (@LEXOmx) retweeted one of your Tweets!

NutshellMail – 24 New Messages for Thu 3/29 12:00 PM

Facebook – Your Weekly Facebook Page Update

Linux Users Group M. – [11] discussions, [9] comments and [16] jobs on LinkedIn
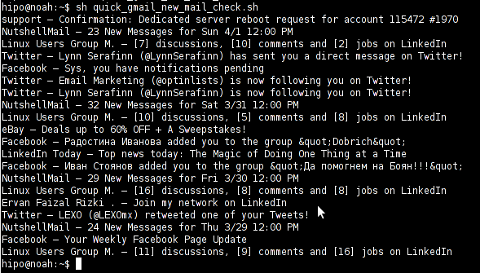
As you see this one liner uses curl to fetch the information from mail.google.com's atom feed and then uses awk and sed to parse the returned content and make it suitable for display.
If you want to use the script every now and then on a Linux server or your Linux desktop you can download the above code in a script file -quick_gmail_new_mail_check.sh here
Here is a screenshot of script's returned output:
A good use of a modified version of the script is in conjunction with a 15 minutes cron job to launch for new gmail mails and launch your favourite desktop mail client.
This method is useful if you don't want a constant hanging Thunderbird or Evolution, pop3 / imap client on your system to just take up memory or dangle down the window list.
I've done a little modification to the script to simply, launch a predefined email reader program, if gmail atom feed returns new unread mails are available, check or download my check_gmail_unread_mail.sh here
Bear in mind, on occasions of errors with incorrect username or password, the script will not return any errors. The script is missing a properer error handling.Therefore, before you use the script make sure:
gmail_username='YOUR-USERNAME';

gmail_password='YOUR-PASSWORD';
are 100% correct.
To launch the script on 15 minutes cronjob, put it somewhere and place a cron in (non-root) user:
# crontab -u root -e

...

*/15 * * * * /path/to/check_gmail_unread_mail.sh
Once you read your new emails in lets say Thunderbird, close it and on the next delivered unread gmail mails, your mail client will pop up by itself again. Once the mail client is closed the script execution will be terminated.
Consised that if you get too frequently gmail emails, using the script might be annoying as every 15 minutes your mail client will be re-opened.
If you use any of the shell scripts, make sure there are well secured (make it owned only by you). The gmail username and pass are in plain text, so someone can steal your password, very easily. For a one user Linux desktops systems as my case, security is not such a big concern, putting my user only readable script permissions (e.g. chmod 0700)is enough.
Tags: article, atom, Auto, awk, client, com, cron, Desktop, download, Draft, ebay, email, email marketing, email messages, facebook, Fri, geeks, Gmail, GMAIL-USERNAME, GNU, gnu linux, google, Group, https mail, liner, LinkedIn, Linux, linux server, linux users group, mail, marketing, news today, OFF, original article, password, quot, rizki, sat 3, script, SECRET-PASSWORD, terminal, thing, top news, twitter, username, Users, Weekly
Posted in Linux, System Administration, Various | 2 Comments »
Monday, March 19th, 2012 
One of the company Debian Lenny 5.0 Webservers, where I'm working as sys admin sometimes stops to properly server HTTP requests.
Whenever this oddity happens, the Apache server seems to be running okay but it is not failing to return requested content
I can see the webserver listens on port 80 and establishing connections to remote hosts – the apache processes show normally as I can see in netstat …:
apache:~# netstat -enp 80

Active Internet connections (w/o servers)

Proto Recv-Q Send-Q Local Address Foreign Address State User Inode PID/Program name

tcp 0 0 xxx.xxx.xxx.xx:80 46.253.9.36:5665 SYN_RECV 0 0 -

tcp 0 0 xxx.xxx.xxx.xx:80 78.157.26.24:5933 SYN_RECV 0 0 -

...
Also the apache forked child processes show normally in process list:
apache:~# ps axuwwf|grep -i apache

root 46748 0.0 0.0 112300 872 pts/1 S+ 18:07 0:00 \_ grep -i apache

root 42530 0.0 0.1 217392 6636 ? Ss Mar14 0:39 /usr/sbin/apache2 -k start

www-data 42535 0.0 0.0 147876 1488 ? S Mar14 0:01 \_ /usr/sbin/apache2 -k start

root 28747 0.0 0.1 218180 4792 ? Sl Mar14 0:00 \_ /usr/sbin/apache2 -k start

www-data 31787 0.0 0.1 219156 5832 ? S Mar14 0:00 | \_ /usr/sbin/apache2 -k start
In spite of that, in any client browser to any of the Apache (Virtual hosts) websites, there is no HTML content returned…
This weird problem continues until the Apache webserver is retarted.
Once webserver is restarted everything is back to normal.
I use Apache Check Apache shell script set on few remote hosts to regularly check with nmap if port 80 (www) of my server is open and responding, anyways this script just checks if the open and reachable and thus using it was unable to detect Apache wasn't able to return back HTML content.
To work around the malfunctions I wrote tiny script – retart_apache_if_empty_content_is_returned.sh
The scripts idea is very simple;
A request is made a remote defined host with lynx text browser, then the output of lines is counted, if the output returned by lynx -dump http://someurl.com is less than the number returned whether normally invoked, then the script triggers an apache init script restart.
I've set the script to periodically run in a cron job, every 5 minutes each hour.
# check if apache returns empty content with lynx and if yes restart and log it

*/5 * * * * /usr/sbin/restart_apache_if_empty_content.sh >/dev/null 2>&1
This is not perfect as sometimes still, there will be few minutes downtime, but at least the downside will not be few hours until I am informed ssh to the server and restart Apache manually …
A quick way to download and set from cron execution my script every 5 minutes use:
apache:~# cd /usr/sbin

apache:/usr/sbin# wget -q https://www.pc-freak.net/bscscr/restart_apache_if_empty_content.sh

apache:/usr/sbin# chmod +x restart_apache_if_empty_content.sh

apache:/usr/sbin# crontab -l > /tmp/file; echo '*/5 * * * *' /usr/sbin/restart_apache_if_empty_content.sh 2>&1 >/dev/null
Tags: address state, apache processes, apache server, apache webserver, apache2, apacheroot, Auto, checks, child processes, client, client browser, content, cron, Draft, enp, everything, grep, HTML, HTTP, internet connections, lenny, Lynx, nmap, oddity, program, proto, Restart, restart apache, root, script, scripts, Shell, shell script, show, spite, ss, SYN, User, Virtual, virtual hosts, webservers, weird problem
Posted in System Administration, Web and CMS | 7 Comments »
Monday, March 12th, 2012 
One of the WordPress websites hosted on our dedicated server produces all the time a wp-cron.php 404 error messages like:
xxx.xxx.xxx.xxx - - [15/Apr/2010:06:32:12 -0600] "POST /wp-cron.php?doing_wp_cron HTTP/1.0
I did not know until recently, whatwp-cron.php does, so I checked in google and red a bit. Many of the places, I've red are aa bit unclear and doesn't give good exlanation on what exactly wp-cron.php does. I wrote this post in hope it will shed some more light on wp-config.php and how this major 404 issue is solved..
So
what is wp-cron.php doing?
- wp-cron.php is acting like a cron scheduler for WordPress.
- wp-cron.php is a wp file that controls routine actions for particular WordPress install.
- Updates the data in SQL database on every, request, every day or every hour etc. – (depending on how it's set up.).
- wp-cron.php executes automatically by default after EVERY PAGE LOAD!
- Checks all pending comments for spam with Akismet (if akismet or anti-spam plugin alike is installed)
- Sends all scheduled emails (e.g. sent a commentor email when someone comments on his comment functionality, sent newsletter subscribed persons emails etc.)
- Post online scheduled articles for a day and time of particular day
Suppose you're writting a new post and you want to take advantage of WordPress functionality to schedule a post to appear Online at specific time:
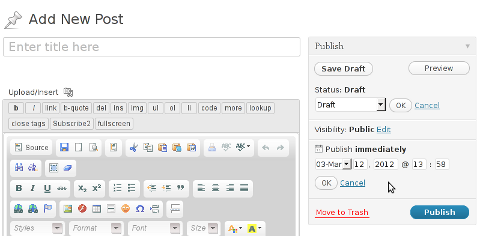
The Publish Immediately, field execution is being issued on the scheduled time thanks to the wp-cron.php periodic invocation.
Another example for wp-cron.php operation is in handling flushing of WP old HTML Caches generated by some wordpress caching plugin like W3 Total Cache
wp-cron.php takes care for dozens of other stuff silently in the background. That's why many wordpress plugins are depending heavily on wp-cron.php proper periodic execution. Therefore if something is wrong with wp-config.php, this makes wordpress based blog or website partially working or not working at all.
Our company wp-cron.php errors case
In our case the:
212.235.185.131 – – [15/Apr/2010:06:32:12 -0600] "POST /wp-cron.php?doing_wp_cron HTTP/1.0" 404
is occuring in Apache access.log (after each unique vistor request to wordpress!.), this is cause wp-cron.php is invoked on each new site visitor site request.
This puts a "vain load" on the Apache Server, attempting constatly to invoke the script … always returning not found 404 err.
As a consequence, the WP website experiences "weird" problems all the time. An illustration of a problem caused by the impoper wp-cron.php execution is when we are adding new plugins to WP.
Lets say a new wordpress extension is download, installed and enabled in order to add new useful functioanlity to the site.
Most of the time this new plugin would be malfunctioning if for example it is prepared to add some kind of new html form or change something on some or all the wordpress HTML generated pages.
This troubles are result of wp-config.php's inability to update settings in wp SQL database, after each new user request to our site.
So the newly added plugin website functionality is not showing up at all, until WP cache directory is manually deleted with rm -rf /var/www/blog/wp-content/cache/…
I don't know how thi whole wp-config.php mess occured, however my guess is whoever installed this wordpress has messed something in the install procedure.
Anyways, as I researched thoroughfully, I red many people complaining of having experienced same wp-config.php 404 errs. As I red, most of the people troubles were caused by their shared hosting prohibiting the wp-cron.php execution.
It appears many shared hostings providers choose, to disable the wordpress default wp-cron.php execution. The reason is probably the script puts heavy load on shared hosting servers and makes troubles with server overloads.
Anyhow, since our company server is adedicated server I can tell for sure in our case wordpress had no restrictions for how and when wp-cron.php is invoked.
I've seen also some posts online claiming, the wp-cron.php issues are caused of improper localhost records in /etc/hosts, after a thorough examination I did not found any hosts problems:
hipo@debian:~$ grep -i 127.0.0.1 /etc/hosts

127.0.0.1 localhost.localdomain localhost
You see from below paste, our server, /etc/hosts has perfectly correct 127.0.0.1 records.
Changing default way wp-cron.php is executed
As I've learned it is generally a good idea for WordPress based websites which contain tens of thousands of visitors, to alter the default way wp-cron.php is handled. Doing so will achieve some efficiency and improve server hardware utilization.
Invoking the script, after each visitor request can put a heavy "useless" burden on the server CPU. In most wordpress based websites, the script did not need to make frequent changes in the DB, as new comments in posts did not happen often. In most wordpress installs out there, big changes in the wordpress are not common.
Therefore, a good frequency to exec wp-cron.php, for wordpress blogs getting only a couple of user comments per hour is, half an hour cron routine.
To disable automatic invocation of wp-cron.php, after each visitor request open /var/www/blog/wp-config.php and nearby the line 30 or 40, put:
define('DISABLE_WP_CRON', true);
An important note to make here is that it makes sense the position in wp-config.php, where define('DISABLE_WP_CRON', true); is placed. If for instance you put it at the end of file or near the end of the file, this setting will not take affect.
With that said be sure to put the variable define, somewhere along the file initial defines or it will not work.
Next, with Apache non-root privileged user lets say www-data, httpd, www depending on the Linux distribution or BSD Unix type add a php CLI line to invoke wp-cron.php every half an hour:
linux:~# crontab -u www-data -e
0,30 * * * * cd /var/www/blog; /usr/bin/php /var/www/blog/wp-cron.php 2>&1 >/dev/null
To assure, the php CLI (Command Language Interface) interpreter is capable of properly interpreting the wp-cron.php, check wp-cron.php for syntax errors with cmd:
linux:~# php -l /var/www/blog/wp-cron.php

No syntax errors detected in /var/www/blog/wp-cron.php
That's all, 404 wp-cron.php error messages will not appear anymore in access.log! 🙂
Just for those who can find the root of the /wp-cron.php?doing_wp_cron HTTP/1.0" 404 and fix the issue in some other way (I'll be glad to know how?), there is also another external way to invoke wp-cron.php with a request directly to the webserver with short cron invocation via wget or lynx text browser.
– Here is how to call wp-cron.php every half an hour with lynxPut inside any non-privileged user, something like:
01,30 * * * * /usr/bin/lynx -dump "http://www.your-domain-url.com/wp-cron.php?doing_wp_cron" 2>&1 >/dev/null
– Call wp-cron.php every 30 mins with wget:
01,30 * * * * /usr/bin/wget -q "http://www.your-domain-url.com/wp-cron.php?doing_wp_cron"
Invoke the wp-cron.php less frequently, saves the server from processing the wp-cron.php thousands of useless times.
Altering the way wp-cron.php works should be seen immediately as the reduced server load should drop a bit.
Consider you might need to play with the script exec frequency until you get, best fit cron timing. For my company case there are only up to 3 new article posted a week, hence too high frequence of wp-cron.php invocations is useless.
With blog where new posts occur once a day a script schedule frequency of 6 up to 12 hours should be ok.
Tags: akismet, Auto, caches, checks, commentor, cr, cron, daySuppose, dedicated server, doesn, dozens, Draft, email, error messages, execution, exlanation, file, google, HTML, HTTP, invocation, localhost, nbsp, newsletter, operation, periodic execution, php, plugin, quot, request, scheduler, someone, something, spam, SQL, time, time thanks, Wordpress, wordpress plugins, wp
Posted in System Administration, Web and CMS, Wordpress | 3 Comments »
Monday, January 9th, 2012 I've recently had to set up a backup system to synchronize backup archive files between two remote servers and as I do usually with this situation I just set up a crontab job to periodically execute rsync to copy data from source server to the destination server . Copying SRC to DEST is the default behaviour rsync uses, however in this case I had to copy from the destination server to the source server host (in other words sync files the reversely.
The usual way to copy with rsync via SSH (from SRC to DEST) is using a cmd line like:
debian:~$ /usr/bin/rsync -avz -e ssh backup-user@xxx.xxx.xxx.xxx:/home/backup-user/my-directory .
Where the xxx.xxx.xxx.xxx is my remote server IP with which files are synched.
According to rsync manual, the proposed docs SYNOPSIS is in the format;
Local: rsync [OPTION…] SRC… [DEST
Obviusly the default way to use rsync is to copy source to destination which I used until now, but in this case I had to the other way around and copy files from a destination host to the source server. It was logical that swapping the SRC and DEST would complete my required task. Anyways I consulted with some rsync gurus in irc.freenode.net , just to make sure it is proper to just swap the SRC, DEST arguments.
I was told this is possible, so I swapped args;
debian:~$ /usr/bin/rsync -avz -e ssh . backup-user@xxx.xxx.xxx.xxx:/home/backup-user/my-directory

...
Surprisingly this worked 😉 Anyways I was adviced by by a good guy nick named scheel , that putting -e ssh to command line is generally unnecessery except if there is no some uncommon used SSH port over which the data is transferred. An example case in which -e 'ssh is necessery would be if transferring via lets say SSH port 1234;
rsync -avz -e 'ssh -p1234' /source user@host:/dest
In all other cases omitting '-e ssh' is better as '-e ssh' is rsync default. Therefore my final swapped line I put in cron to copy from a destinatio to source host with rsync looked like so:
05 03 2 * * /usr/bin/ionice -c 3 /usr/bin/rsync -avz my-directory backup-user@xxx.xxx.xxx.xxx:/home/backup-user/ >/dev/null 2>&1
Tags: archive files, Auto, avz, backup system, case, cmd, cmd line, copy, copying, cron, default, default behaviour, destIn, destinatio, destination, destination host, destination server, docs, Draft, example, example case, few words, format, gurus, host, job, nbsp, necessery, nick, option, port 1234, remote server, rsync, scheel, server host, server ip, source host, source server, ssh port, sync files, system, usr bin
Posted in FreeBSD, Linux, System Administration | No Comments »
Thursday, November 24th, 2011 
As a System Administrator I need to check daily the log files produced on various GNU / Linux distributions or FreeBSD. This can sometimes take too much time if the old fashioned way using the normal system tools cat, less and tail etc. is used.
Reading logs one by one eats too much of my time and often as logs are reviewed in a hurry some crucial system irregularities, failed ssh or POP3 / Imap logins, filling disk spaces etc. are missed.
Therefore I decided to implement automated log parsing programs which will summary and give me an overview (helicopter view) on what were the system activities from the previous day (24h) until the moment I logged the system and issued the log analyzer program.
There are plenty of programs available out there that does “wide scale” log analysis, however there are two applications which on most GNU / Linux and BSD systems had become a de-facto standard programs to scan system log files for interesting lines.
These are:
- 1. logwatch – system log analyzer and reporter
- 2. logcheck – program to scan system log files for interesting lines
1. logwatch is by default installed on most of the Redhat based Linux systems (Fedora, RHEL, CentOS etc.). On Debian distributions and as far as I know (Ubuntu) and the other deb based distros logwatch is not installed by default. Most of the servers I manage these days are running Debian GNU / Linux so, to use logwatch I needed to install it from the available repository package, e.g.:
debian:~# apt-get install logwatch

...
logwatch is written in perl and with some big files to analyze, parsing them might take hell a lot of time. It does use a bunch of configuration scripts which defines how logwatch should read and parse the various services logwatch support by default. These conf scripts are also easily extensible, so if one has to analyze some undefined service in the conf files he can easily come up with a new conf script that will support the service/daemon of choice.Using logwatch is very easy, to get an overview about server system activity invoke the logwatch command:
debian:~# logwatch

################### Logwatch 7.3.6+cvs20080702-debian (07/02/08) ####################

Processing Initiated: Thu Nov 24 05:22:07 2011

Date Range Processed: yesterday

( 2011-Nov-23 )

Period is day.

Detail Level of Output: 0

Type of Output/Format: stdout / text

Logfiles for Host: debian

 #################################################
——————— dpkg status changes Begin ————-
Upgraded:
libfreetype6 2.3.7-2+lenny7 => 2.3.7-2+lenny8
libfreetype6-dev 2.3.7-2+lenny7 => 2.3.7-2+lenny8
———————- dpkg status changes End ————————-
——————— httpd Begin ————————
Requests with error response codes
400 Bad Request
HTTP/1.1: 2 Time(s)
admin/scripts/setup.php: 2 Time(s)
401 Unauthorized
…
…
———————- vpopmail End ————————-
——————— Disk Space Begin ————————
Filesystem Size Used Avail Use% Mounted on
/dev/md0 222G 58G 154G 28% /
———————- Disk Space End ————————-
###################### Logwatch End #########################
The execution might take up from 10 to 20 seconds up to 10 or 20 minutes depending on the log files size and the CPU / RAM hardware on the machine where /var/log/… logs will be analyzed.
logwatch output can be easily mailed to a custom mail address using a crontab if the server runs a properly configured SMTP server. Using a cron like:
00 5 * * * /usr/sbin/logwatch | mail -s "$(hostname) log files for $(date)"
Here is time to make a note that logwatch is ported also to FreeBSD and is available from BSD’s port tree, from a port with path:
/usr/ports/security/logcheck
2. logcheck is another handy program, which does very similar job to logwatch . The “interesting” information it returns is a bit less than compared to logwatch
The good thing about logcheck is that by default it is made to mail every 1 hour a brief data summary which might be of an interest to the sys admin.
Logcheck is available for install on RedHat distros via yum and has existing package for Debian as well as a port for FreeBSD under the port location /usr/ports/security/logcheck
To install on logcheck on Debian:
debian:~# apt-get install logcheck

...
After installation I found it wise to change the default mailing time from each and every hour to just once per day to prevent my email from overfilling with “useless” mails.
This is done by editting the default cron tab installed by the package located in /etc/cron.d/logcheck
The default file looks like so:
# /etc/cron.d/logcheck: crontab entries for the logcheck package

PATH=/usr/local/sbin:/usr/local/bin:/sbin:/bin:/usr/sbin:/usr/bin

MAILTO=root

@reboot logcheck if [ -x /usr/sbin/logcheck ]; then nice -n10 /usr/sbin/logcheck -R; fi

2 * * * * logcheck if [ -x /usr/sbin/logcheck ]; then nice -n10 /usr/sbin/logcheck; fi

# EOF
To change it run only once per day its content should looks something like:
# /etc/cron.d/logcheck: crontab entries for the logcheck package

PATH=/usr/local/sbin:/usr/local/bin:/sbin:/bin:/usr/sbin:/usr/bin

MAILTO=root

@reboot logcheck if [ -x /usr/sbin/logcheck ]; then nice -n10 /usr/sbin/logcheck -R; fi

2 5 * * * logcheck if [ -x /usr/sbin/logcheck ]; then nice -n10 /usr/sbin/logcheck; fi

# EOF
Altering it that way the log summary interesting info analysis will be sent on mail every day in 05:02 a.m.
Changing the default email logcheck will ship its log analyzer report emails on deb based distros is done via editting the file:
/etc/logcheck/logcheck.conf
And changing the SENDMAILTO=”” variable to point to the appropriate admin email email addr.
Tags: Begin, bsd systems, CentOS, configuration scripts, cron, Date, deb, debian distributions, debian gnu, Disk, dpkg, end, fedora, freebsd, gnu linux, helicopter view, hurry, imap, irregularities, libfreetype, linux distributions, linux systems, logcheck, logwatch, nbsp, Output, package, quot, reading, reading log files, reading logs, reporter, repository, Space, ssh, summary, system administrator, system tools, time, Ubuntu
Posted in FreeBSD, Linux, System Administration, Various | 1 Comment »
Tuesday, November 22nd, 2011 In order to debug some PHP session problems on Debian, I needed to check the count of existing session files.
When PHP is compiled from source usually, by default sessions are stored in /tmp directory, however this is not the case on Debian.
Debian’s PHP session directory is different, there the sessions are stored in the directory:
/var/lib/php5
I’ve discovered the session directory location by reading Debian’s cron shell script, which delete session files on every 30 minutes.
Here is the file content:
debian~# cat /etc/cron.d/php5

# /etc/cron.d/php5: crontab fragment for php5

# This purges session files older than X, where X is defined in seconds

# as the largest value of session.gc_maxlifetime from all your php.ini

# files, or 24 minutes if not defined. See /usr/lib/php5/maxlifetime
# Look for and purge old sessions every 30 minutes
09,39 * * * * root [ -x /usr/lib/php5/maxlifetime ] &&
[ -d /var/lib/php5 ] && find /var/lib/php5/ -type f -cmin +$(/usr/lib/php5/maxlifetime) -delete
To check the amount of existing PHP opened session files:
debian:~# ls -1 /var/lib/php5|wc -l

14049
Tags: amount, amp, apache, cat, check, count, cron, crontab, Debian, debian gnu, DEBUG, directory location, file, fragment, gnu linux, ini files, lib, Linux, linux apache, location, maxlifetime, order, php session, purges, root, session directory, session files, sessions, Shell, shell script, tmp, type, usr, value, var
Posted in Linux, System Administration, Various | No Comments »
Monday, November 21st, 2011 
After installing vnstat to keep an eye on server IN and OUT traffic on a Debian Squeeze server. I used the usual:
debian:~# vnstat -u -i eth0
In order to generate the initial database for the ethernet interface used by vnstat to generate its statistics.
However even though /var/lib/vnstat/eth0 got generated with above command statistics were not further generated and trying to check them with command:
debian:~# vnstat --days
Returned the error message:
eth0: Not enough data available yet.
To solve the eth0: Not enough data available yet. message I tried completely removing vnstat package by purging the package e.g.:
debian:~# apt-get --yes remove vnstat

...

debian:~# dpkg --purge vnstat

...
Even though dpkg –purge was invoked /var/lib/vnstat/ refused to be removed since it contained vnstat’s db file eth0
Therefore I deleted by hand before installing again vnstat:
debian:~# rm -rf /var/lib/vnstat/
Tried installing once again vnstat “from scratch”:
debian:~# apt-get install vnstat

...
After that I tried regenerating the vnstat db file eth0 once again with vnstat -u -i eth0 , hoping this should fix the error but it was no go and after that the error:
debian:~# vnstat --hours

eth0: Not enough data available yet.
persisted.
I checked in Debian bugs mailing lists and I found, some people complaining about the same issue with some suggsetions on how the error can be work arouned, anyways none of the suggestions worked for me.
Being irritated I further removed / purged once again vnstat and decided to give it a try by installing vnstat from source
As of time of writting this article, the latest stable vnstat version is 1.11 .
Therefore to install vnstat from source I issued:
debian:~# cd /usr/local/src

debian:/usr/local/src# wget http://humdi.net/vnstat/vnstat-1.11.tar.gz

...

debian:/usr/local/src# tar -zxvvf vnstat-1.11.tar.gz

debian:/usr/local/src# cd vnstat-1.11

debian:/usr/local/src/vnstat-1.11# make & make all & make install

debian:/usr/local/src/vnstat-1.11# cp examples/vnstat.cron /etc/cron.d/vnstat

debian:/usr/local/src/vnstat-1.11# vnstat -u -i eth0

Error: Unable to read database "/var/lib/vnstat/eth0".

Info: -> A new database has been created.
As a last step I put on root crontab to execute:
debian:~# crontab -u root -e
*/5 * * * * /usr/bin/vnstat -u >/dev/null 2>&1
This line updated vnstat db eth0 database, every 5 minutes. After the manual source install vnstat works, just fine 😉
Tags: amp, bin, bugs, cron, debian gnu, dpkg, error message, eth, ethernet interface, eye, file, GNU, gnu linux, hourseth, initial database, installdebian, lib, Linux, none, package, quot, Returned, rf, root, scratch, squeeze, statistics, tar, tar gz, time, traffic, vnstatdebian, wget, work, zxvvf
Posted in Linux, System Administration, Various | 6 Comments »
Monday, April 19th, 2010 1. First it’s necessery to have the mrtg debian package installed.
If it’s not installed then we have to install it:
debian-server:~# apt-get install mrtg
2. Second download the qmailmrtg source binary
To download the latest current source release of qmailmrtg execute:
debian-server:~# wget http://www.inter7.com/qmailmrtg7/qmailmrtg7-4.2.tar.gz
It’s a pity qmailmrtg is not available for download via debian repositories.
3. Third download the qmail.mrtg.cfg configuration file
debian-server~# wget https://www.pc-freak.net/files/qmail.mrtg.cfg
Now you have to put the file somewhere, usually it’s best to put it in the /etc/ directory.
Make sure the file is existing in /etc/qmail.mrtg.cfg
4. Untar compile and install qmailmrtg binary
debian-server:~# tar -xzvvf qmailmrtg7-4.2.tar.gz

...

debian-server:~# make && make install
strip qmailmrtg7
cp qmailmrtg7 /usr/local/bin
rm -rf *.o qmailmrtg7 checkq core
cc checkq.c -o checkq
./checkq
cc -s -O qmailmrtg7.c -o qmailmrtg7
qmailmrtg7.c: In function ‘main’:
qmailmrtg7.c:69: warning: incompatible implicit declaration of
built-in function ‘exit’
qmailmrtg7.c:93: warning: incompatible implicit declaration of
built-in function ‘exit’
qmailmrtg7.c:131: warning: incompatible implicit declaration of
built-in function ‘exit’
qmailmrtg7.c:137: warning: incompatible implicit declaration of
built-in function ‘exit’
5. Set proper file permissions according to the user you indent to execute qmailmrtg as
I personally execute it as root user, if you intend to do so as well set a permissions to
/etc/qmail.mrtg.cfg of 700.
In order to do that issue the command:
debian-server:~# chmod 700 /etc/qmail.mrtg.cfg
6. You will now need to modify the qmail.mrtg.cfg according to your needs
There you have to set a proper location where the qmailmrtg shall generate it’s html data files.
I use the /var/www/qmailmrtg qmailmrtg log file location. If you will do so as wellyou have to create the directory.
7. Create qmailmrtg html log files directory
debian-server:~# mkdir /var/log/qmailmrtg
8. Now all left is to set a proper cron line to periodically invoke qmailmrtg in order to generate qmail activity statistics.
Before we add the desired root’s crontab instructions we have to open the crontab for edit, using the command.
debian-server:~# crontab -u root -e
I personally use and recommend the following line as a line to be added to root’s crontab.
0-55/5 * * * * env LANG=C /usr/bin/mrtg /etc/qmail.mrtg.cfg > /dev/null
9. Copy index.html from qmailmrtg source directory to /var/log/qmailmrtg
debian-server:/usr/local/src/qmailmrtg7-4.2# cp -rpf index.html /var/log/qmailmrtg
10. Last step is to make sure Apache’s configuration contains lines that will enable you to access the qmail activity statistics.
The quickest way to do that in Debian running Apache 2.2 is to edit /etc/apache2/apache2.conf and add a directory Alias as follows
Alias /qmailmrtg/ "/var/www/qmailmrtg/"
Now after Apache restart
/etc/init.d/apache2 restart
You should be now able to access the qmail mrtg qmail log statistics through your Apache’s default configured host.
For instance, assuming your default configured Apache host is domain.com. You’ll be able to reach the qmailmrtg statistics through an url like:
http://domain.com/qmailmrtg/
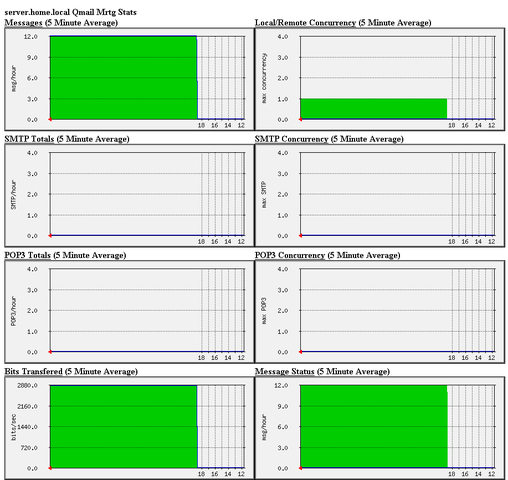
After I verified and ensured myself qmail mrtg is working correctly after all the above explained steps partook I wasn’t happy with some headlines in the index.html and the html tile of qmailmrtg,
so as a last step I manually edited the /var/www/qmailmrtg/index.html to attune it to my likings.
Here is a screenshot of the qmailmrtg web statistics in action.
Tags: amp, checkq, configuration file, cron, current source, debian package, debian repositories, declaration, default, download, exit, file, file permissions, freak, function, graph, host, html data, implicit declaration, indent, index, Installing qmailmrtg (qmail graph statistics on qmail activity) on Debian Lenny, loc, location, log, mrtg, necessery, package, proper location, rf, root, root user, Set, source release, statistics, strip, untar, wget
Posted in System Administration | 6 Comments »
Saturday, July 16th, 2011 
It was necessery to clean up some squid cache for some proxy users on a Debian host. Until now I’ve used to run only custom build Squid server on Slackware Linux.
Thus I was curious if Debian guys were smart enough to implement a proxy cache cleaning option as an option to be passed on to squid’s init script.
Honestly I was quite suprised squid clear cache option is not there;
squid-cache:~# /etc/init.d/squid3

Usage: /etc/init.d/squid3 {start|stop|reload|force-reload|restart}

squid-cache:/#
As it was not embedded into init script I still hoped, there might be some Debian way to do the proxy cache clearing, so I spend some 10 minutes checking online as well as checked in squid3‘s manual just to find there is no specific command or Debian accepted way to clean squid’s cache.
Since I couldn’t find any Debian specific, way I did it the old fashioned way 😉 (deleted directory/file structures in /var/spool/squid3/* and used squid’s -z option, to recreate the swap directories.
Here is how:
squid-cache:~# /etc/init.d/squid3 stop;

squid-cache:~# rm -Rf /var/spool/squid3/*;

squid-cache:~# squid3 -z; /etc/init.d/squid3 start
Finally I was quite amazed to realize, there was not even a crontab script to periodically clear and re-create proxy cache.
My previous experience with maintaning an office Squid proxy cache has prooved, that periodic cache clean ups are very helpful, especially to resolve issues with cached unreslovable DNS entries in the server.
Clearing up squid cache every week or something, guarantees that failure to resolve certain hosts at certain times would not stay unresolvable like forever 😉
In that manner of thougths, I decided to put the following crontab which will twice a month clear up proxy’s cache, to possibly solve some failed squid DNS issues.
squid-cache:~# crontab -u root -l > file;

echo '00 04 12,26 * * /etc/init.d/squid3 stop; rm -Rf /var/spool/squid3/*; squid3 -z; /etc/init.d/squid3 start >/dev/null 2>&1'

>> file; crontab file
By the way, implementing the squid clear cache in Debian and Ubuntu ‘s init scripts and putting a periodic proxy clear up cron, seems like a feature worthy to be proposed to the distro developers and hopefully be embbed in some of the upcoming distro releases 😉
Tags: amp, cache option, clear cache, clearing, command, cron, crontab script, dev, DNS, dns entries, experience, failure, feature, fi, fil, file, file structures, guarantees, Honestly, hosts, init script, Linux, necessery, online, option, proxy, proxy cache, proxy users, rf, root, something, specific, spool, squid, squid cache, Stop, thougths, Ubuntu, ups, Usage, var, way
Posted in Linux, System Administration | No Comments »


How to resolve (fix) WordPress wp-cron.php errors like “POST /wp-cron.php?doing_wp_cron HTTP/1.0″ 404” / What is wp-cron.php and what it does
Monday, March 12th, 2012One of the WordPress websites hosted on our dedicated server produces all the time a wp-cron.php 404 error messages like:
xxx.xxx.xxx.xxx - - [15/Apr/2010:06:32:12 -0600] "POST /wp-cron.php?doing_wp_cron HTTP/1.0
I did not know until recently, whatwp-cron.php does, so I checked in google and red a bit. Many of the places, I've red are aa bit unclear and doesn't give good exlanation on what exactly wp-cron.php does. I wrote this post in hope it will shed some more light on wp-config.php and how this major 404 issue is solved..
So
what is wp-cron.php doing?
Suppose you're writting a new post and you want to take advantage of WordPress functionality to schedule a post to appear Online at specific time:
The Publish Immediately, field execution is being issued on the scheduled time thanks to the wp-cron.php periodic invocation.
Another example for wp-cron.php operation is in handling flushing of WP old HTML Caches generated by some wordpress caching plugin like W3 Total Cache
wp-cron.php takes care for dozens of other stuff silently in the background. That's why many wordpress plugins are depending heavily on wp-cron.php proper periodic execution. Therefore if something is wrong with wp-config.php, this makes wordpress based blog or website partially working or not working at all.
Our company wp-cron.php errors case
In our case the:
212.235.185.131 – – [15/Apr/2010:06:32:12 -0600] "POST /wp-cron.php?doing_wp_cron HTTP/1.0" 404
is occuring in Apache access.log (after each unique vistor request to wordpress!.), this is cause wp-cron.php is invoked on each new site visitor site request.
This puts a "vain load" on the Apache Server, attempting constatly to invoke the script … always returning not found 404 err.
As a consequence, the WP website experiences "weird" problems all the time. An illustration of a problem caused by the impoper wp-cron.php execution is when we are adding new plugins to WP.
Lets say a new wordpress extension is download, installed and enabled in order to add new useful functioanlity to the site.
Most of the time this new plugin would be malfunctioning if for example it is prepared to add some kind of new html form or change something on some or all the wordpress HTML generated pages.WP cache directory is manually deleted with rm -rf /var/www/blog/wp-content/cache/…
This troubles are result of wp-config.php's inability to update settings in wp SQL database, after each new user request to our site.
So the newly added plugin website functionality is not showing up at all, until
I don't know how thi whole wp-config.php mess occured, however my guess is whoever installed this wordpress has messed something in the install procedure.
Anyways, as I researched thoroughfully, I red many people complaining of having experienced same wp-config.php 404 errs. As I red, most of the people troubles were caused by their shared hosting prohibiting the wp-cron.php execution.
It appears many shared hostings providers choose, to disable the wordpress default wp-cron.php execution. The reason is probably the script puts heavy load on shared hosting servers and makes troubles with server overloads.
Anyhow, since our company server is adedicated server I can tell for sure in our case wordpress had no restrictions for how and when wp-cron.php is invoked.
I've seen also some posts online claiming, the wp-cron.php issues are caused of improper localhost records in /etc/hosts, after a thorough examination I did not found any hosts problems:
hipo@debian:~$ grep -i 127.0.0.1 /etc/hosts
127.0.0.1 localhost.localdomain localhost
You see from below paste, our server, /etc/hosts has perfectly correct 127.0.0.1 records.
Changing default way wp-cron.php is executed
As I've learned it is generally a good idea for WordPress based websites which contain tens of thousands of visitors, to alter the default way wp-cron.php is handled. Doing so will achieve some efficiency and improve server hardware utilization.
Invoking the script, after each visitor request can put a heavy "useless" burden on the server CPU. In most wordpress based websites, the script did not need to make frequent changes in the DB, as new comments in posts did not happen often. In most wordpress installs out there, big changes in the wordpress are not common.
Therefore, a good frequency to exec wp-cron.php, for wordpress blogs getting only a couple of user comments per hour is, half an hour cron routine.
To disable automatic invocation of wp-cron.php, after each visitor request open /var/www/blog/wp-config.php and nearby the line 30 or 40, put:
define('DISABLE_WP_CRON', true);
An important note to make here is that it makes sense the position in wp-config.php, where define('DISABLE_WP_CRON', true); is placed. If for instance you put it at the end of file or near the end of the file, this setting will not take affect.
With that said be sure to put the variable define, somewhere along the file initial defines or it will not work.
Next, with Apache non-root privileged user lets say www-data, httpd, www depending on the Linux distribution or BSD Unix type add a php CLI line to invoke wp-cron.php every half an hour:
linux:~# crontab -u www-data -e
0,30 * * * * cd /var/www/blog; /usr/bin/php /var/www/blog/wp-cron.php 2>&1 >/dev/null
To assure, the php CLI (Command Language Interface) interpreter is capable of properly interpreting the wp-cron.php, check wp-cron.php for syntax errors with cmd:
linux:~# php -l /var/www/blog/wp-cron.php
No syntax errors detected in /var/www/blog/wp-cron.php
That's all, 404 wp-cron.php error messages will not appear anymore in access.log! 🙂
Just for those who can find the root of the /wp-cron.php?doing_wp_cron HTTP/1.0" 404 and fix the issue in some other way (I'll be glad to know how?), there is also another external way to invoke wp-cron.php with a request directly to the webserver with short cron invocation via wget or lynx text browser.
– Here is how to call wp-cron.php every half an hour with lynxPut inside any non-privileged user, something like:
01,30 * * * * /usr/bin/lynx -dump "http://www.your-domain-url.com/wp-cron.php?doing_wp_cron" 2>&1 >/dev/null
– Call wp-cron.php every 30 mins with wget:
01,30 * * * * /usr/bin/wget -q "http://www.your-domain-url.com/wp-cron.php?doing_wp_cron"
Invoke the wp-cron.php less frequently, saves the server from processing the wp-cron.php thousands of useless times.
Altering the way wp-cron.php works should be seen immediately as the reduced server load should drop a bit.
Consider you might need to play with the script exec frequency until you get, best fit cron timing. For my company case there are only up to 3 new article posted a week, hence too high frequence of wp-cron.php invocations is useless.
With blog where new posts occur once a day a script schedule frequency of 6 up to 12 hours should be ok.
Tags: akismet, Auto, caches, checks, commentor, cr, cron, daySuppose, dedicated server, doesn, dozens, Draft, email, error messages, execution, exlanation, file, google, HTML, HTTP, invocation, localhost, nbsp, newsletter, operation, periodic execution, php, plugin, quot, request, scheduler, someone, something, spam, SQL, time, time thanks, Wordpress, wordpress plugins, wp
Posted in System Administration, Web and CMS, Wordpress | 3 Comments »