Posts Tagged ‘configured’

Adding proxy to yum repository on Redhat / Fedora / CentOS and other RPM based Linux distributions, Listing and enabling new RPM repositories

Tuesday, September 7th, 2021

yum-add-proxy-host-for-redhat-linux-centos-list-rpm-repositories-enable-disable-repositories

Sometimes if you work in a company that is following PCI standards with very tight security you might need to use a custom company prepared RPM repositories that are accessible only via a specific custom maintained repositories or alternatively you might need the proxy node  to access an external internet repository from the DMZ-ed firewalled zone where the servers lays .
Hence to still be able to maintain the RPM based servers up2date to the latest security patches and install software with yumone very useful feature of yum package manager is to use a proxy host through which you will reach your Redhat Package Manager files  files.

1. The http_proxy and https_proxy shell variables 

To set  a proxy host you need to define there the IP / Hostname or the Fully Qualified Domain Name (FQDN).

By default "http_proxy and https_proxy are empty. As you can guess https_proxy is used if you have a Secure Socket Layer (SSL) certificate for encrypting the communication channel (e.g. you have https:// URL).

[root@rhel: ~]# echo $http_proxy
[root@rhel: ~]#

2. Setting passwordless or password protected proxy host via http_proxy, https_proxy variables

There is a one time very straight forward to configure proxying of traffic via a specific remote configured server with server bourne again  shell (BASH)'s understood variables:
 

a.) Set password free open proxy to shell environment.

[root@centos: ~]# export https_proxy="https://remote-proxy-server:8080"


Now use yum as usual to update the available installabe package list or simply upgrade to the latest packages with lets say:

[root@rhel: ~]# yum check-update && yum update

b.) Configuring password protected proxy for yum

If your proxy is password protected for even tigher security you can provide the password on the command line as well.

[root@centos: ~]# export http_proxy="http://username:pAssW0rd@server:port/"

Note that if you have some special characters you will have to pass the string inside single quotes or escape them to make sure the password will properly handled to server, before trying out the proxy with yum, echo the variable.

[root@centos: ~]# export http_proxy='http://username:p@s#w:E@192.168.0.1:3128/'
  [root@centos: ~]# echo $http_proxy
http://username:p@s#w:E@server:port/

Then do whatever with yum:

[root@centos: ~]# yum check-update && yum search sharutils


If something is wrong and proxy is not properly connected try to reach for the repository manually with curl or wget

[root@centos: ~]# curl -ilk http://download.fedoraproject.org/pub/epel/7/SRPMS/ /epel/7/SRPMS/
HTTP/1.1 302 Found
Date: Tue, 07 Sep 2021 16:49:59 GMT
Server: Apache
X-Frame-Options: SAMEORIGIN
X-Xss-Protection: 1; mode=block
X-Content-Type-Options: nosniff
Referrer-Policy: same-origin
Location: http://mirror.telepoint.bg/epel/7/SRPMS/
Content-Type: text/plain
Content-Length: 0
AppTime: D=2264
X-Fedora-ProxyServer: proxy01.iad2.fedoraproject.org
X-Fedora-RequestID: YTeYOE3mQPHH_rxD0sdlGAAAA80
X-Cache: MISS from pcfreak
X-Cache-Lookup: MISS from pcfreak:3128
Via: 1.1 pcfreak (squid/4.6)
Connection: keep-alive


Or if you need, you can test the user, password protected proxy with wget as so:

[root@centos: ~]# wget –proxy-user=USERNAME –proxy-password=PASSWORD http://your-proxy-domain.com/optional-rpms/


If you have lynx installed on the machine you can do the remote proxy successful authentication check with it with less typing:

[root@centos: ~]# lynx -pauth=USER:PASSWORD http://proxy-domain.com/optional-rpm/


3. Making yum proxy connection permanent via /etc/yum.conf


Perhaps the easiest and quickest way to add the http_proxy / https_proxy configured is to store it to automatically load on each server ssh login in your admin user (root) in /root/.bashrc or /root/.bash_profile or in the global /etc/profile or /etc/profile.d/custom.sh etc.

However if you don't want to have hacks and have more cleanness on the systems, the recommended "Redhat way" so to say is to store the configuration inside /etc/yum.conf

To do it via /etc/yum.conf you have to have some records there like:

# The proxy server – proxy server:port number 
proxy=http://mycache.mydomain.com:3128 
# The account details for yum connections 
proxy_username=yum-user 
proxy_password=qwerty-secret-pass

4. Listing RPM repositories and their state

As I had to install sharutils RPM package to the server which contains the file /bin/uuencode (that is provided on CentOS 7.9 Linux from Repo: base/7/x86_64 I had to check whether the repository was installed on the server.

To get a list of all yum repositories avaiable 

[root@centos:/etc/yum.repos.d]# yum repolist all
Loaded plugins: fastestmirror
Loading mirror speeds from cached hostfile
 * base: centos.telecoms.bg
 * epel: mirrors.netix.net
 * extras: centos.telecoms.bg
 * remi: mirrors.netix.net
 * remi-php74: mirrors.netix.net
 * remi-safe: mirrors.netix.net
 * updates: centos.telecoms.bg
repo id                                repo name                                                                         status
base/7/x86_64                          CentOS-7 – Base                                                                   enabled: 10,072
base-debuginfo/x86_64                  CentOS-7 – Debuginfo                                                              disabled
base-source/7                          CentOS-7 – Base Sources                                                           disabled
c7-media                               CentOS-7 – Media                                                                  disabled
centos-kernel/7/x86_64                 CentOS LTS Kernels for x86_64                                                     disabled
centos-kernel-experimental/7/x86_64    CentOS Experimental Kernels for x86_64                                            disabled
centosplus/7/x86_64                    CentOS-7 – Plus                                                                   disabled
centosplus-source/7                    CentOS-7 – Plus Sources                                                           disabled
cr/7/x86_64                            CentOS-7 – cr                                                                     disabled
epel/x86_64                            Extra Packages for Enterprise Linux 7 – x86_64                                    enabled: 13,667
epel-debuginfo/x86_64                  Extra Packages for Enterprise Linux 7 – x86_64 – Debug                            disabled
epel-source/x86_64                     Extra Packages for Enterprise Linux 7 – x86_64 – Source                           disabled
epel-testing/x86_64                    Extra Packages for Enterprise Linux 7 – Testing – x86_64                          disabled
epel-testing-debuginfo/x86_64          Extra Packages for Enterprise Linux 7 – Testing – x86_64 – Debug                  disabled
epel-testing-source/x86_64             Extra Packages for Enterprise Linux 7 – Testing – x86_64 – Source                 disabled
extras/7/x86_64                        CentOS-7 – Extras                                                                 enabled:    500
extras-source/7                        CentOS-7 – Extras Sources                                                         disabled
fasttrack/7/x86_64                     CentOS-7 – fasttrack                                                              disabled
remi                                   Remi's RPM repository for Enterprise Linux 7 – x86_64                             enabled:  7,229
remi-debuginfo/x86_64                  Remi's RPM repository for Enterprise Linux 7 – x86_64 – debuginfo                 disabled
remi-glpi91                            Remi's GLPI 9.1 RPM repository for Enterprise Linux 7 – x86_64                    disabled
remi-glpi92                            Remi's GLPI 9.2 RPM repository for Enterprise Linux 7 – x86_64                    disabled
remi-glpi93                            Remi's GLPI 9.3 RPM repository for Enterprise Linux 7 – x86_64                    disabled
remi-glpi94                            Remi's GLPI 9.4 RPM repository for Enterprise Linux 7 – x86_64                    disabled
remi-modular                           Remi's Modular repository for Enterprise Linux 7 – x86_64                         disabled
remi-modular-test                      Remi's Modular testing repository for Enterprise Linux 7 – x86_64                 disabled
remi-php54                             Remi's PHP 5.4 RPM repository for Enterprise Linux 7 – x86_64                     disabled
remi-php55                             Remi's PHP 5.5 RPM repository for Enterprise Linux 7 – x86_64                     disabled
remi-php55-debuginfo/x86_64            Remi's PHP 5.5 RPM repository for Enterprise Linux 7 – x86_64 – debuginfo         disabled
!remi-php56                            Remi's PHP 5.6 RPM repository for Enterprise Linux 7 – x86_64                     disabled
remi-php56-debuginfo/x86_64            Remi's PHP 5.6 RPM repository for Enterprise Linux 7 – x86_64 – debuginfo         disabled
remi-php70                             Remi's PHP 7.0 RPM repository for Enterprise Linux 7 – x86_64                     disabled
remi-php70-debuginfo/x86_64            Remi's PHP 7.0 RPM repository for Enterprise Linux 7 – x86_64 – debuginfo         disabled
remi-php70-test                        Remi's PHP 7.0 test RPM repository for Enterprise Linux 7 – x86_64                disabled
remi-php70-test-debuginfo/x86_64       Remi's PHP 7.0 test RPM repository for Enterprise Linux 7 – x86_64 – debuginfo    disabled
remi-php71                             Remi's PHP 7.1 RPM repository for Enterprise Linux 7 – x86_64                     disabled
remi-php71-debuginfo/x86_64            Remi's PHP 7.1 RPM repository for Enterprise Linux 7 – x86_64 – debuginfo         disabled
remi-php71-test                        Remi's PHP 7.1 test RPM repository for Enterprise Linux 7 – x86_64                disabled
remi-php71-test-debuginfo/x86_64       Remi's PHP 7.1 test RPM repository for Enterprise Linux 7 – x86_64 – debuginfo    disabled
!remi-php72                            Remi's PHP 7.2 RPM repository for Enterprise Linux 7 – x86_64                     disabled
remi-php72-debuginfo/x86_64            Remi's PHP 7.2 RPM repository for Enterprise Linux 7 – x86_64 – debuginfo         disabled
remi-php72-test                        Remi's PHP 7.2 test RPM repository for Enterprise Linux 7 – x86_64                disabled
remi-php72-test-debuginfo/x86_64       Remi's PHP 7.2 test RPM repository for Enterprise Linux 7 – x86_64 – debuginfo    disabled
remi-php73                             Remi's PHP 7.3 RPM repository for Enterprise Linux 7 – x86_64                     disabled
remi-php73-debuginfo/x86_64            Remi's PHP 7.3 RPM repository for Enterprise Linux 7 – x86_64 – debuginfo         disabled
remi-php73-test                        Remi's PHP 7.3 test RPM repository for Enterprise Linux 7 – x86_64                disabled
remi-php73-test-debuginfo/x86_64       Remi's PHP 7.3 test RPM repository for Enterprise Linux 7 – x86_64 – debuginfo    disabled
remi-php74                             Remi's PHP 7.4 RPM repository for Enterprise Linux 7 – x86_64                     enabled:    423
remi-php74-debuginfo/x86_64            Remi's PHP 7.4 RPM repository for Enterprise Linux 7 – x86_64 – debuginfo         disabled
remi-php74-test                        Remi's PHP 7.4 test RPM repository for Enterprise Linux 7 – x86_64                disabled
remi-php74-test-debuginfo/x86_64       Remi's PHP 7.4 test RPM repository for Enterprise Linux 7 – x86_64 – debuginfo    disabled
remi-php80                             Remi's PHP 8.0 RPM repository for Enterprise Linux 7 – x86_64                     disabled
remi-php80-debuginfo/x86_64            Remi's PHP 8.0 RPM repository for Enterprise Linux 7 – x86_64 – debuginfo         disabled
remi-php80-test                        Remi's PHP 8.0 test RPM repository for Enterprise Linux 7 – x86_64                disabled
remi-php80-test-debuginfo/x86_64       Remi's PHP 8.0 test RPM repository for Enterprise Linux 7 – x86_64 – debuginfo    disabled
remi-safe                              Safe Remi's RPM repository for Enterprise Linux 7 – x86_64                        enabled:  4,549
remi-safe-debuginfo/x86_64             Remi's RPM repository for Enterprise Linux 7 – x86_64 – debuginfo                 disabled
remi-test                              Remi's test RPM repository for Enterprise Linux 7 – x86_64                        disabled
remi-test-debuginfo/x86_64             Remi's test RPM repository for Enterprise Linux 7 – x86_64 – debuginfo            disabled
updates/7/x86_64                       CentOS-7 – Updates                                                                enabled:  2,741
updates-source/7                       CentOS-7 – Updates Sources                                                        disabled
zabbix/x86_64                          Zabbix Official Repository – x86_64                                               enabled:    178
zabbix-debuginfo/x86_64                Zabbix Official Repository debuginfo – x86_64                                     disabled
zabbix-frontend/x86_64                 Zabbix Official Repository frontend – x86_64                                      disabled
zabbix-non-supported/x86_64            Zabbix Official Repository non-supported – x86_64                                 enabled:      5
repolist: 39,364

[root@centos:/etc/yum.repos.d]# yum repolist all|grep -i 'base/7/x86_64'
base/7/x86_64                       CentOS-7 – Base              enabled: 10,072


As you can see in CentOS 7 sharutils is enabled from default repositories, however this is not the case on Redhat 7.9, hence to install sharutils there you can one time enable RPM repository to install sharutils 

[root@centos:/etc/yum.repos.d]# yum –enablerepo=rhel-7-server-optional-rpms install sharutils

To install zabbix-agent on the same Redhat server, without caring that I need precisely  know the RPM repository that is providing zabbix agent that in that was (Repo: 3party/7Server/x86_64)  I had to:

[root@centos:/etc/yum.repos.d]# yum –enablerepo \* install zabbix-agent zabbix-sender


Permanently enabling repositories of course is possible via editting or creating fresh new file configuration manually on CentOS / Fedora under directory /etc/yum.repos.d/
On Redhat Enterprise Linux  servers it is easier to use the subscription-manager command instead, like this:
 

[root@rhel:/root]# subscription-manager repos –disable=epel/7Server/x86_64

[root@rhel:/root]# subscription-manager repos –enable=rhel-6-server-optional-rpms

OpenVZ enable or disable auto start on Linux Hypervisor host boot for Virtual Machine containers

Wednesday, July 7th, 2021

howto-add-virtual-machine-to-auto-start-with-vz-openvz-linux-containers-4-logo-slogan-vertical-big

To make OpenVZ / Virtuozzo Hypervisor servers and you are not sure whether your configured container virtual machines are configured to automatically boot on Linux Physical OS host boot in case of restart after patch update set or after unexpected shutdown due to Kernel / OS bug a hang or due to some electricity Power outage.

To check what is your current configuration for Virtual Environment on CentOS Linux you need to check inside /etc/sysconfig/vz-scripts/VEID.conf
You need to check the value for inside the file

ONBOOT="" 

To get the exact ID of "VEID.conf of the current openvz guest VM containers exec:

[root@openvz vz-scripts]# vzlist -a
      CTID      NPROC STATUS    IP_ADDR         HOSTNAME
       300         23 running   10.10.10.1     VirtualMachine1
       301         25 running   10.10.10.2     VirtualMachine2

[root@openvz ~]# cd /etc/sysconfig/vz-scripts
[root@gbapp2 vz-scripts]# pwd
/etc/sysconfig/vz-scripts

[root@openvz vz-scripts]# grep -i ONBOOT 300.conf 301.conf
300.conf:ONBOOT="yes"
301.conf:ONBOOT="yes"

If you happen to have configured ONBOOT="no" you will need to the change to respective VEID.conf:

vi /etc/sysconfig/vz-scripts/VEID.conf

search for

ONBOOT=”no”

and change to

ONBOOT=”yes”

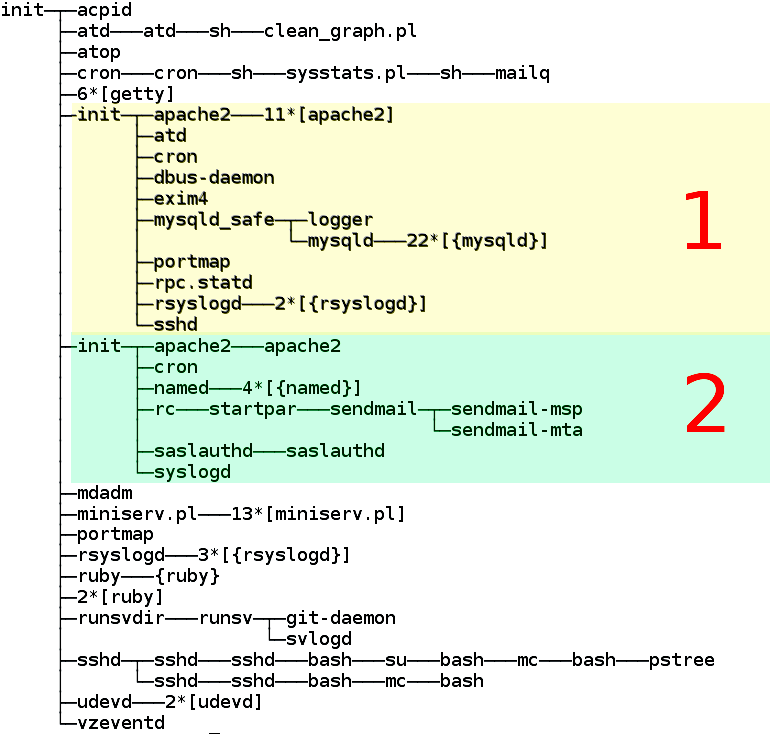
OpenVZ_virtuozzo-standard-process-tree-landscape

OpenVZ server process tree. The colors of the virtual severs are indicated by colors.

OpenVZ Quick cheat sheet commands

This change will auto-start the VPS container next time the host Hypervisor node is rebooted.
If you happen to have daily work with OpenVZ legacy systems like I do you might find also useful the following OpenVZ Cheatsheet pdf document.

A miniature quick cheatsheet for OpenVZ Virtualion, in case if you are like me and you have to use various virtualization technologies and tend to forget is as below:

vzlist                               # List running instances
vzlist -a                            # List all instances


vzctl stop <instance>
vzctl start <instance>
vzctl status <instance>

vzctl exec <instance> <command>      # Run a command

vzctl enter <instance>               # Get console

vzyum <instance> install <package>   # Install a package


# Change properties
vzctl set <instance> –hostname <hostname> –save
vzctl set <instance> –ipadd <IP> –save
vzctl set <instance> –userpasswd root:<password> –save

If need to get more insight on how OpenVZ Virtualization does work on a low level and stretch out its possibilities, an old but useful document you might want to check is OpenVZ-Users-Guide PDF.


If you need it to hava e copy of it openvz_cheat_sheet.txt.

Stop haproxy log requests to /var/log/messages / Disable haproxy double logging

Friday, June 25th, 2021

haproxy-logo

On a CentOS Linux release 7.9.2009 (Core) I've running haproxies on two KVM virtual machines that are configured in a High Avaialability cluster with Corosync and Pacemaker, the machines are inherited from another admin (I did not install the servers hardware) and OS but have been received the system for support.
The old sysadmins seems to not care much about the system so they've left the haprxoy with Double logging one time under separate configured log in /var/log/haproxy/haproxyprod.log and each Haproxy TCP mode flown request has been double logged to /var/log/messages as well. As you can guess this shouldn't be so because we're wasting Hard drive space so to fix that I had to stop haproxy doble logging to /var/log/messages.

The logging is done under a separate local pointer local6 the /etc/haproxy/haproxyprod.cfg goes as follows:
 

[root@haproxy01 ~]# cat /etc/haproxy/haproxyprod.cfg

global
    # log <address> [len ] [max level [min level]]
    log 127.0.0.1 local6 debug


The logging is handled by rsyslog via the local6, so obviously to keep out the logging from /var/log/messages
The logging to the separate log file configuration in rsyslog is as follows:

local6.*                                                /var/log/haproxy/haproxyprod.log

It turned to be really easy to prevent haproxy get its requests log to /var/log/messages all I had to change is under /etc/rsyslogd.conf

local6.none config has to be placed for /var/log/messages the full line configuration in /etc/rsyslog.conf that stopped double logging is:

# Don't log private authentication messages!
*.info;mail.none;authpriv.none;cron.none;local5.none;local6.none                /var/log/messages


Deny DHCP Address by MAC on Linux

Thursday, October 8th, 2020

Deny DHCP addresses by MAC ignore MAC to not be DHCPD leased on GNU / Linux howto

I have not blogged for a long time due to being on a few weeks vacation and being in home with a small cute baby. However as a hardcore and a bit of dumb System administrator, I have spend some of my vacation and   worked on bringing up the the www.pc-freak.net and the other Websites hosted as a high availvailability ones living on a 2 Webservers running on a Master to Master MySQL Replication backend database, this is oll hosted on  servers, set to run as a round robin DNS hosts on 2 servers one old Lenove ThinkCentre Edge71 as well as a brand new real Lenovo server Lenovo ThinkServer SD350 with 24 CPUs and a 32 GB of RAM
To assure Internet Connectivity is having a good degree of connectivity and ensure websites hosted on both machines is not going to die if one of the 2 pair configured Fiber Optics Internet Providers Bergon.NET has some Issues, I've rented another Internet Provider Line is set bought from the VIVACOM Mobile Fiber Internet provider – that is a 1 Gigabit Fiber Optics Line.
Next to that to guarantee there is no Database, Webserver, MailServer, Memcached and other running services did not hit downtimes due to Electricity power outage, two Powerful Uninterruptable Power Supplies (UPS)  FPS Fortron devices are connected to the servers each of which that could keep the machine and the connected switches and Servers for up to 1 Hour.

The machines are configured to use dhcpd to distributed IP addresses and the Main Node is set to distribute IPs, however as there is a local LAN network with more of a personal Work PCs, Wireless Devices and Testing Computers and few Virtual machines in the Network and the IPs are being distributed in a consequential manner via a ISC DHCP server.

As always to make everything work properly hence, I had again some a bit weird non-standard requirement to make some of the computers within the Network with Static IP addresses and the others to have their IPs received via the DHCP (Dynamic Host Configuration Protocol) and add some filter for some of the Machine MAC Addresses which are configured to have a static IP addresses to prevent the DHCP (daemon) server to automatically reassign IPs to this machines.

After a bit of googling and pondering I've done it and some of the machines, therefore to save others the efforts to look around How to set Certain Computers / Servers Network Card MAC (Interfaces) MAC Addresses  configured on the LAN network to use Static IPs and instruct the DHCP server to ingnore any broadcast IP addresses leases – if they're to be destined to a set of IGNORED MAcs, I came up with this small article.

Here is the DHCP server /etc/dhcpd/dhcpd.conf from my Debian GNU / Linux (Buster) 10.4


option domain-name "pcfreak.lan";
option domain-name-servers 8.8.8.8, 8.8.4.4, 208.67.222.222, 208.67.220.220;
max-lease-time 891200;
authoritative;
class "black-hole" {
    match substring (hardware, 1, 6);
    ignore booting;
}
subclass "black-hole" 18:45:91:c3:d9:00;
subclass "black-hole" 70:e2:81:13:44:11;
subclass "black-hole" 70:e2:81:13:44:12;
subclass "black-hole" 00:16:3f:53:5d:11;
subclass "black-hole" 18:45:9b:c6:d9:00;
subclass "black-hole" 16:45:93:c3:d9:09;
subclass "black-hole" 16:45:94:c3:d9:0d;/etc/dhcpd/dhcpd.conf
subclass "black-hole" 60:67:21:3c:20:ec;
subclass "black-hole" 60:67:20:5c:20:ed;
subclass "black-hole" 00:16:3e:0f:48:04;
subclass "black-hole" 00:16:3e:3a:f4:fc;
subclass "black-hole" 50:d4:f5:13:e8:ba;
subclass "black-hole" 50:d4:f5:13:e8:bb;
subnet 192.168.0.0 netmask 255.255.255.0 {
        option routers                  192.168.0.1;
        option subnet-mask              255.255.255.0;
}
host think-server {
        hardware ethernet 70:e2:85:13:44:12;
        fixed-address 192.168.0.200;
}
default-lease-time 691200;
max-lease-time 891200;
log-facility local7;

To spend you copy paste efforts a file with Deny DHCP Address by Mac Linux configuration is here
/home/hipo/info
Of course I have dumped the MAC Addresses to omit a data leaking but I guess the idea behind the MAC ADDR ignore is quite clear

The main configuration doing the trick to ignore a certain MAC ALenovo ThinkServer SD350ddresses that are reachable on the Connected hardware switch on the device is like so:

class "black-hole" {
    match substring (hardware, 1, 6);
    ignore booting;
}
subclass "black-hole" 18:45:91:c3:d9:00;


The Deny DHCP Address by MAC is described on isc.org distribution lists here but it seems the documentation on the topic on how to Deny / IGNORE DHCP Addresses by MAC Address on Linux has been quite obscure and limited online.

As you can see in above config the time via which an IP is freed up and a new IP lease is done from the server is severely maximized as often DHCP servers do use a max-lease-time like 1 hour (3600) seconds:, the reason for increasing the lease time to be to like 10 days time is that the IPs in my network change very rarely so it is a waste of CPU cycles to do a frequent lease.

default-lease-time 691200;
max-lease-time 891200;


As you see to Guarantee resolving works always as expected I have configured – Google Public DNS and OpenDNS IPs

option domain-name-servers 8.8.8.8, 8.8.4.4, 208.67.222.222, 208.67.220.220;


One hint to make is, after setting up all my desired config in the standard config location /etc/dhcp/dhcpd.conf it is always good idea to test configuration before reloading the running dhcpd process.


root@pcfreak: ~# /usr/sbin/dhcpd -t
Internet Systems Consortium DHCP Server 4.4.1
Copyright 2004-2018 Internet Systems Consortium.
All rights reserved.
For info, please visit https://www.isc.org/software/dhcp/
Config file: /etc/dhcp/dhcpd.conf
Database file: /va/home/hipo/infor/lib/dhcp/dhcpd.leases
PID file: /var/run/dhcpd.pid
 

That's all folks with this sample config the IPs under subclass "black-hole", which are a local LAN Static IP Addresses will never be offered leasess anymore from the ISC DHCP.
Hope this stuff helps someone, enjoy and in case if you need a colocation of a server or a website hosting for a really cheap price on this new set High Availlability up described machines open an inquiry on https://web.www.pc-freak.net.


Linux: Howto Disable logging for all VirtualHosts on Apache and NGINX Webservers one liner

Wednesday, July 1st, 2020

disable-apache-nginx-logging-for-all-virtualhosts
Did you happen to administer Apache Webservers or NGINX webservers whose logs start to grow so rapidly that are flooding the disk too quickly?
Well this happens sometimes and it also happens that sometimes you just want to stop logging especially, to offload disk writting.

There is an easy way to disable logging for requests and errors (access_log and error_log usually residing under /var/log/httpd or /var/log/nginx ) for  all configured Virtual Domains with a short one liner, here is how.

Before you start  Create backup of /etc/apache2/sites-enabled / or /etc/nginx to be able to revert back to original config.

# cp -rpf /etc/apache2/sites-enabled/ ~/

# cp -rpf /etc/nginx/ ~/


1. Disable Logging for All  Virtual Domains configured for Apache Webserver

First lets print what the command will do to make sure we don't mess something

# find /home/hipo/sites-enabled/* -exec echo sed -i 's/#*[Cc]ustom[Ll]og/#CustomLog/g' {} \;


You will get some output like

find /home/hipo//sites-enabled/* -exec echo sed -i 's/#*[Cc]ustom[Ll]og/#CustomLog/g' {} \;

find /etc/apache2/sites-enabled/* -exec sed -i 's/#*[Cc]ustom[Ll]og/#CustomLog/g' {} \;
find /etc/apache2/sites-enabled/* -exec sed -i 's/#*[Ee]rror[Ll]og/#ErrorLog/g' {} \;

2. Disable Logging for All configured Virtual Domains for NGINX Webserver
 

find /etc/nginx/sites-enabled/* -exec sed -i 's/#*access_log/#access_log/g' {} \;
find /etc/nginx/sites-enabled/* -exec sed -i 's/#*error_log/#error_log/g' {} \;

f course above substituations that will comment out with '#' occurances from file configs of only default set access_log and error_log / access.log, error.log 
for machines where there is no certain convention on file naming and there are multiple domains in custom produced named log files this won't work.

This one liner was inspired from a friend's daily Martin Petrov. Martin blogged initially about this nice tip for those reading Cyrillic check out mpetrov.net, so. Thanks Marto ! 🙂

How to enable HaProxy logging to a separate log /var/log/haproxy.log / prevent HAProxy duplicate messages to appear in /var/log/messages

Wednesday, February 19th, 2020

haproxy-logging-basics-how-to-log-to-separate-file-prevent-duplicate-messages-haproxy-haproxy-weblogo-squares
haproxy  logging can be managed in different form the most straight forward way is to directly use /dev/log either you can configure it to use some log management service as syslog or rsyslogd for that.

If you don't use rsyslog yet to install it: 

# apt install -y rsyslog

Then to activate logging via rsyslogd we can should add either to /etc/rsyslogd.conf or create a separte file and include it via /etc/rsyslogd.conf with following content:
 

Enable haproxy logging from rsyslogd


Log haproxy messages to separate log file you can use some of the usual syslog local0 to local7 locally used descriptors inside the conf (be aware that if you try to use some wrong value like local8, local9 as a logging facility you will get with empty haproxy.log, even though the permissions of /var/log/haproxy.log are readable and owned by haproxy user.

When logging to a local Syslog service, writing to a UNIX socket can be faster than targeting the TCP loopback address. Generally, on Linux systems, a UNIX socket listening for Syslog messages is available at /dev/log because this is where the syslog() function of the GNU C library is sending messages by default. To address UNIX socket in haproxy.cfg use:

log /dev/log local2 


If you want to log into separate log each of multiple running haproxy instances with different haproxy*.cfg add to /etc/rsyslog.conf lines like:

local2.* -/var/log/haproxylog2.log
local3.* -/var/log/haproxylog3.log


One important note to make here is since rsyslogd is used for haproxy logging you need to have enabled in rsyslogd imudp and have a UDP port listener on the machine.

E.g. somewhere in rsyslog.conf or via rsyslog include file from /etc/rsyslog.d/*.conf needs to have defined following lines:

$ModLoad imudp
$UDPServerRun 514


I prefer to use external /etc/rsyslog.d/20-haproxy.conf include file that is loaded and enabled rsyslogd via /etc/rsyslog.conf:

# vim /etc/rsyslog.d/20-haproxy.conf

$ModLoad imudp
$UDPServerRun 514​
local2.* -/var/log/haproxy2.log


It is also possible to produce different haproxy log output based on the severiy to differentiate between important and less important messages, to do so you'll need to rsyslog.conf something like:
 

# Creating separate log files based on the severity
local0.* /var/log/haproxy-traffic.log
local0.notice /var/log/haproxy-admin.log


Prevent Haproxy duplicate messages to appear in /var/log/messages

If you use local2 and some default rsyslog configuration then you will end up with the messages coming from haproxy towards local2 facility producing doubled simultaneous records to both your pre-defined /var/log/haproxy.log and /var/log/messages on Proxy servers that receive few thousands of simultanous connections per second.
This is a problem since doubling the log will produce too much data and on systems with smaller /var/ partition you will quickly run out of space + this haproxy requests logging to /var/log/messages makes the file quite unreadable for normal system events which are so important to track clearly what is happening on the server daily.

To prevent the haproxy duplicate messages you need to define somewhere in rsyslogd usually /etc/rsyslog.conf local2.none near line of facilities configured to log to file:

*.info;mail.none;authpriv.none;cron.none;local2.none     /var/log/messages

This configuration should work but is more rarely used as most people prefer to have haproxy log being written not directly to /dev/log which is used by other services such as syslogd / rsyslogd.

To use /dev/log to output logs from haproxy configuration in global section use config like:
 

global
        log /dev/log local2 debug
        chroot /var/lib/haproxy
        stats socket /run/haproxy/admin.sock mode 660 level admin
        stats timeout 30s
        user haproxy
        group haproxy
        daemon

The log global directive basically says, use the log line that was set in the global section for whole config till end of file. Putting a log global directive into the defaults section is equivalent to putting it into all of the subsequent proxy sections.

Using global logging rules is the most common HAProxy setup, but you can put them directly into a frontend section instead. It can be useful to have a different logging configuration as a one-off. For example, you might want to point to a different target Syslog server, use a different logging facility, or capture different severity levels depending on the use case of the backend application. 

Insetad of using /dev/log interface that is on many distributions heavily used by systemd to store / manage and distribute logs,  many haproxy server sysadmins nowdays prefer to use rsyslogd as a default logging facility that will manage haproxy logs.
Admins prefer to use some kind of mediator service to manage log writting such as rsyslogd or syslog, the reason behind might vary but perhaps most important reason is  by using rsyslogd it is possible to write logs simultaneously locally on disk and also forward logs  to a remote Logging server  running rsyslogd service.

Logging is defined in /etc/haproxy/haproxy.cfg or the respective configuration through global section but could be also configured to do a separate logging based on each of the defined Frontend Backends or default section. 
A sample exceprt from this section looks something like:

#———————————————————————
# Global settings
#———————————————————————
global
    log         127.0.0.1 local2

    chroot      /var/lib/haproxy
    pidfile     /var/run/haproxy.pid
    maxconn     4000
    user        haproxy
    group       haproxy
    daemon

    # turn on stats unix socket
    stats socket /var/lib/haproxy/stats

#———————————————————————
defaults
    mode                    tcp
    log                     global
    option                  tcplog
    #option                  dontlognull
    #option http-server-close
    #option forwardfor       except 127.0.0.0/8
    option                  redispatch
    retries                 7
    #timeout http-request    10s
    timeout queue           10m
    timeout connect         30s
    timeout client          20m
    timeout server          10m
    #timeout http-keep-alive 10s
    timeout check           30s
    maxconn                 3000


# HAProxy Monitoring Config
#———————————————————————
listen stats 192.168.0.5:8080                #Haproxy Monitoring run on port 8080
    mode http
    option httplog
    option http-server-close
    stats enable
    stats show-legends
    stats refresh 5s
    stats uri /stats                            #URL for HAProxy monitoring
    stats realm Haproxy\ Statistics
    stats auth hproxyauser:Password___          #User and Password for login to the monitoring dashboard


#———————————————————————
# frontend which proxys to the backends
#———————————————————————
frontend ft_DKV_PROD_WLPFO
    mode tcp
    bind 192.168.233.5:30000-31050
    option tcplog
    log-format %ci:%cp\ [%t]\ %ft\ %b/%s\ %Tw/%Tc/%Tt\ %B\ %ts\ %ac/%fc/%bc/%sc/%rc\ %sq/%bq
    default_backend Default_Bakend_Name


#———————————————————————
# round robin balancing between the various backends
#———————————————————————
backend bk_DKV_PROD_WLPFO
    mode tcp
    # (0) Load Balancing Method.
    balance source
    # (4) Peer Sync: a sticky session is a session maintained by persistence
    stick-table type ip size 1m peers hapeers expire 60m
    stick on src
    # (5) Server List
    # (5.1) Backend
    server Backend_Server1 10.10.10.1 check port 18088
    server Backend_Server2 10.10.10.2 check port 18088 backup


The log directive in above config instructs HAProxy to send logs to the Syslog server listening at 127.0.0.1:514. Messages are sent with facility local2, which is one of the standard, user-defined Syslog facilities. It’s also the facility that our rsyslog configuration is expecting. You can add more than one log statement to send output to multiple Syslog servers.

Once rsyslog and haproxy logging is configured as a minumum you need to restart rsyslog (assuming that haproxy config is already properly loaded):

# systemctl restart rsyslogd.service

To make sure rsyslog reloaded successfully:

systemctl status rsyslogd.service


Restarting HAproxy

If the rsyslogd logging to 127.0.0.1 port 514 was recently added a HAProxy restart should also be run, you can do it with:
 

# /usr/sbin/haproxy -f /etc/haproxy/haproxy.cfg -D -p /var/run/haproxy.pid -sf $(cat /var/run/haproxy.pid)


Or to restart use systemctl script (if haproxy is not used in a cluster with corosync / heartbeat).

# systemctl restart haproxy.service

You can control how much information is logged by adding a Syslog level by

    log         127.0.0.1 local2 info


The accepted values are the standard syslog security level severity:

Value Severity Keyword Deprecated keywords Description Condition
0 Emergency emerg panic System is unusable A panic condition.
1 Alert alert   Action must be taken immediately A condition that should be corrected immediately, such as a corrupted system database.
2 Critical crit   Critical conditions Hard device errors.
3 Error err error Error conditions  
4 Warning warning warn Warning conditions  
5 Notice notice   Normal but significant conditions Conditions that are not error conditions, but that may require special handling.
6 Informational info   Informational messages  
7 Debug debug   Debug-level messages Messages that contain information normally of use only when debugging a program.


Logging only errors / timeouts / retries and errors is done with option:

Note that if the rsyslog is configured to listen on different port for some weird reason you should not forget to set the proper listen port, e.g.:
 

  log         127.0.0.1:514 local2 info

option dontlog-normal

in defaults or frontend section.

You most likely want to enable this only during certain times, such as when performing benchmarking tests.

(or log-format-sd for structured-data syslog) directive in your defaults or frontend
 

Haproxy Logging shortly explained


The type of logging you’ll see is determined by the proxy mode that you set within HAProxy. HAProxy can operate either as a Layer 4 (TCP) proxy or as Layer 7 (HTTP) proxy. TCP mode is the default. In this mode, a full-duplex connection is established between clients and servers, and no layer 7 examination will be performed. When in TCP mode, which is set by adding mode tcp, you should also add option tcplog. With this option, the log format defaults to a structure that provides useful information like Layer 4 connection details, timers, byte count and so on.

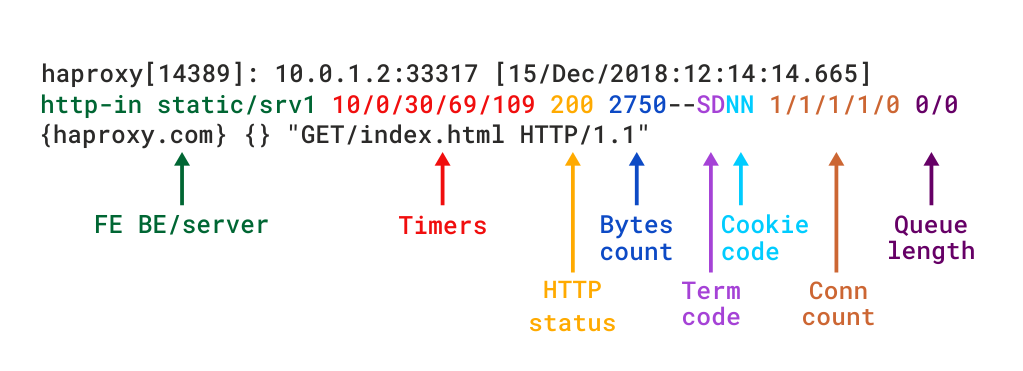
Below is example of configured logging with some explanations:

Log-format "%ci:%cp [%t] %ft %b/%s %Tw/%Tc/%Tt %B %ts %ac/%fc/%bc/%sc/%rc %sq/%bq"

haproxy-logged-fields-explained
Example of Log-Format configuration as shown above outputted of haproxy config:

Log-format "%ci:%cp [%tr] %ft %b/%s %TR/%Tw/%Tc/%Tr/%Ta %ST %B %CC %CS %tsc %ac/%fc/%bc/%sc/%rc %sq/%bq %hr %hs %{+Q}r"

haproxy_http_log_format-explained1

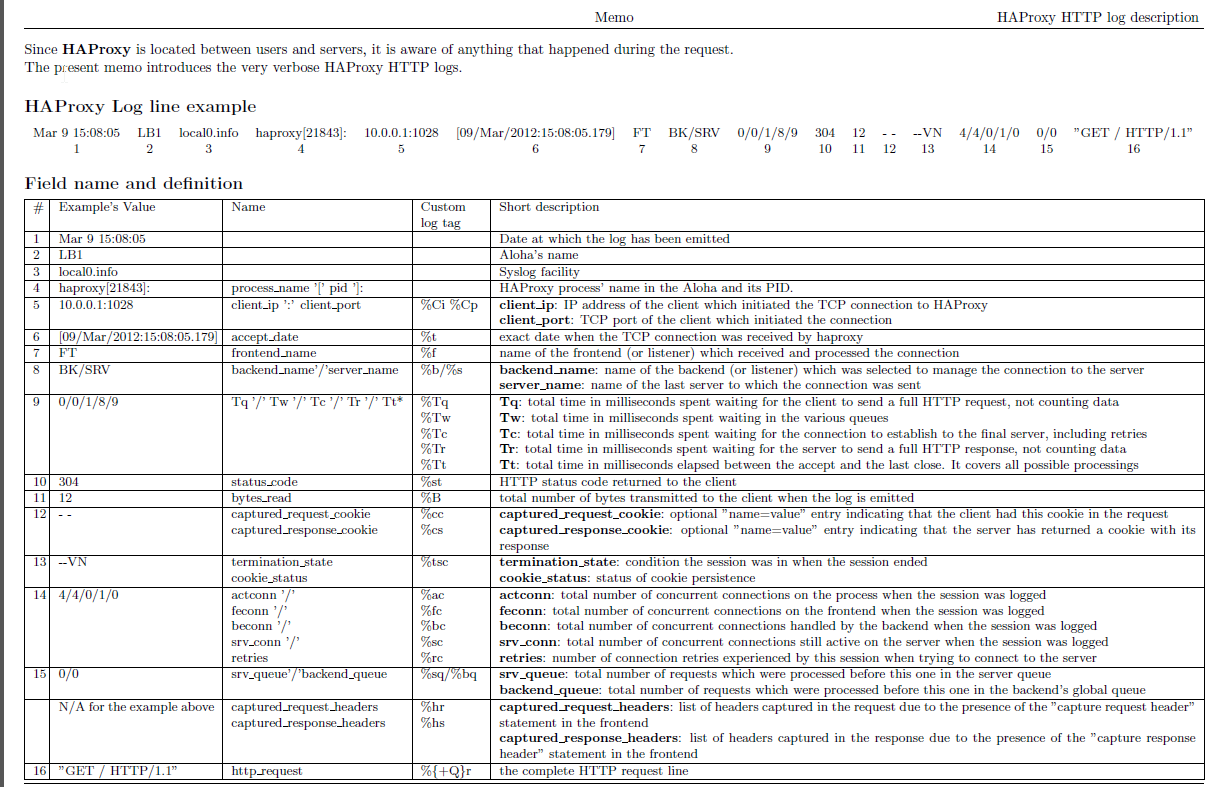
To understand meaning of this abbreviations you'll have to closely read  haproxy-log-format.txt. More in depth info is to be found in HTTP Log format documentation


haproxy_logging-explained

Logging HTTP request headers

HTTP request header can be logged via:
 

 http-request capture

frontend website
    bind :80
    http-request capture req.hdr(Host) len 10
    http-request capture req.hdr(User-Agent) len 100
    default_backend webservers


The log will show headers between curly braces and separated by pipe symbols. Here you can see the Host and User-Agent headers for a request:

192.168.150.1:57190 [20/Dec/2018:22:20:00.899] website~ webservers/server1 0/0/1/0/1 200 462 – – —- 1/1/0/0/0 0/0 {mywebsite.com|Mozilla/5.0 (X11; Linux x86_64) AppleWebKit/537.36 (KHTML, like Gecko) Ubuntu Chromium/71.0.3578.80 } "GET / HTTP/1.1"


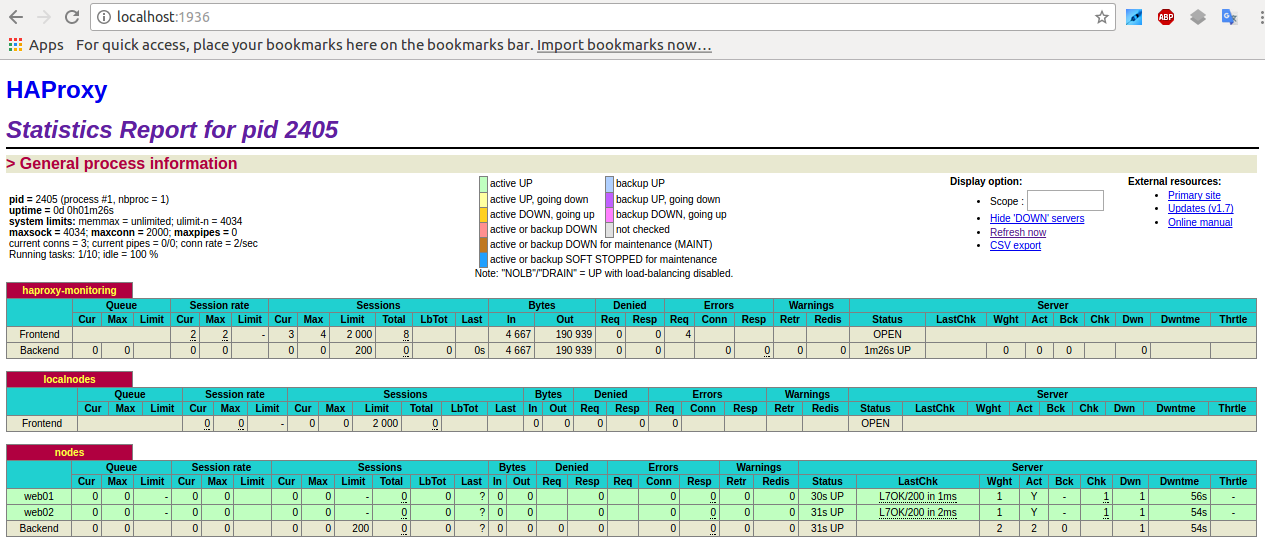
Haproxy Stats Monitoring Web interface


Haproxy is having a simplistic stats interface which if enabled produces some general useful information like in above screenshot, through which
you can get a very basic in browser statistics and track potential issues with the proxied traffic for all configured backends / frontends incoming outgoing
network packets configured nodes
 experienced downtimes etc.

haproxy-statistics-report-picture

The basic configuration to make the stats interface accessible would be like pointed in above config for example to enable network listener on address
 

https://192.168.0.5:8080/stats


with hproxyuser / password config would be:

# HAProxy Monitoring Config
#———————————————————————
listen stats 192.168.0.5:8080                #Haproxy Monitoring run on port 8080
    mode http
    option httplog
    option http-server-close
    stats enable
    stats show-legends
    stats refresh 5s
    stats uri /stats                            #URL for HAProxy monitoring
    stats realm Haproxy\ Statistics
    stats auth hproxyauser:Password___          #User and Password for login to the monitoring dashboard


Sessions states and disconnect errors on new application setup

Both TCP and HTTP logs include a termination state code that tells you the way in which the TCP or HTTP session ended. It’s a two-character code. The first character reports the first event that caused the session to terminate, while the second reports the TCP or HTTP session state when it was closed.

Here are some essential termination codes to track in for in the log:
 

Here are some termination code examples most commonly to see on TCP connection establishment errors:

Two-character code    Meaning
—    Normal termination on both sides.
cD    The client did not send nor acknowledge any data and eventually timeout client expired.
SC    The server explicitly refused the TCP connection.
PC    The proxy refused to establish a connection to the server because the process’ socket limit was reached while attempting to connect.


To get all non-properly exited codes the easiest way is to just grep for anything that is different from a termination code –, like that:

tail -f /var/log/haproxy.log | grep -v ' — '


This should output in real time every TCP connection that is exiting improperly.

There’s a wide variety of reasons a connection may have been closed. Detailed information about all possible termination codes can be found in the HAProxy documentation.
To get better understanding a very useful reading to haproxy Debug errors with  is in haproxy-logging.txt in that small file are collected all the cryptic error messages codes you might find in your logs when you're first time configuring the Haproxy frontend / backend and the backend application behind.

Another useful analyze tool which can be used to analyze Layer 7 HTTP traffic is halog for more on it just google around.

Procedure Instructions to safe upgrade CentOS / RHEL Linux 7 Core to latest release

Thursday, February 13th, 2020

safe-upgrade-CentOS-and_Redhat_Enterprise_Linux_RHEL-7-to-latest-stable-release

Generally upgrading both RHEL and CentOS can be done straight with yum tool just we're pretty aware and mostly anyone could do the update, but it is good idea to do some
steps in advance to make backup of any old basic files that might help us to debug what is wrong in case if the Operating System fails to boot after the routine Machine OS restart
after the upgrade that is usually a good idea to make sure that machine is still bootable after the upgrade.

This procedure can be shortened or maybe extended depending on the needs of the custom case but the general framework should be useful anyways to someone that's why
I decided to post this.

Before you go lets prepare a small status script which we'll use to report status of  sysctl installed and enabled services as well as the netstat connections state and
configured IP addresses and routing on the system.

The script show_running_services_netstat_ips_route.sh to be used during our different upgrade stages:
 

# script status ###
echo "STARTED: $(date '+%Y-%m-%d_%H-%M-%S'):" | tee /root/logs/yumcheckupdate-$(hostname)-$(date '+%Y-%m-%d_%H-%M-%S').out
systemctl list-unit-files –type=service | grep enabled
systemctl | grep ".service" | grep "running"
netstat -tulpn
netstat -r
ip a s
/sbin/route -n
echo "ENDED $(date '+%Y-%m-%d_%H-%M-%S'):" | tee /root/logs/yumcheckupdate-$(hostname)-$(date '+%Y-%m-%d_%H-%M-%S').out
####


– Save the script in any file like /root/status.sh

– Make the /root/logs directoriy.
 

[root@redhat: ~ ]# mkdir /root/logs
[root@redhat: ~ ]# vim /root/status.sh
[root@redhat: ~ ]# chmod +x /root/status.sh


1. Get a dump of CentOS installed version release and grub-mkconfig generated os_probe


[root@redhat: ~ ]# cat /etc/redhat-release  > /root/logs/redhat-release-vorher-$(hostname)-$(date '+%Y-%m-%d_%H-%M-%S').out
[root@redhat: ~ ]# cat /etc/grub.d/30_os-prober > /root/logs/grub2-efi-vorher-$(hostname)-$(date '+%Y-%m-%d_%H-%M-%S').out


2. Clear old versionlock marked RPM packages (if there are such)


On servers maintained by multitude of system administrators just like the case is inside a Global Corporations and generally in the corporate world , where people do access the systems via LDAP and more than a single person
has superuser privileges. It is a good prevention measure to use yum package management  functionality to RPM based Linux distributions called  versionlock.
versionlock for those who hear it for a first time is locking the versions of the installed RPM packages so if someone by mistake or on purpose decides to do something like :

[root@redhat: ~ ]# yum install packageversion

Having the versionlock set will prevent the updated package to be installed with a different branch package version.

Also it will prevent a playful unknowing person who just wants to upgrade the system without any deep knowledge to be able to
run

[root@redhat: ~ ]# yum upgrade

update and leave the system in unbootable state, that will be only revealed during the next system reboot.

If you haven't used versionlock before and you want to use it you can do it with:

[root@redhat: ~ ]# yum install yum-plugin-versionlock

To add all the packages for compiling C code and all the interdependend packages, you can do something like:


[root@redhat: ~ ]# yum versionlock gcc-*

If you want to clear up the versionlock, once it is in use run:

[root@redhat: ~ ]#  yum versionlock clear
[root@redhat: ~ ]#  yum versionlock list


3.  Check RPC enabled / disabled


This step is not necessery but it is a good idea to check whether it running on the system, because sometimes after upgrade rpcbind gets automatically started after package upgrade and reboot. 
If we find it running we'll need to stop and mask the service.


# check if rpc enabled
[root@redhat: ~ ]# systemctl list-unit-files|grep -i rpc
var-lib-nfs-rpc_pipefs.mount                                      static
auth-rpcgss-module.service                                        static
rpc-gssd.service                                                  static
rpc-rquotad.service                                               disabled
rpc-statd-notify.service                                          static
rpc-statd.service                                                 static
rpcbind.service                                                   disabled
rpcgssd.service                                                   static
rpcidmapd.service                                                 static
rpcbind.socket                                                    disabled
rpc_pipefs.target                                                 static
rpcbind.target                                                    static

[root@redhat: ~ ]# systemctl status rpcbind.service
● rpcbind.service – RPC bind service
   Loaded: loaded (/usr/lib/systemd/system/rpcbind.service; disabled; vendor preset: enabled)
   Active: inactive (dead)


[root@redhat: ~ ]# systemctl status rpcbind.socket
● rpcbind.socket – RPCbind Server Activation Socket
   Loaded: loaded (/usr/lib/systemd/system/rpcbind.socket; disabled; vendor preset: enabled)
   Active: inactive (dead)
   Listen: /var/run/rpcbind.sock (Stream)
           0.0.0.0:111 (Stream)
           0.0.0.0:111 (Datagram)
           [::]:111 (Stream)
           [::]:111 (Datagram)


4. Check any previously existing downloaded / installed RPMs (check yum cache)


yum install package-name / yum upgrade keeps downloaded packages via its operations inside its cache directory structures in /var/cache/yum/*.
Hence it is good idea to check what were the previously installed packages and their count.


[root@redhat: ~ ]# cd /var/cache/yum/x86_64/;
[root@redhat: ~ ]# find . -iname '*.rpm'|wc -l


5. List RPM repositories set on the server


 [root@redhat: ~ ]# yum repolist
Loaded plugins: fastestmirror, versionlock
Repodata is over 2 weeks old. Install yum-cron? Or run: yum makecache fast
Determining fastest mirrors
repo id                                                                                 repo name                                                                                                            status
!atos-ac/7/x86_64                                                                       Atos Repository                                                                                                       3,128
!base/7/x86_64                                                                          CentOS-7 – Base                                                                                                      10,019
!cr/7/x86_64                                                                            CentOS-7 – CR                                                                                                         2,686
!epel/x86_64                                                                            Extra Packages for Enterprise Linux 7 – x86_64                                                                          165
!extras/7/x86_64                                                                        CentOS-7 – Extras                                                                                                       435
!updates/7/x86_64                                                                       CentOS-7 – Updates                                                                                                    2,500


This step is mandatory to make sure you're upgrading to latest packages from the right repositories for more concretics check what is inside in confs /etc/yum.repos.d/ ,  /etc/yum.conf 
 

6. Clean up any old rpm yum cache packages


This step is again mandatory but a good to follow just to have some more clearness on what packages is our upgrade downloading (not to mix up the old upgrades / installs with our newest one).
For documentation purposes all deleted packages list if such is to be kept under /root/logs/yumclean-install*.out file

[root@redhat: ~ ]# yum clean all |tee /root/logs/yumcleanall-$(hostname)-$(date '+%Y-%m-%d_%H-%M-%S').out


7. List the upgradeable packages's latest repository provided versions


[root@redhat: ~ ]# yum check-update |tee /root/logs/yumcheckupdate-$(hostname)-$(date '+%Y-%m-%d_%H-%M-%S').out


Then to be aware how many packages we'll be updating:


[root@redhat: ~ ]#  yum check-update | wc -l


8. Apply the actual uplisted RPM packages to be upgraded


[root@redhat: ~ ]# yum update |tee /root/logs/yumupdate-$(hostname)-$(date '+%Y-%m-%d_%H-%M-%S').out


Again output is logged to /root/logs/yumcheckupate-*.out 


9. Monitor downloaded packages count real time


To make sure yum upgrade is not in some hanging state and just get some general idea in which state of the upgrade is it e.g. Download / Pre-Update / Install  / Upgrade/ Post-Update etc.
in mean time when yum upgrade is running to monitor,  how many packages has the yum upgrade downloaded from remote RPM set repositories:


[root@redhat: ~ ]#  watch "ls -al /var/cache/yum/x86_64/7Server/…OS-repository…/packages/|wc -l"


10. Run status script to get the status again


[root@redhat: ~ ]# sh /root/status.sh |tee /root/logs/status-before-$(hostname)-$(date '+%Y-%m-%d_%H-%M-%S').out


11. Add back versionlock for all RPM packs


Set all RPM packages installed on the RHEL / CentOS versionlock for all packages.


#==if needed
# yum versionlock \*


12. Get whether old software configuration is not messed up during the Package upgrade (Lookup the logs for .rpmsave and .rpmnew)


During the upgrade old RPM configuration is probably changed and yum did automatically save .rpmsave / .rpmnew saves of it thus it is a good idea to grep the prepared logs for any matches of this 2 strings :
 

[root@redhat: ~ ]#   grep -i ".rpm" /root/logs/yumupdate-server-host-2020-01-20_14-30-41.out
[root@redhat: ~ ]#  grep -i ".rpmsave" /root/logs/yumupdate-server-host-2020-01-20_14-30-41.out
[root@redhat: ~ ]#  grep -i ".rpmnew" /root/logs/yumupdate-server-host-2020-01-20_14-30-41.out


If above commands returns output usually it is fine if there is is .rpmnew output but, if you get grep output of .rpmsave it is a good idea to review the files compare with the original files that were .rpmsaved with the 
substituted config file and atune the differences with the changes manually made for some program functionality.

What are the .rpmsave / .rpmnew files ?
This files are coded files that got triggered by the RPM install / upgrade due to prewritten procedures on time of RPM build.


If a file was installed as part of a rpm, it is a config file (i.e. marked with the %config tag), you've edited the file afterwards and you now update the rpm then the new config file (from the newer rpm) will replace your old config file (i.e. become the active file).
The latter will be renamed with the .rpmsave suffix.

If a file was installed as part of a rpm, it is a noreplace-config file (i.e. marked with the %config(noreplace) tag), you've edited the file afterwards and you now update the rpm then your old config file will stay in place (i.e. stay active) and the new config file (from the newer rpm) will be copied to disk with the .rpmnew suffix.
See e.g. this table for all the details. 

In both cases you or some program has edited the config file(s) and that's why you see the .rpmsave / .rpmnew files after the upgrade because rpm will upgrade config files silently and without backup files if the local file is untouched.

After a system upgrade it is a good idea to scan your filesystem for these files and make sure that correct config files are active and maybe merge the new contents from the .rpmnew files into the production files. You can remove the .rpmsave and .rpmnew files when you're done.


If you need to get a list of all .rpmnew .rpmsave files on the server do:

[root@redhat: ~ ]#  find / -print | egrep "rpmnew$|rpmsave$


13. Reboot the system 

To check whether on next hang up or power outage the system will boot normally after the upgrade, reboot to test it.


you can :


[root@redhat: ~ ]#  reboot


either

[root@redhat: ~ ]#  shutdown -r now


or if on newer Linux with systemd in ues below systemctl reboot.target.

[root@redhat: ~ ]#  systemctl start reboot.target


14. Get again the system status with our status script after reboot

[root@redhat: ~ ]#  sh /root/status.sh |tee /root/logs/status-after-$(hostname)-$(date '+%Y-%m-%d_%H-%M-%S').out


15. Clean up any versionlocks if earlier set


[root@redhat: ~ ]# yum versionlock clear
[root@redhat: ~ ]# yum versionlock list


16. Check services and logs for problems


After the reboot Check closely all running services on system make sure every process / listening ports and services on the system are running fine, just like before the upgrade.
If the sytem had firewall,  check whether firewall rules are not broken, e.g. some NAT is not missing or anything earlier configured to automatically start via /etc/rc.local or some other
custom scripts were run and have done what was expected. 
Go through all the logs in /var/log that are most essential /var/log/boot.log , /var/log/messages … yum.log etc. that could reveal any issues after the boot. In case if running some application server or mail server check /var/log/mail.log or whenever it is configured to log.
If the system runs apache closely check the logs /var/log/httpd/error.log or php_errors.log for any strange errors that occured due to some issues caused by the newer installed packages.
Usually most of the cases all this should be flawless but a multiple check over your work is a stake for good results.
 

How to debug failing service in systemctl and add a new IP network alias in CentOS Linux

Wednesday, January 15th, 2020

linux-debug-failing-systemctl-systemd-service--add-new-IP-alias-network-cable

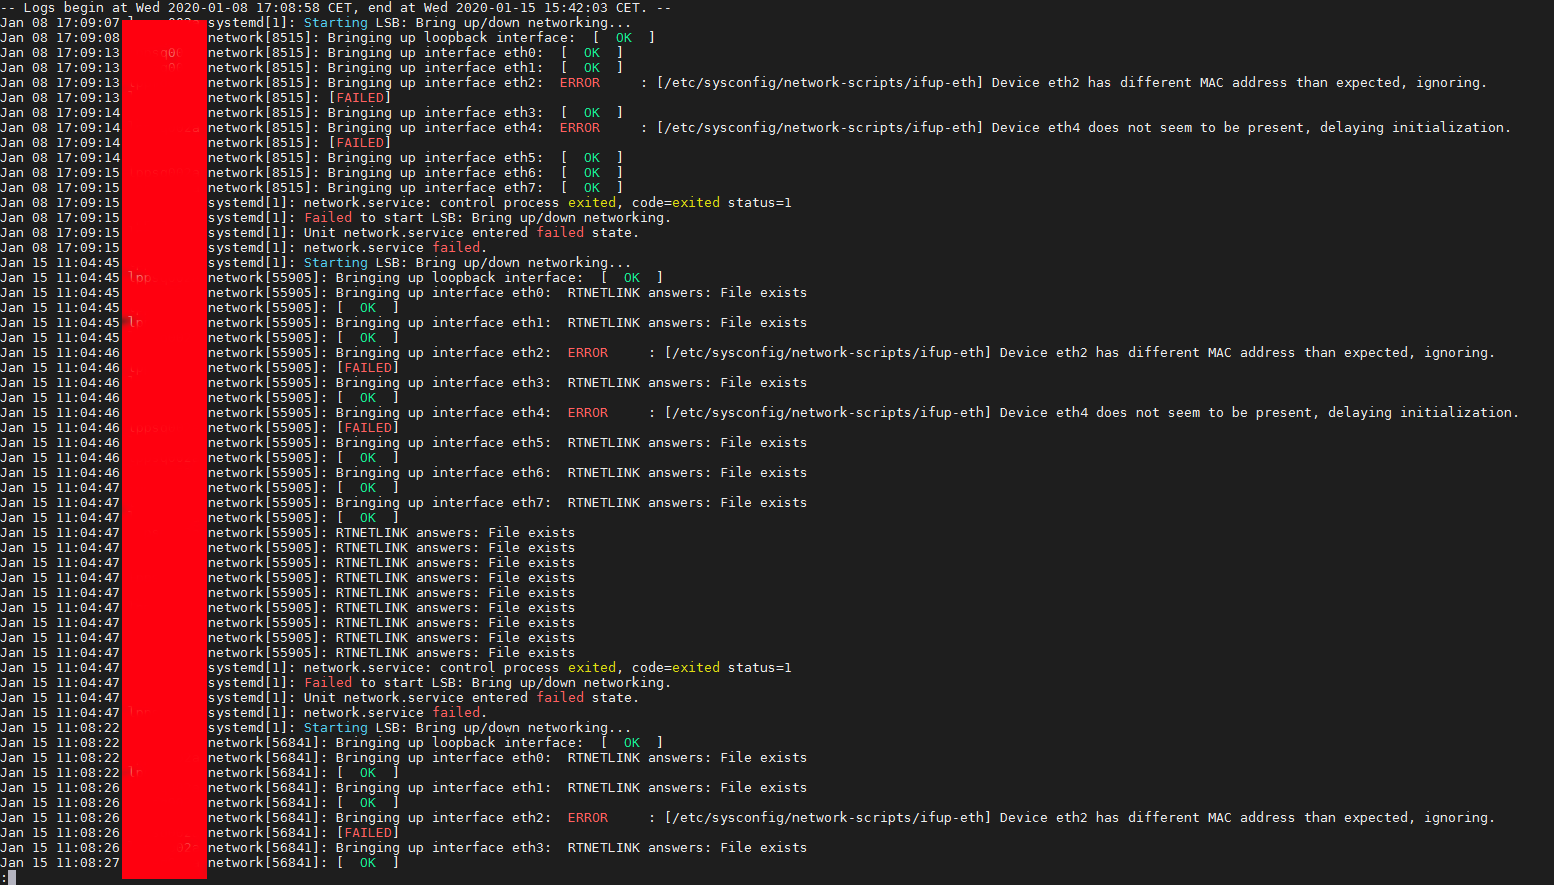
If you get some error with some service that is start / stopped via systemctl you might be pondering how to debug further why the service is not up then then you'll be in the situation I was today.
While on one configured server with 8 eth0 configured ethernet network interfaces the network service was reporting errors, when atempted to restart the RedHat way via:
 

service network restart


to further debug what the issue was as it was necessery I had to find a way how to debug systemctl so here is how:


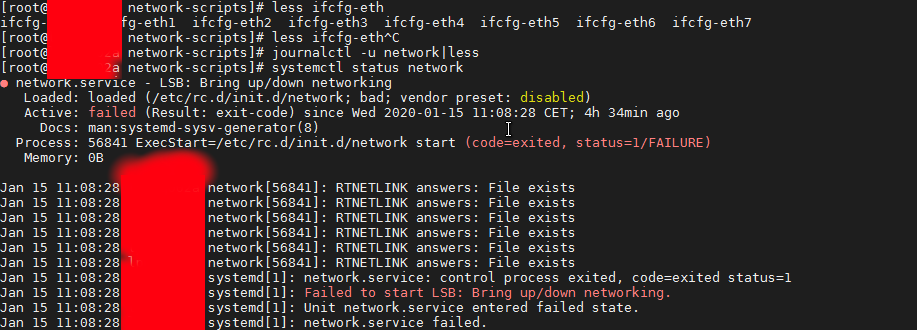
How to do a verbose messages status for sysctlct?


linux:~# systemctl status network

linux:~# systemctl status network


Another useful hint is to print out only log messages for the current boot, you can that with:

# journalctl -u service-name.service -b


if you don't want to have the less command like page separation ( paging ) use the –no-pager argument.


# journalctl -u network –no-pager

Jan 08 17:09:14 lppsq002a network[8515]: Bringing up interface eth5:  [  OK  ]

    Jan 08 17:09:15 lppsq002a network[8515]: Bringing up interface eth6:  [  OK  ]
    Jan 08 17:09:15 lppsq002a network[8515]: Bringing up interface eth7:  [  OK  ]
    Jan 08 17:09:15 lppsq002a systemd[1]: network.service: control process exited, code=exited status=1
    Jan 08 17:09:15 lppsq002a systemd[1]: Failed to start LSB: Bring up/down networking.
    Jan 08 17:09:15 lppsq002a systemd[1]: Unit network.service entered failed state.
    Jan 08 17:09:15 lppsq002a systemd[1]: network.service failed.
    Jan 15 11:04:45 lppsq002a systemd[1]: Starting LSB: Bring up/down networking…
    Jan 15 11:04:45 lppsq002a network[55905]: Bringing up loopback interface:  [  OK  ]
    Jan 15 11:04:45 lppsq002a network[55905]: Bringing up interface eth0:  RTNETLINK answers: File exists
    Jan 15 11:04:45 lppsq002a network[55905]: [  OK  ]
    Jan 15 11:04:45 lppsq002a network[55905]: Bringing up interface eth1:  RTNETLINK answers: File exists
    Jan 15 11:04:45 lppsq002a network[55905]: [  OK  ]
    Jan 15 11:04:46 lppsq002a network[55905]: Bringing up interface eth2:  ERROR     : [/etc/sysconfig/network-scripts/ifup-eth] Device eth2 has different MAC address than expected, ignoring.
    Jan 15 11:04:46 lppsq002a network[55905]: [FAILED]
    Jan 15 11:04:46 lppsq002a network[55905]: Bringing up interface eth3:  RTNETLINK answers: File exists
    Jan 15 11:04:46 lppsq002a network[55905]: [  OK  ]
    Jan 15 11:04:46 lppsq002a network[55905]: Bringing up interface eth4:  ERROR     : [/etc/sysconfig/network-scripts/ifup-eth] Device eth4 does not seem to be present, delaying initialization.
    Jan 15 11:04:46 lppsq002a network[55905]: [FAILED]
    Jan 15 11:04:46 lppsq002a network[55905]: Bringing up interface eth5:  RTNETLINK answers: File exists
    Jan 15 11:04:46 lppsq002a network[55905]: [  OK  ]
    Jan 15 11:04:46 lppsq002a network[55905]: Bringing up interface eth6:  RTNETLINK answers: File exists
    Jan 15 11:04:47 lppsq002a network[55905]: [  OK  ]
    Jan 15 11:04:47 lppsq002a network[55905]: Bringing up interface eth7:  RTNETLINK answers: File exists
    Jan 15 11:04:47 lppsq002a network[55905]: [  OK  ]
    Jan 15 11:04:47 lppsq002a network[55905]: RTNETLINK answers: File exists
    Jan 15 11:04:47 lppsq002a network[55905]: RTNETLINK answers: File exists
    Jan 15 11:04:47 lppsq002a network[55905]: RTNETLINK answers: File exists
    Jan 15 11:04:47 lppsq002a network[55905]: RTNETLINK answers: File exists
    Jan 15 11:04:47 lppsq002a network[55905]: RTNETLINK answers: File exists
    Jan 15 11:04:47 lppsq002a network[55905]: RTNETLINK answers: File exists
    Jan 15 11:04:47 lppsq002a network[55905]: RTNETLINK answers: File exists
    Jan 15 11:04:47 lppsq002a network[55905]: RTNETLINK answers: File exists
    Jan 15 11:04:47 lppsq002a network[55905]: RTNETLINK answers: File exists
    Jan 15 11:04:47 lppsq002a systemd[1]: network.service: control process exited, code=exited status=1
    Jan 15 11:04:47 lppsq002a systemd[1]: Failed to start LSB: Bring up/down networking.
    Jan 15 11:04:47 lppsq002a systemd[1]: Unit network.service entered failed state.
    Jan 15 11:04:47 lppsq002a systemd[1]: network.service failed.
    Jan 15 11:08:22 lppsq002a systemd[1]: Starting LSB: Bring up/down networking…
    Jan 15 11:08:22 lppsq002a network[56841]: Bringing up loopback interface:  [  OK  ]
    Jan 15 11:08:22 lppsq002a network[56841]: Bringing up interface eth0:  RTNETLINK answers: File exists
    Jan 15 11:08:22 lppsq002a network[56841]: [  OK  ]
    Jan 15 11:08:26 lppsq002a network[56841]: Bringing up interface eth1:  RTNETLINK answers: File exists
    Jan 15 11:08:26 lppsq002a network[56841]: [  OK  ]
    Jan 15 11:08:26 lppsq002a network[56841]: Bringing up interface eth2:  ERROR     : [/etc/sysconfig/network-scripts/ifup-eth] Device eth2 has different MAC address than expected, ignoring.
    Jan 15 11:08:26 lppsq002a network[56841]: [FAILED]
    Jan 15 11:08:26 lppsq002a network[56841]: Bringing up interface eth3:  RTNETLINK answers: File exists
    Jan 15 11:08:27 lppsq002a network[56841]: [  OK  ]


2020-01-15-15_42_11-root-server


Another useful thing debug arguments is the -xe to do:

# journalctl -xe –no-pager


  • -x (– catalog)
    Augment log lines with explanation texts from the message catalog.
    This will add explanatory help texts to log messages in the output
    where this is available.
  •  -e ( –pager-end )  Immediately jump to the end of the journal inside the implied pager
      tool.

2020-01-15-15_42_32-root-server

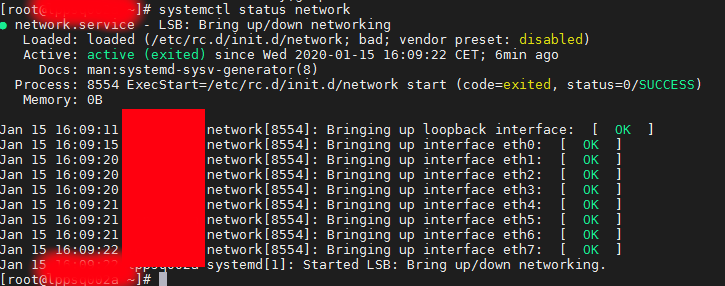
Finally after fixing the /etc/sysconfig/networking-scripts/* IP configuration issues I had all the 8 Ethernet interfaces to work as expected
 

# systemctl status network


2020-01-15-16_15_38-root-server


2. Adding a new IP alias to eth0 interface


Further on I had  to add an IP Alias on the CenOS via its networking configuration, this is done by editing /etc/sysconfig/network-scripts/ifcfg* files.
To create an IP alias for first lan interface eth0, I've had to created a new file named ifcfg-eth0:0
 

linux:~# cd /etc/sysconfig/network-scripts/
linux:~# vim ifcfg-eth0:0


with below content

NAME="eth0:0"
ONBOOT="yes"
BOOTPROTO="none"
IPADDR="10.50.10.5"
NETMASK="255.255.255.0"


Adding this IP address network alias works across all RPM based distributions and should work also on Fedora and Open SuSE as well as Suse Enterprise Linux.
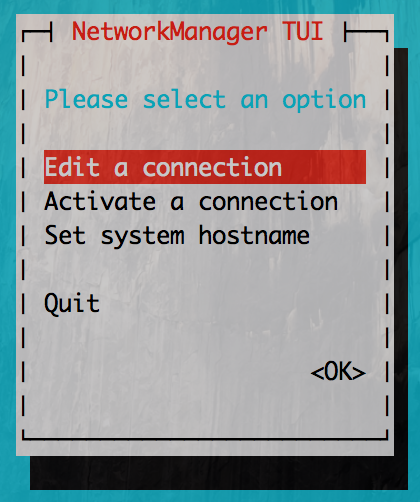
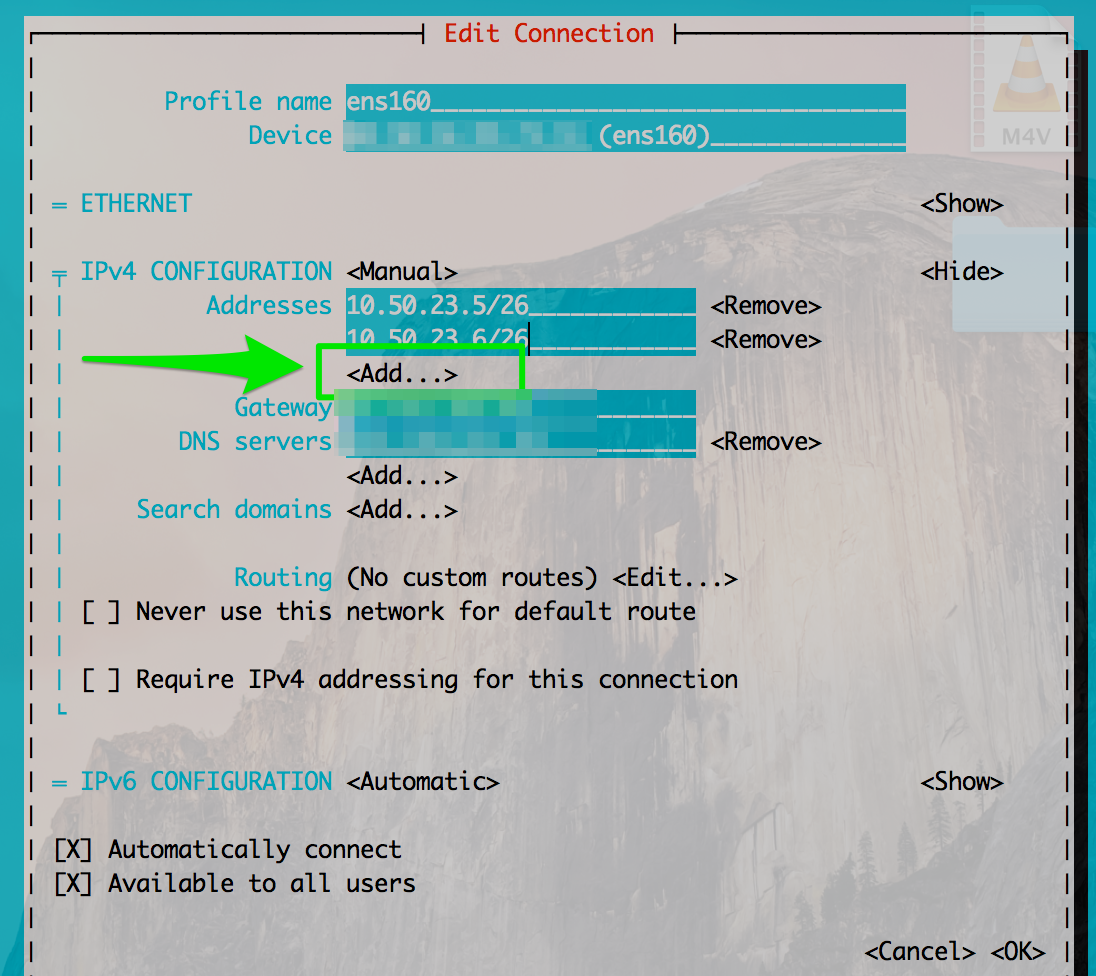
If you however prefer to use a text GUI and do it the CentOS server administration way you can use nmtui (Text User Interface for controlling NetworkManager). tool.
 

linux:~# nmtui


centos7_nmtui-ncurses-network-configuration-sysadmin-tool

nmtui_add_alias_interface-screenshot

Howto debug and remount NFS hangled filesystem on Linux

Monday, August 12th, 2019

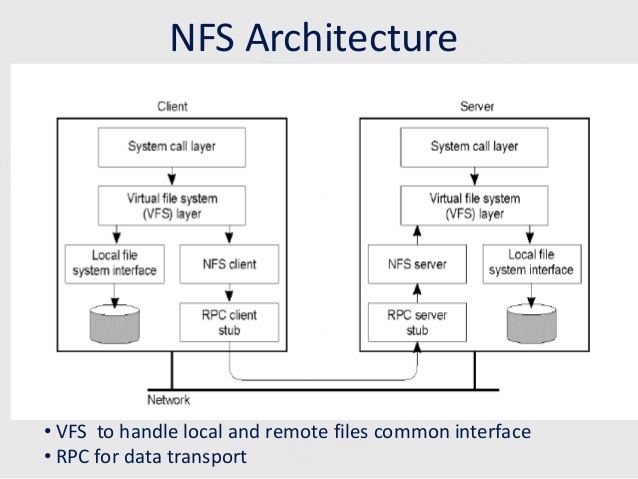
nfsnetwork-file-system-architecture-diagram

If you're using actively NFS remote storage attached to your Linux server it is very useful to get the number of dropped NFS connections and in that way to assure you don't have a remote NFS server issues or Network connectivity drops out due to broken network switch a Cisco hub or other network hop device that is routing the traffic from Source Host (SRC) to Destination Host (DST) thus, at perfect case if NFS storage and mounted Linux Network filesystem should be at (0) zero dropped connectios or their number should be low. Firewall connectivity between Source NFS client host and Destination NFS Server and mount should be there (set up fine) as well as proper permissions assigned on the server, as well as the DST NFS should be not experiencing I/O overheads as well as no DNS issues should be present (if NFS is not accessed directly via IP address).
In below article which is mostly for NFS novice admins is described shortly few of the nuances of working with NFS.
 

1. Check nfsstat and portmap for issues

One indicator that everything is fine with a configured NFS mount is the number of dropped NFS connections
or with a very low count of dropped connections, to check them if you happen to administer NFS

nfsstat


linux:~# nfsstat -o net
Server packet stats:
packets    udp        tcp        tcpconn
0          0          0          0  


nfsstat is useful if you have to debug why occasionally NFS mounts are getting unresponsive.

As NFS is so dependent upon portmap service for mapping the ports, one other point to check in case of Hanged NFSes is the portmap service whether it did not crashed due to some reason.


linux:~# service portmap status
portmap (pid 7428) is running…   [portmap service is started.]


linux:~# ps axu|grep -i rpcbind
_rpc       421  0.0  0.0   6824  3568 ?        Ss   10:30   0:00 /sbin/rpcbind -f -w


A useful commands to debug further rcp caused issues are:

On client side:


rpcdebug -m nfs -c


On server side:


rpcdebug -m nfsd -c


It might be also useful to check whether remote NFS permissions did not changed with the good old showmount cmd

linux:~# showmount -e rem_nfs_server_host


Also it is useful to check whether /etc/exports file was not modified somehow and whether the NFS did not hanged due to attempt of NFS daemon to reload the new configuration from there, another file to check while debugging is /etc/nfs.conf – are there group / permissions issues as well as the usual /var/log/messages and the kernel log with dmesg command for weird produced NFS client / server or network messages.

nfs-utils disabled serving NFS over UDP in version 2.2.1. Arch core updated to 2.3.1 on 21 Dec 2017 (skipping over 2.2.1.) If UDP stopped working then, add udp=y under [nfsd] in /etc/nfs.conf. Then restart nfs-server.service.

If the remote NFS server is running also Linux it is useful to check its /etc/default/nfs-kernel-server configuration

At some stall cases it might be also useful to remount the NFS (but as there might be a process on the Linux server) trying to read / write data from the remote NFS mounted FS it is a good idea to check (whether a process / service) on the server is not doing I/O operations on the NFS and if such is existing to kill the process in question with fuser
 

linux:~# fuser -k [mounted-filesystem]


2. Diagnose the problem interactively with htop


    Htop should be your first port of call. The most obvious symptom will be a maxed-out CPU.
    Press F2, and under "Display options", enable "Detailed CPU time". Press F1 for an explanation of the colours used in the CPU bars. In particular, is the CPU spending most of its time responding to IRQs, or in Wait-IO (wio)?
 

3. Get more extensive Mount info with mountstats


nfs-utils package contains mountstats command which is very useful in debugging further the issues identified

$ mountstats
Stats for example:/tank mounted on /tank:
  NFS mount options: rw,sync,vers=4.2,rsize=524288,wsize=524288,namlen=255,acregmin=3,acregmax=60,acdirmin=30,acdirmax=60,soft,proto=tcp,port=0,timeo=15,retrans=2,sec=sys,clientaddr=xx.yy.zz.tt,local_lock=none
  NFS server capabilities: caps=0xfbffdf,wtmult=512,dtsize=32768,bsize=0,namlen=255
  NFSv4 capability flags: bm0=0xfdffbfff,bm1=0x40f9be3e,bm2=0x803,acl=0x3,sessions,pnfs=notconfigured
  NFS security flavor: 1  pseudoflavor: 0


NFS byte counts:
  applications read 248542089 bytes via read(2)
  applications wrote 0 bytes via write(2)
  applications read 0 bytes via O_DIRECT read(2)
  applications wrote 0 bytes via O_DIRECT write(2)
  client read 171375125 bytes via NFS READ
  client wrote 0 bytes via NFS WRITE

RPC statistics:
  699 RPC requests sent, 699 RPC replies received (0 XIDs not found)
  average backlog queue length: 0

READ:
    338 ops (48%)
    avg bytes sent per op: 216    avg bytes received per op: 507131
    backlog wait: 0.005917     RTT: 548.736686     total execute time: 548.775148 (milliseconds)
GETATTR:
    115 ops (16%)
    avg bytes sent per op: 199    avg bytes received per op: 240
    backlog wait: 0.008696     RTT: 15.756522     total execute time: 15.843478 (milliseconds)
ACCESS:
    93 ops (13%)
    avg bytes sent per op: 203    avg bytes received per op: 168
    backlog wait: 0.010753     RTT: 2.967742     total execute time: 3.032258 (milliseconds)
LOOKUP:
    32 ops (4%)
    avg bytes sent per op: 220    avg bytes received per op: 274
    backlog wait: 0.000000     RTT: 3.906250     total execute time: 3.968750 (milliseconds)
OPEN_NOATTR:
    25 ops (3%)
    avg bytes sent per op: 268    avg bytes received per op: 350
    backlog wait: 0.000000     RTT: 2.320000     total execute time: 2.360000 (milliseconds)
CLOSE:
    24 ops (3%)
    avg bytes sent per op: 224    avg bytes received per op: 176
    backlog wait: 0.000000     RTT: 30.250000     total execute time: 30.291667 (milliseconds)
DELEGRETURN:
    23 ops (3%)
    avg bytes sent per op: 220    avg bytes received per op: 160
    backlog wait: 0.000000     RTT: 6.782609     total execute time: 6.826087 (milliseconds)
READDIR:
    4 ops (0%)
    avg bytes sent per op: 224    avg bytes received per op: 14372
    backlog wait: 0.000000     RTT: 198.000000     total execute time: 198.250000 (milliseconds)
SERVER_CAPS:
    2 ops (0%)
    avg bytes sent per op: 172    avg bytes received per op: 164
    backlog wait: 0.000000     RTT: 1.500000     total execute time: 1.500000 (milliseconds)
FSINFO:
    1 ops (0%)
    avg bytes sent per op: 172    avg bytes received per op: 164
    backlog wait: 0.000000     RTT: 2.000000     total execute time: 2.000000 (milliseconds)
PATHCONF:
    1 ops (0%)
    avg bytes sent per op: 164    avg bytes received per op: 116
    backlog wait: 0.000000     RTT: 1.000000     total execute time: 1.000000 (milliseconds)


nfs-utils disabled serving NFS over UDP in version 2.2.1. Arch core updated to 2.3.1 on 21 Dec 2017 (skipping over 2.2.1.) If UDP stopped working then, add udp=y under [nfsd] in /etc/nfs.conf. Then restart nfs-server.service.
 

4. Check for firewall issues
 

If all fails make sure you don't have any kind of firewall issues. Sometimes firewall changes on remote server or somewhere in the routing servers might lead to stalled NFS mounts.


To use properly NFS as you should know as a minimum you need to have opened as ports is Port 111 (TCP and UDP) and 2049 (TCP and UDP) on the NFS server (side) as well as any traffic inspection routers on the road from SRC (Linux client host) and NFS Storage destination DST server.

There are also ports for Cluster and client status (Port 1110 TCP for the former, and 1110 UDP for the latter) as well as a port for the NFS lock manager (Port 4045 TCP and UDP) but having this opened or not depends on how the NFS is configured. You can further determine which ports you need to allow depending on which services are needed cross-gateway.
 

5. How to Remount a Stalled unresponsive NFS filesystem mount


At many cases situation with remounting stalled NFS filesystem is not so easy but if you're lucky a standard mount and remount should do the trick.

Most simple way to remout the NFS (once you're sure this might not disrupt any service) – don't blame me if you break something is with:
 

umount -l /mnt/NFS_mnt_point
mount /mnt/NFS_mnt_point


Note that the lazy mount (-l) umount opt is provided here as very often this is the only way to unmount a stalled NFS mount.

Sometimes if you have a lot of NFS mounts and all are inacessible it is useful to remount all NFS mounts, if the remote NFS is responsive this should be possible with a simple for bash loop:

for P in $(mount | awk '/type nfs / {print $3;}'); do echo $P; echo "sudo umount $P && sudo mount $P" && echo "ok :)"; done


If you cd /mnt/NFS_mnt_point and try ls and you get

$ ls
.: Stale File Handle


You will need to unmount the FS with forceful mount flag

umount -f /mnt/NFS_mnt_point
 

Sum it up


In this article, I've shown you a few simple ways to debug what is wrong with a Stalled / Hanged NFS filesystem present on a NFS server mounted on a Linux client server.
Above was explained the common issues caused by NFS portmap (rpcbind) dependency, how to its status is fine, some further diagnosis with htop and mountstat was pointed. I've pointed the minimum amount of TCP / UDP ports 2049 and 111 that needs to be opened for the NFS communication to work and finally explained on how to remount a stalled NFS single or all attached mount on a NFS client to restore to normal operations.
As NFS is a whole ocean of things and the number of ways it is used are too extensive this article is just a general info useful for the NFS dummy admin for more robust configs read some good book on NFS such as Managing NFS and NIS, 2nd Edition – O'Reilly Media and for Kernel related NFS debugging make sure you check as a minimum ArchLinux's NFS troubleshooting guide and sourceforge's NFS Troubleshoting and Optimizing NFS Performance guides.