Posts Tagged ‘bottleneck’

What is inode and how to find out which directory is eating up all your filesystem inodes on Linux, Increase inode count on a ext3 ext4 and ufs filesystems

Tuesday, August 20th, 2019

what-is-inode-find-out-which-filesystem-or-directory-eating-up-all-your-system-inodes-linux_inode_diagram

If you're a system administrator of multiple Linux servers used for Web serving delivery / Mail server sysadmin, Database admin or any High amount of Drives Data Storage used for backup servers infra, Data Repository administrator such as Linux hosted Samba / CIFS shares, etc. or using some Linux Hosting Provider to host your website or any other UNIX like Infrastructure servers that demands a storage of high number of files under a Directory  you might end up with the common filesystem inode depletion issues ( Maximum Inode number for a filesystem is predefined, limited and depending on the filesystem configured size).

In case a directory stored files end up exceding the amount of possible addressable inodes could prevent any data to be further assiged and stored on the Filesystem.

When a device runs out of inodes, new files cannot be created on the device, even though there may be plenty free space available and the first time it happened to me very long time ago I was completely puzzled how this is possible as I was not aware of Inodes existence  …

Reaching maximum inodes number (e.g. inode depletion), often happens on Busy Mail servers (receivng tons of SPAM email messages) or Content Delivery Network (CDN – Website Image caching servers) which contain many small files on EXT3 or EXT4 Journalled filesystems. File systems (such as Btrfs, JFS or XFS) escape this limitation with extents or dynamic inode allocation, which can 'grow' the file system or increase the number of inodes.


Hence ending being out of inodes could cause various oddities on how stored data behaves or communicated to other connected microservices and could lead to random application disruptions and odd results costing you many hours of various debugging to find the root cause of inodes (index nodes) being out of order.

In below article, I will try to give an overall explanation on what is an I-Node on a filesystem, how inodes of FS unit could be seen, how to diagnose a possible inode poblem – e.g.  see the maximum amount of inodes available per filesystem and how to prepare (format) a new filesystem with incrsed set of maximum inodes.


What are filesystem i-nodes?


This is a data structure in a Unix-style file system that describes a file-system object such as a file or a directory.
The data structure described in the inodes might vary slightly depending on the filesystem but usually on EXT3 / EXT4 Linux filesystems each inode stores the index to block that contains attributes and disk block location(s) of the object's data.
– Yes for those who are not aware on how a filesystem is structured on *nix it does allocate all stored data in logical separeted structures called data blocks. Each file stored on a local filesystem has a file descriptor, there are virtual unit structures file tables and each of the inodes that are a reference number has a own data structure (inode table).

Inodes / "Index" are slightly unusual on file system structure that stored the access information of files as a flat array on the disk, with all the hierarchical directory information living aside from this as explained by Unix creator and pioneer- Dennis Ritchie (passed away few years ago).

what-is-inode-very-simplified-explanation-diagram-data

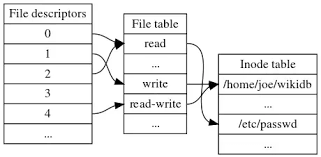
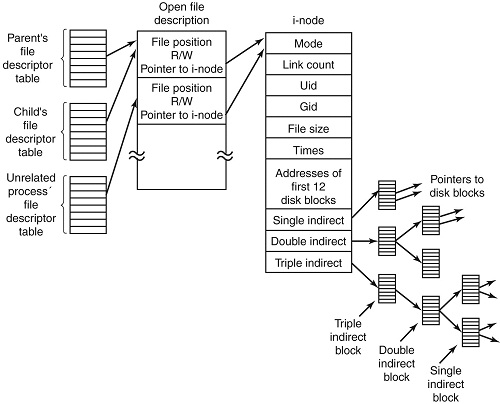
Simplified explanation on file descriptors, file table and inode, table on a common Linux filesystem

Here is another description on what is I-node, given by Ken Thompson (another Unix pioneer and father of Unix) and Denis Ritchie, described in their paper published in 1978:

"    As mentioned in Section 3.2 above, a directory entry contains only a name for the associated file and a pointer to the file itself. This pointer is an integer called the i-number (for index number) of the file. When the file is accessed, its i-number is used as an index into a system table (the i-list) stored in a known part of the device on which the directory resides. The entry found thereby (the file's i-node) contains the description of the file:…
    — The UNIX Time-Sharing System, The Bell System Technical Journal, 1978  "


What is typical content of inode and how I-nodes play with rest of Filesystem units?


The inode is just a reference index to a data block (unit) that contains File-system object attributes. It may include metadata information such as (times of last change, access, modification), as well as owner and permission data.


On a Linux / Unix filesystem, directories are lists of names assigned to inodes. A directory contains an entry for itself, its parent, and each of its children.

Structure-of-inode-table-on-Linux-Filesystem-diagram


Structure of inode table-on Linux Filesystem diagram (picture source GeeksForGeeks.org)

  • Information about files(data) are sometimes called metadata. So you can even say it in another way, "An inode is metadata of the data."
  •  Inode : Its a complex data-structure that contains all the necessary information to specify a file. It includes the memory layout of the file on disk, file permissions, access time, number of different links to the file etc.
  •  Global File table : It contains information that is global to the kernel e.g. the byte offset in the file where the user's next read/write will start and the access rights allowed to the opening process.
  • Process file descriptor table : maintained by the kernel, that in turn indexes into a system-wide table of files opened by all processes, called the file table .

The inode number indexes a table of inodes in a known location on the device. From the inode number, the kernel's file system driver can access the inode contents, including the location of the file – thus allowing access to the file.

  •     Inodes do not contain its hardlink names, only other file metadata.
  •     Unix directories are lists of association structures, each of which contains one filename and one inode number.
  •     The file system driver must search a directory looking for a particular filename and then convert the filename to the correct corresponding inode number.

The operating system kernel's in-memory representation of this data is called struct inode in Linux. Systems derived from BSD use the term vnode, with the v of vnode referring to the kernel's virtual file system layer.


But enough technical specifics, lets get into some practical experience on managing Filesystem inodes.
 

Listing inodes on a Fileystem


Lets say we wan to to list an inode number reference ID for the Linux kernel (files):


root@linux: # ls -i /boot/vmlinuz-*
 3055760 /boot/vmlinuz-3.2.0-4-amd64   26091901 /boot/vmlinuz-4.9.0-7-amd64
 3055719 /boot/vmlinuz-4.19.0-5-amd64  26095807 /boot/vmlinuz-4.9.0-8-amd64


To list an inode of all files in the kernel specific boot directory /boot:


root@linux: # ls -id /boot/
26091521 /boot/


Listing inodes for all files stored in a directory is also done by adding the -i ls command flag:

Note the the '-1' flag was added to to show files in 1 column without info for ownership permissions


root@linux:/# ls -1i /boot/
26091782 config-3.2.0-4-amd64
 3055716 config-4.19.0-5-amd64
26091900 config-4.9.0-7-amd64
26095806 config-4.9.0-8-amd64
26091525 grub/
 3055848 initrd.img-3.2.0-4-amd64
 3055644 initrd.img-4.19.0-5-amd64
26091902 initrd.img-4.9.0-7-amd64
 3055657 initrd.img-4.9.0-8-amd64
26091756 System.map-3.2.0-4-amd64
 3055703 System.map-4.19.0-5-amd64
26091899 System.map-4.9.0-7-amd64
26095805 System.map-4.9.0-8-amd64
 3055760 vmlinuz-3.2.0-4-amd64
 3055719 vmlinuz-4.19.0-5-amd64
26091901 vmlinuz-4.9.0-7-amd64
26095807 vmlinuz-4.9.0-8-amd64


To get more information about Linux directory, file, such as blocks used by file-unit, Last Access, Modify and Change times, current External Symbolic or Static links for filesystem object:
 

root@linux:/ # stat /etc/
  File: /etc/
  Size: 16384         Blocks: 32         IO Block: 4096   catalog
Device: 801h/2049d    Inode: 6365185     Links: 231
Access: (0755/drwxr-xr-x)  Uid: (    0/    root)   Gid: (    0/    root)
Access: 2019-08-20 06:29:39.946498435 +0300
Modify: 2019-08-14 13:53:51.382564330 +0300
Change: 2019-08-14 13:53:51.382564330 +0300
 Birth: –


Within a POSIX system (Linux-es) and *BSD are more or less such, a file has the following attributes[9] which may be retrieved by the stat system call:

   – Device ID (this identifies the device containing the file; that is, the scope of uniqueness of the serial number).
    File serial numbers.
    – The file mode which determines the file type and how the file's owner, its group, and others can access the file.
    – A link count telling how many hard links point to the inode.
    – The User ID of the file's owner.
    – The Group ID of the file.
    – The device ID of the file if it is a device file.
    – The size of the file in bytes.
    – Timestamps telling when the inode itself was last modified (ctime, inode change time), the file content last modified (mtime, modification time), and last accessed (atime, access time).
    – The preferred I/O block size.
    – The number of blocks allocated to this file.


Getting more extensive information on a mounted filesystem


Most Linuxes have the tune2fs installed by default (in debian Linux this is through e2fsprogs) package, with it one can get a very good indepth information on a mounted filesystem, lets say about the ( / ) root FS.
 

root@linux:~# tune2fs -l /dev/sda1
tune2fs 1.44.5 (15-Dec-2018)
Filesystem volume name:   <none>
Last mounted on:          /
Filesystem UUID:          abe6f5b9-42cb-48b6-ae0a-5dda350bc322
Filesystem magic number:  0xEF53
Filesystem revision #:    1 (dynamic)
Filesystem features:      has_journal ext_attr resize_inode dir_index filetype needs_recovery sparse_super large_file
Filesystem flags:         signed_directory_hash
Default mount options:    (none)
Filesystem state:         clean
Errors behavior:          Continue
Filesystem OS type:       Linux
Inode count:              30162944
Block count:              120648960
Reserved block count:     6032448
Free blocks:              13830683
Free inodes:              26575654
First block:              0
Block size:               4096
Fragment size:            4096
Reserved GDT blocks:      995
Blocks per group:         32768
Fragments per group:      32768
Inodes per group:         8192
Inode blocks per group:   512
Filesystem created:       Thu Sep  6 21:44:22 2012
Last mount time:          Sat Jul 20 11:33:38 2019
Last write time:          Sat Jul 20 11:33:28 2019
Mount count:              6
Maximum mount count:      22
Last checked:             Fri May 10 18:32:27 2019
Check interval:           15552000 (6 months)
Next check after:         Wed Nov  6 17:32:27 2019
Lifetime writes:          338 GB
Reserved blocks uid:      0 (user root)
Reserved blocks gid:      0 (group root)
First inode:              11
Inode size:              256
Required extra isize:     28
Desired extra isize:      28
Journal inode:            8
First orphan inode:       21554129
Default directory hash:   half_md4
Directory Hash Seed:      d54c5a90-bc2d-4e22-8889-568d3fd8d54f
Journal backup:           inode blocks


Important note to make here is file's inode number stays the same when it is moved to another directory on the same device, or when the disk is defragmented which may change its physical location. This also implies that completely conforming inode behavior is impossible to implement with many non-Unix file systems, such as FAT and its descendants, which don't have a way of storing this invariance when both a file's directory entry and its data are moved around. Also one inode could point to a file and a copy of the file or even a file and a symlink could point to the same inode, below is example:

$ ls -l -i /usr/bin/perl*
266327 -rwxr-xr-x 2 root root 10376 Mar 18  2013 /usr/bin/perl
266327 -rwxr-xr-x 2 root root 10376 Mar 18  2013 /usr/bin/perl5.14.2

A good to know is inodes are always unique values, so you can't have the same inode number duplicated. If a directory is damaged, only the names of the things are lost and the inodes become the so called “orphan”, e.g.  inodes without names but luckily this is recoverable. As the theory behind inodes is quite complicated and is complicated to explain here, I warmly recommend you read Ian Dallen's Unix / Linux / Filesystems – directories inodes hardlinks tutorial – which is among the best academic Tutorials explaining various specifics about inodes online.


How to Get inodes per mounted filesystem


root@linux:/home/hipo# df -i
Filesystem       Inodes  IUsed   IFree IUse% Mounted on


dev             2041439     481   2040958   1% /dev
tmpfs            2046359     976   2045383   1% /run
tmpfs            2046359       4   2046355   1% /dev/shm
tmpfs            2046359       6   2046353   1% /run/lock
tmpfs            2046359      17   2046342   1% /sys/fs/cgroup
/dev/sdb5        1221600    2562   1219038   1% /usr/var/lib/mysql
/dev/sdb6        6111232  747460   5363772  13% /var/www/htdocs
/dev/sdc1      122093568 3083005 119010563   3% /mnt/backups
tmpfs            2046359      13   2046346   1% /run/user/1000


As you see in above output Inodes reported for each of mounted filesystems has a specific number. In above output IFree on every mounted FS locally on Physical installed OS Linux is good.


Here is an example on how to recognize a depleted Inodes on a OpenXen Virtual Machine with attached Virtual Hard disks.

linux:~# df -i
Filesystem         Inodes     IUsed      IFree     IUse%   Mounted on
/dev/xvda         2080768    2080768     0      100%    /
tmpfs             92187      3          92184   1%     /lib/init/rw
varrun            92187      38          92149   1%    /var/run
varlock            92187      4          92183   1%    /var/lock
udev              92187     4404        87783   5%    /dev
tmpfs             92187       1         92186   1%    /dev/shm


Finding files with a certain inode


At some cases if you want to check all the copy files of a certain file that have the same i-node pointer it is useful to find them all by their shared inode this is possible with simple find (below example is for /usr/bin/perl binary sharing same inode as perl5.28.1:


ls -i /usr/bin/perl
23798851 /usr/bin/perl*


 find /usr/bin -inum 435308 -print
/usr/bin/perl5.28.1
/usr/bin/perl


Find directory that has a large number of files in it?

To get an overall number of inodes allocated by a certain directory, lets say /usr /var


root@linux:/var# du -s –inodes /usr /var
566931    /usr
56020    /var/

To get a list of directories use by inode for a directory with its main contained sub-directories sorted from 1 till highest number use:
 

du -s –inodes * 2>/dev/null |sort -g


Usually running out of inodes means there is a directory / fs mounts that has too many (small files) that are depleting the max count of possible inodes.

The most simple way to list directories and number of files in them on the server root directory is with a small bash shell loop like so:
 

for i in /*; do echo $i; find $i |wc -l; done


Another way to identify the exact directory that is most likely the bottleneck for the inode depletion in a sorted by file count, human readable form:
 

find / -xdev -printf '%h\n' | sort | uniq -c | sort -k 1 -n


This will dump a list of every directory on the root (/) filesystem prefixed with the number of files (and subdirectories) in that directory. Thus the directory with the largest number of files will be at the bottom.


The -xdev switch is used to instruct find to narrow it's search to only the device where you're initiating the search (any other sub-mounted NAS / NFS filesystems from a different device will be omited).


Print top 10 subdirectories with Highest Inode Usage


Once identifed the largest number of files directories that is perhaps the issue, to further get a list of Top subdirectories in it with highest amount of inodes used, use below cmd:


for i in `ls -1A`; do echo "`find $i | sort -u | wc -l` $i"; done | sort -rn | head -10


To list more than 10 of the top inodes used dirs change the head -10 to whatever num needed.

N.B. ! Be very cautious when running above 2 find commands on a very large filesystems as it will be I/O Excessive and in filesystems that has some failing blocks this could create further problems.

To omit putting a high I/O load on a production filesystem, it is possible to also use du + very complex regular expression:
 

cd /backup
du –inodes -S | sort -rh | sed -n         '1,50{/^.\{71\}/s/^\(.\{30\}\).*\(.\{37\}\)$/\1…\2/;p}'


Results returned are from top to bottom.


How to Increase the amount of Inodes count on a new created volume EXT4 filesystem

Some FS-es XFS, JFS do have an auto-increase inode feature in case if their is physical space, whether otheres such as reiserfs does not have inodes at all but still have a field reported when queried for errors. But the classical Linux ext3 / ext4 does not have a way to increase the inode number on a live filesystem. Instead the way to do it there is to prepare a brand new filesystem on a Disk / NAS / attached storage.

The number of inodes at format-time of the block storage can be as high as 4 billion inodes. Before you create the new FS, you have to partition the new the block storage as ext4 with lets say parted command (or nullify the content of an with dd to clean up any previous existing data on a volume if there was already existing data:
 

parted /dev/sda


dd if=/dev/zero of=/dev/path/to/volume


  then format it with this additional parameter:


mkfs.ext4 -N 3000000000 /dev/path/to/volume


Here in above example the newly created filesystem of EXT4 type will be created with 3 Billion inodes !, for setting a higher number on older ext3 filesystem max inode count mkfs.ext3 could be used instead.

Bear in mind that 3 Billion number is a too high number and if you plan to have some large number of files / directories / links structures just raise it up to your pre-planning requirements for FS. In most cases it will be rarely anyone that want to have this number higher than 1 or 2 billion of inodes.

On FreeBSD / NetBSD / OpenBSD setting inode maximum number for a UFS / UFS2 (which is current default FreeBSD FS), this could be done via newfs filesystem creation command after the disk has been labeled with disklabel:


freebsd# newfs -i 1024 /dev/ada0s1d


Increase the Max Count of Inodes for a /tmp filesystem


Sometimes on some machines it is necessery to have ability to store very high number of small files (e.g. have a very large number of inodes) on a temporary filesystem kept in memory. For example some web applications served by Web Server Apache + PHP, Nginx + Perl-FastCGI are written in a bad manner so they kept tons of temporary files in /tmp, leading to issues with exceeded amount of inodes.
If that's the case to temporary work around you can increase the count of Inodes for /tmp to a very high number like 2 billions using:


mount -o remount,nr_inodes=<bignum> /tmp

To make the change permanent on next boot if needed don't forget to put the nr_inodes=whatever_bignum as a mount option for the temporary fs to /etc/fstab

Eventually, if you face this issues it is best to immediately track which application produced the mess and ask the developer to fix his messed up programs architecture.


Conclusion


It was explained on the very common issue of having maximum amount of inodes on a filesystem depleted and the unpleasent consequences of inability to create new files on living FS.
Then a general overview was given on what is inode on a Linux / Unix filesystem, what is typical content of inode, how inode addressing is handled on a FS. Further was explained how to get basic information about available inodes on a filesystem, how to get a filename/s based on inode number (with find), the well known way to determine inode number of a directory or file (with ls) and get more extensive information on a FS on inodes with tune2fs.
Also was explained how to identify directories containing multitudes of files in order to determine a sub-directories that is consuming most of the inodes on a filesystem. Finally it was explained very raughly how to prepare an ext4 filesystem from scratch with predefined number to inodes to much higher than the usual defaults by mkfs.ext3 / mkfs.ext4 and *bsds newfs as well as how to raise the number of inodes of /tmp tmpfs temporary RAM filesystem.

Monitoring MySQL server queries and debunning performance (slow query) issues with native MySQL commands and with mtop, mytop

Thursday, May 10th, 2012

If you're a Linux server administrator running MySQL server, you need to troubleshoot performance and bottleneck issues with the SQL database every now and then. In this article, I will pinpoint few methods to debug basic issues with MySQL database servers.

1. Troubleshooting MySQL database queries with native SQL commands

a)One way to debug errors and get general statistics is by logging in with mysql cli and check the mysql server status:

# mysql -u root -p
mysql> SHOW STATUS;
+-----------------------------------+------------+
| Variable_name | Value |
+-----------------------------------+------------+
| Aborted_clients | 1132 |
| Aborted_connects | 58 |
| Binlog_cache_disk_use | 185 |
| Binlog_cache_use | 2542 |
| Bytes_received | 115 |
.....
.....
| Com_xa_start | 0 |
| Compression | OFF |
| Connections | 150000 |
| Created_tmp_disk_tables | 0 |
| Created_tmp_files | 221 |
| Created_tmp_tables | 1 |
| Delayed_errors | 0 |
| Delayed_insert_threads | 0 |
| Delayed_writes | 0 |
| Flush_commands | 1 |
.....
.....
| Handler_write | 132 |
| Innodb_page_size | 16384 |
| Innodb_pages_created | 6204 |
| Innodb_pages_read | 8859 |
| Innodb_pages_written | 21931 |
.....
.....
| Slave_running | OFF |
| Slow_launch_threads | 0 |
| Slow_queries | 0 |
| Sort_merge_passes | 0 |
| Sort_range | 0 |
| Sort_rows | 0 |
| Sort_scan | 0 |
| Table_locks_immediate | 4065218 |
| Table_locks_waited | 196 |
| Tc_log_max_pages_used | 0 |
| Tc_log_page_size | 0 |
| Tc_log_page_waits | 0 |
| Threads_cached | 51 |
| Threads_connected | 1 |
| Threads_created | 52 |
| Threads_running | 1 |
| Uptime | 334856 |
+-----------------------------------+------------+
225 rows in set (0.00 sec)

SHOW STATUS; command gives plenty of useful info, however it is not showing the exact list of queries currently processed by the SQL server. Therefore sometimes it is exactly a stucked (slow queries) execution, you need to debug in order to fix a lagging SQL. One way to track this slow queries is via enabling mysql slow-query.log. Anyways enabling the slow-query requires a MySQL server restart and some critical productive database servers are not so easy to restart and the SQL slow queries have to be tracked "on the fly" so to say.
Therefore, to check the exact (slow) queries processed by the SQL server (without restarting it), do
 

mysql> SHOW processlist;
+——+——+—————+——+———+——+————–+——————————————————————————————————+
| Id | User | Host | db | Command | Time | State | Info |
+——+——+—————+——+———+——+————–+——————————————————————————————————+
| 609 | root | localhost | blog | Sleep | 5 | | NULL |
| 1258 | root | localhost | NULL | Sleep | 85 | | NULL |
| 1308 | root | localhost | NULL | Query | 0 | NULL | show processlist |
| 1310 | blog | pcfreak:64033 | blog | Query | 0 | Sending data | SELECT comment_author, comment_author_url, comment_content, comment_post_ID, comment_ID, comment_aut |
+——+——+—————+——+———+——+————–+——————————————————————————————————+
4 rows in set (0.00 sec)
mysql>

SHOW processlist gives a good view on what is happening inside the SQL.

To get more complete information on SQL query threads use the full extra option:

mysql> SHOW full processlist;

This gives pretty full info on running threads, but unfortunately it is annoying to re-run the command again and again – constantly to press UP Arrow + Enter keys.

Hence it is useful to get the same command output, refresh periodically every few seconds. This is possible by running it through the watch command:

debian:~# watch "'show processlist' | mysql -u root -p'secret_password'"

watch will run SHOW processlist every 2 secs (this is default watch refresh time, for other timing use watch -n 1, watch -n 10 etc. etc.

The produced output will be similar to:

Every 2.0s: echo 'show processlist' | mysql -u root -p'secret_password' Thu May 10 17:24:19 2012

Id User Host db Command Time State Info
609 root localhost blog Sleep 3 NULL1258 root localhost NULL Sleep 649 NULL1542 blog pcfreak:64981 blog Query 0 Copying to tmp table \
SELECT p.ID, p.post_title, p.post_content,p.post_excerpt, p.pos
t_date, p.comment_count, count(t_r.o
1543 root localhost NULL Query 0 NULL show processlist

Though this "hack" is one of the possible ways to get some interactivity on what is happening inside SQL server databases and tables table. for administering hundred or thousand SQL servers running dozens of queries per second – monitor their behaviour few times aday using mytop or mtop is times easier.

Though, the names of the two tools are quite similar and I used to think both tools are one and the same, actually they're not but both are suitable for monitoring sql database execution in real time.

As a sys admin, I've used mytop and mtop, on almost each Linux server with MySQL server installed.
Both tools has helped me many times in debugging oddities with sql servers. Therefore my personal view is mytop and mtop should be along with the Linux sysadmin most useful command tools outfit, still I'm sure many administrators still haven't heard about this nice goodies.

1. Installing mytop on Debian, Ubuntu and other deb based GNU / Linux-es

mytop is available for easy install on Debian and across all debian / ubuntu and deb derivative distributions via apt.

Here is info obtained with apt-cache show

debian:~# apt-cache show mytop|grep -i description -A 3
Description: top like query monitor for MySQL
Mytop is a console-based tool for monitoring queries and the performance
of MySQL. It supports version 3.22.x, 3.23.x, 4.x and 5.x servers.
It's written in Perl and support connections using TCP/IP and UNIX sockets.

Installing the tool is done with the trivial:

debian:~# apt-get --yes install mytop
....

mtop used to be available for apt-get-ting in Debian Lenny and prior Debian releases but in Squeeze onwards, only mytop is included (probably due to some licensing incompitabilities with mtop??).

For those curious on how mtop / mytop works – both are perl scripts written to periodically connects to the SQL server and run commands similar to SHOW FULL PROCESSLIST;. Then, the output is parsed and displayed to the user.

Here how mytop running, looks like:

MyTOP showing queries running on Ubuntu 8.04 Linux - Debugging interactively top like MySQL

2. Installing mytop on RHEL and CentOS

By default in RHEL and CentOS and probably other RedHat based Linux-es, there is neither mtop nor mytop available in package repositories. Hence installing the tools on those is only available from 3rd parties. As of time of writting an rpm builds for RHEL and CentOS, as well as (universal rpm distros) src.rpm package is available on http://pkgs.repoforge.org/mytop/. For the sake of preservation – if in future those RPMs disappear, I made a mirror of mytop rpm's here

Mytop rpm builds depend on a package perl(Term::ReadKey), my attempt to install it on CentOS 5.6, returned following err:

[root@cenots ~]# rpm -ivh mytop-1.4-2.el5.rf.noarch.rpm
warning: mytop-1.4-2.el5.rf.noarch.rpm: Header V3 DSA signature: NOKEY, key ID 6b8d79e6
error: Failed dependencies:
perl(Term::ReadKey) is needed by mytop-1.4-2.el5.rf.noarch

The perl(Term::ReadKey package is not available in CentOS 5.6 and (probably other centos releases default repositories so I had to google perl(Term::ReadKey) I found it on http://rpm.pbone.net/ package repository, the exact url to the rpm dependency as of time of writting this post is:

ftp://ftp.pbone.net/mirror/yum.trixbox.org/centos/5/old/perl-Term-ReadKey-2.30-2.rf.i386.rpm

Quickest, way to install it is:

[root@centos ~]# rpm -ivh ftp://ftp.pbone.net/mirror/yum.trixbox.org/centos/5/old/perl-Term-ReadKey-2.30-2.rf.i386.rpmRetrieving ftp://ftp.pbone.net/mirror/yum.trixbox.org/centos/5/old/perl-Term-ReadKey-2.30-2.rf.i386.rpmPreparing... ########################################### [100%]
1:perl-Term-ReadKey ########################################### [100%]

This time mytop, install went fine:

[root@centos ~]# rpm -ivh mytop-1.4-2.el5.rf.noarch.rpm
warning: mytop-1.4-2.el5.rf.noarch.rpm: Header V3 DSA signature: NOKEY, key ID 6b8d79e6
Preparing... ########################################### [100%]
1:mytop ########################################### [100%]

To use it further, it is the usual syntax:

mytop -u username -p 'secret_password' -d database

CentOS Linux MyTOP MySQL query benchmark screenshot - vpopmail query

3. Installing mytop and mtop on FreeBSD and other BSDs

To debug the running SQL queries in a MySQL server running on FreeBSD, one could use both mytop and mtop – both are installable via ports:

a) To install mtop exec:

freebsd# cd /usr/ports/sysutils/mtop
freebsd# make install clean
....

b) To install mytop exec:

freebsd# cd /usr/ports/databases/mytop
freebsd# make install clean
....

I personally prefer to use mtop on FreeBSD, because once run it runs prompts the user to interactively type in the user/pass

freebsd# mtop

Then mtop prompts the user with "interactive" dialog screen to type in user and pass:

Mtop interactive type in username and password screenshot on FreeBSD 7.2

It is pretty annoying, same mtop like syntax don't show user/pass prompt:

freebsd# mytop
Cannot connect to MySQL server. Please check the:

* database you specified "test" (default is "test")
* username you specified "root" (default is "root")
* password you specified "" (default is "")
* hostname you specified "localhost" (default is "localhost")
* port you specified "3306" (default is 3306)
* socket you specified "" (default is "")
The options my be specified on the command-line or in a ~/.mytop
config file. See the manual (perldoc mytop) for details.
Here's the exact error from DBI. It might help you debug:
Unknown database 'test'

The correct syntax to run mytop instead is:

freebsd# mytop -u root -p 'secret_password' -d 'blog'

Or the longer more descriptive:

freebsd# mytop --user root --pass 'secret_password' --database 'blog'

By the way if you take a look at mytop's manual you will notice a tiny error in documentation, where the three options –user, –pass and –database are wrongly said to be used as -user, -pass, -database:

freebsd# mytop -user root -pass 'secret_password' -database 'blog'
Cannot connect to MySQL server. Please check the:

* database you specified "atabase" (default is "test")
* username you specified "ser" (default is "root")
* password you specified "ass" (default is "")
* hostname you specified "localhost" (default is "localhost")
* port you specified "3306" (default is 3306)
* socket you specified "" (default is "")a
...
Access denied for user 'ser'@'localhost' (using password: YES)

Actually it is interesting mytop, precededed historically mtop.
mtop was later written (probably based on mytop), to run on FreeBSD OS by a famous MySQL (IT) spec — Jeremy Zawodny .
Anyone who has to do frequent MySQL administration tasks, should already heard Zawodny's name.
For those who haven't, Jeremy used to be a head database administrators and developer in Yahoo! Inc. some few years ago.
His website contains plenty of interesting thoughts and writtings on MySQL server and database management
 

Httpwatch a must have web developer and web hosting sysadmin Firefox / Internet Explorer / IPad / IPhone add-on

Monday, December 16th, 2013


Today a colleague of mine referred me to a wonderful Mozilla Firefox (Windows / Mac) plugin called HttpWatch.

HttpWatch is an HTTP sniffer for IE, Firefox, iPhone & iPad
that provides new insights into how your website loads and performs.
The plugin is quite simple it shows you all requests from your Browser to remote server with plenty of Debug information (on the fly). You can see exactly the Commands sent over the HTTP protocol as well as returned request status responce from Web Server (i.e. 200, 300, 400). By knowing the status returned by webserver you can debug odd problems with website authentication as well as oddities caused by proxies you don't know about. Besides showing responce returned on web requests HttpWatch shows also hand-shake of session ID variables. This makes the plugin  precious for Web developers and System Administrators working in Web & Middleware (Linux / Windows based Web Hosting companies)  etc.

HttpWatch is also a must have plugin for anyone looking to optimize a website for speed or for fixingwebsite responce time bottleneck issues. The size of plugin is quite big as of time of writting about 18.2 Megabytes. HttpWatch comes with separate app installer like any other stand alone Windows application.  Unfortunately Httpwatch does not have a version for GNU / Linux. Linux users could use HTTPFox, Google Chrome Developer tools or
Firebug.

Once you have plugin installed to check what's happening with a website access in (Firefox) select Tools -> HttpWatch. You will get a bottom screen new window with deug info.

httpwatch debugging accessed website information - web browser tool to optimize your website

Here is list of some of the many things for which plugin is useful;

  • Records HTTP
  • Decrypts HTTPS Traffic
  • Integrates with Internet Explorer & Firefox
  • Supports the SPDY Protocol in Firefox
  • Standalone Log File Viewer
  • Summary of Recorded Traffic
  • Grouping of Requests by Page
  • Collect Log Files From Your Customers
  • Request Level Time Charts
  • Real-Time Page Level Time Charts
  • Page Events
  • Detects Potential Problems
  • Customizable Data Columns
  • Data Tips
  • Automation Support
  • Advanced Filtering
  • Millisecond Level Timing
  • HTTP Compression
  • Network Level Performance Data
  • Extended Cookie Information
  • Shows Interaction with Browser Cache
  • Raw HTTP Streams
  • Export Data to CSV, HAR and XML
  • Import HAR files
  • Customizable CSV Export
  • Keyboard Accelerators
  • Access to Cached and Downloaded Content
  • Accurately Records Requests and Responses
  • Automatic Recording and Saving

Finally HttpWatch is a plugin to have next to Yahoo's YSlow, FasterfoxFireBug and Firefox's Web Developer plugin

Tracking I/O hard disk server bottlenecks with iostat on GNU / Linux and FreeBSD

Tuesday, March 27th, 2012

Hard disk overhead tracking on Linux and FreeBSD with iostat

I've earlier wrote an article How to find which processes are causing hard disk i/o overhead on Linux there I explained very rawly few tools which can be used to benchmark hard disk read / write operations. My prior article accent was on iotop and dstat and it just mentioned of iostat. Therefore I've wrote this short article in attempt to explain a bit more thoroughfully on how iostat can be used to track problems with excessive server I/O read/writes.

Here is the command man page description;
iostatReport Central Processing Unit (CPU) statistics and input/output statistics for devices, partitions and network filesystems

I will further proceed with few words on how iostat can be installed on various Linux distros, then point at few most common scenarious of use and a short explanation on the meaning of each of the command outputs.

1. Installing iostat on Linux

iostat is a swiss army knife of finding a server hard disk bottlenecks. Though it is a must have tool in the admin outfut, most of Linux distributions will not have iostat installed by default.
To have it on your server, you will need to install sysstat package:

a) On Debian / Ubuntu and other Debian GNU / Linux derivatives to install sysstat:

debian:~# apt-get --yes install sysstat

b) On Fedora, CentOS, RHEL etc. install is with yum:

[root@centos ~]# yum -y install sysstat

c) On Slackware Linux sysstat package which contains iostat is installed by default. 

d) In FreeBSD, there is no need for installation of any external package as iostat is part of the BSD world (bundle commands).
I should mention bsd iostat and Linux's iostat commands are not the same and hence there use to track down hard disk bottlenecks differs a bit, however the general logic of use is very similar as with most tools in BSD and Linux.

2. Checking a server hard disk for i/o disk bottlenecks on G* / Linux

Once having the sysstat installed on G* / Linux systems, the iostat command will be added in /usr/bin/iostat
a) To check what is the hard disk read writes per second (in megabytes) use:

debian:~# /usr/bin/iostat -m
Linux 2.6.32-5-amd64 (debian) 03/27/2012 _x86_64_ (8 CPU)
avg-cpu: %user %nice %system %iowait %steal %idle
15.34 0.36 2.76 2.66 0.00 78.88
Device: tps MB_read/s MB_wrtn/s MB_read MB_wrtn
sda 63.89 0.48 8.20 6730223 115541235
sdb 64.12 0.44 8.23 6244683 116039483
md0 2118.70 0.22 8.19 3041643 115528074

In the above output the server, where I issue the command is using sda and sdb configured in software RAID 1 array visible in the output as (md0)

The output of iostat should already be easily to read, for anyone who didn't used the tool here is a few lines explanation of the columns:

The %user 15.34 meaning is that 15.34 out of 100% possible i/o load is generad by system level read/write operations.
%nice – >Show the percentage of CPU utilization that occurred while executing at the user level with nice priority.
%iowait – just like the top command idle it shows the idle time when the system didn't have an outstanding disk I/O requests.
%steal – show percentage in time spent in time wait of CPU or virtual CPUs to service another virtual processor (high numbers of disk is sure sign for i/o problem).
%idle – almost the same as meaning to %iowait
tps – HDD transactions per second
MB_read/s (column) – shows the actual Disk reads in Mbytes at the time of issuing iostat
MB_wrtn/s – displays the writes p/s at the time of iostat invocation
MB_read – shows the hard disk read operations in megabytes, since the server boot 'till moment of invocation of iostat
MB_wrtn – gives the number of Megabytes written on HDD since the last server boot filesystem mount

The reason why the Read / Write values for sda and sdb are similar in this example output is because my disks are configured in software RAID1 (mirror)

The above iostat output reveals in my specific case the server is experiencing mostly Disk writes (observable in the high MB_wrtn/s 8.19 md0 in the above sample output).

It also reveals, the I/O reads experienced on that server hard disk are mostly generated as a system (user level load) – see (%user 15.34 and md0 2118.70).

For all those not familiar with system also called user / level load, this is all kind of load which is generated by running programs on the server – (any kind of load not generated by the Linux kernel or loaded kernel modules).

b) To periodically keep an eye on HDD i/o operations with iostat, there are two ways:

– Use watch in conjunction with iostat;

[root@centos ~]# watch "/usr/bin/iostat -m"
Every 2.0s: iostat -m Tue Mar 27 11:00:30 2012
Linux 2.6.32-5-amd64 (centos) 03/27/2012 _x86_64_ (8 CPU)
avg-cpu: %user %nice %system %iowait %steal %idle
15.34 0.36 2.76 2.66 0.00 78.88
Device: tps MB_read/s MB_wrtn/s MB_read MB_wrtn
sda 63.89 0.48 8.20 6730255 115574152
sdb 64.12 0.44 8.23 6244718 116072400
md0 2118.94 0.22 8.20 3041710 115560990
Device: tps MB_read/s MB_wrtn/s MB_read MB_wrtn
sda 55.00 0.01 25.75 0 51
sdb 52.50 0.00 24.75 0 49
md0 34661.00 0.01 135.38 0 270

Even though watch use and -d might appear like identical, they're not watch does refresh the screen, executing instruction similar to the clear command which clears screen on every 2 seconds, so the output looks like the top command refresh, while passing the -d 2 will output the iostat command output on every 2 secs in a row so all the data is visualized on the screen. Hence -d 2 in cases, where more thorough debug is necessery is better. However for a quick routine view watch + iostat is great too.

c) Outputting extra information for HDD input/output operations;

root@debian:~# iostat -x
Linux 2.6.32-5-amd64 (debian) 03/27/2012 _x86_64_ (8 CPU)
avg-cpu: %user %nice %system %iowait %steal %idle
15.34 0.36 2.76 2.66 0.00 78.88
Device: rrqm/s wrqm/s r/s w/s rsec/s wsec/s avgrq-sz avgqu-sz await svctm %util
sda 4.22 2047.33 12.01 51.88 977.44 16785.96 278.03 0.28 4.35 3.87 24.72
sdb 3.80 2047.61 11.97 52.15 906.93 16858.32 277.05 0.03 5.25 3.87 24.84
md0 0.00 0.00 20.72 2098.28 441.75 16784.05 8.13 0.00 0.00 0.00 0.00

This command will output extended useful Hard Disk info like;
r/s – number of read requests issued per second
w/s – number of write requests issued per second
rsec/s – numbers of sector reads per second
b>wsec/s – number of sectors wrote per second
etc. etc.

Most of ppl will never need to use this, but it is good to know it exists.

3. Tracking read / write (i/o) hard disk bottlenecks on FreeBSD

BSD's iostat is a bit different in terms of output and arguments.

a) Here is most basic use:

freebsd# /usr/sbin/iostat
tty ad0 cpu
tin tout KB/t tps MB/s us ni sy in id
1 561 45.18 44 1.95 14 0 5 0 82

b) Periodic watch of hdd i/o operations;

freebsd# iostat -c 10
tty ad0 cpu
tin tout KB/t tps MB/s us ni sy in id
1 562 45.19 44 1.95 14 0 5 0 82
0 307 51.96 113 5.73 44 0 24 0 32
0 234 58.12 98 5.56 16 0 7 0 77
0 43 0.00 0 0.00 1 0 0 0 99
0 485 0.00 0 0.00 2 0 0 0 98
0 43 0.00 0 0.00 0 0 1 0 99
0 43 0.00 0 0.00 0 0 0 0 100
...

As you see in the output, there is information like in the columns tty, tin, tout which is a bit hard to comprehend.
Thanksfully the tool has an option to print out only more essential i/o information:

freebsd# iostat -d -c 10
ad0
KB/t tps MB/s
45.19 44 1.95
58.12 97 5.52
54.81 108 5.78
0.00 0 0.00
0.00 0 0.00
0.00 0 0.00
20.48 25 0.50

The output info is quite self-explanatory.

Displaying a number of iostat values for hard disk reads can be also achieved by omitting -c option with:

freebsd# iostat -d 1 10
...

Tracking a specific hard disk partiotion with iostat is done with:

freebsd# iostat -n /dev/ad0s1a
tty cpu
tin tout us ni sy in id
1 577 14 0 5 0 81
c) Getting Hard disk read/write information with gstat

gstat is a FreeBSD tool to print statistics for GEOM disks. Its default behaviour is to refresh the screen in a similar fashion like top command, so its great for people who would like to periodically check all attached system hard disk and storage devices:

freebsd# gstat
dT: 1.002s w: 1.000s
L(q) ops/s r/s kBps ms/r w/s kBps ms/w %busy Name
0 10 0 0 0.0 10 260 2.6 15.6| ad0
0 10 0 0 0.0 10 260 2.6 11.4| ad0s1
0 10 0 0 0.0 10 260 2.8 12.5| ad0s1a
0 0 0 0 0.0 0 0 0.0 20.0| ad0s1b
0 0 0 0 0.0 0 0 0.0 0.0| ad0s1c
0 0 0 0 0.0 0 0 0.0 0.0| ad0s1d
0 0 0 0 0.0 0 0 0.0 0.0| ad0s1e
0 0 0 0 0.0 0 0 0.0 0.0| acd0

It even has colors if your tty supports colors 🙂

Another useful tool in debugging the culprit of excessive hdd I/O operations is procstat command:

Here is a sample procstat run to track (httpd) one of my processes imposing i/o hdd load:

freebsd# procstat -f 50404
PID COMM FD T V FLAGS REF OFFSET PRO NAME
50404 httpd cwd v d -------- - - - /
50404 httpd root v d -------- - - - /
50404 httpd 0 v c r------- 56 0 - -
50404 httpd 1 v c -w------ 56 0 - -
50404 httpd 2 v r -wa----- 56 75581 - /var/log/httpd-error.log
50404 httpd 3 s - rw------ 105 0 TCP ::.80 ::.0
50404 httpd 4 p - rw---n-- 56 0 - -
50404 httpd 5 p - rw------ 56 0 - -
50404 httpd 6 v r -wa----- 56 25161132 - /var/log/httpd-access.log
50404 httpd 7 v r rw------ 56 0 - /tmp/apr8QUOUW
50404 httpd 8 v r -w------ 56 0 - /var/run/accept.lock.49588
50404 httpd 9 v r -w------ 1 0 - /var/run/accept.lock.49588
50404 httpd 10 v r -w------ 1 0 - /tmp/apr8QUOUW
50404 httpd 11 ? - -------- 2 0 - -

Btw fstat is sometimes helpful in identifying the number of open files and trying to estimate which ones are putting the hdd load.
Hope this info helps someone. If you know better ways to track hdd excessive loads on Linux / BSD pls share 'em pls.
 

swap_pager_getswapspace: failed, MySQL troubles on FreeBSD 7.2 cause and solution

Tuesday, May 3rd, 2011

Every now and then my FreeBSD router dmesg ( /var/log/dmesg.today ) logs, gets filled with error messages like:

pid 86369 (httpd), uid 80, was killed: out of swap space
swap_pager_getswapspace(14): failed
swap_pager_getswapspace(16): failed
swap_pager_getswapspace(11): failed
swap_pager_getswapspace(12): failed
swap_pager_getswapspace(16): failed
swap_pager_getswapspace(14): failed
swap_pager_getswapspace(16): failed
swap_pager_getswapspace(8): failed

Using swapinfo during the swap_pager_getswapspace(16): failed messages were logged in, I figured out that definitely the swap memory over-use is the bottleneck for the troubles, to find this I used the command:

freebsd# swapinfo
Device 1K-blocks Used Avail Capacity Type
/dev/ad0s1b 49712 45920 3792 92% Interleaved

After some investigation, I’ve figured out that the MySQL server is causing the kernel exceeded swap troubles.

My current MySQL server version is installed from the ports tree, whether I’m using the bsd port /usr/ports/databases/mysql51-server/ and it appears to work just fine.

However I have noticed that the mysql-server is missing a my.cnf file!, which means the mysql server is running under a mode with some kind of default configurations.

Strangely in the system process list it appeared it is using a default my.cnf file located in /var/db/mysql/my.cnf

Below you see the paste from the ps command:

ps axuww freebsd# ps axuww | grep -i my.cnf | grep -v grep
mysql 7557 0.0 0.1 3464 1268 p1 I 12:03PM 0:00.01 /bin/sh /usr/local/bin/mysqld_safe --defaults-extra-file=/var/db/mysql/my.cnf --user=mysql --datadir=/var/db/mysql --pid-file=/var/db/mysql/pcfreak.pidmysql 7589 0.0 5.1 93284 52852 p1 I 12:03PM 0:59.01 /usr/local/libexec/mysqld --defaults-extra-file=/var/db/mysql/my.cnf --basedir=/usr/local --datadir=/var/db/mysql --user=mysql --pid-file=/var/db/mysql/pcfreak.pid --port=3306 --socket=/tmp/mysql.sock

Nevertheless it appeared the sql server is running the file /var/db/mysql/my.cnf conf was not existing! This was really weird for me as I’m used to have the default my.cnf from my previous experience with Linux servers!

Thus the next logical thing I did was to create my.cnf conf file in order to be able to have a proper limiting configuration for the sql server.

The FreeBSD my.cnf skele files are found in /usr/local/share/mysql/, here are the 4 files one can use as a starting basis for further configuration of the mysql-server.

freebsd# ls -al /usr/local/share/mysql/my-*.cnf
-r--r--r-- 1 root wheel 4948 Aug 12 2009 /usr/local/share/mysql/my-huge.cnf
-r--r--r-- 1 root wheel 20949 Aug 12 2009 /usr/local/share/mysql/my-innodb-heavy-4G.cnf
-r--r--r-- 1 root wheel 4924 Aug 12 2009 /usr/local/share/mysql/my-large.cnf
-r--r--r-- 1 root wheel 4931 Aug 12 2009 /usr/local/share/mysql/my-medium.cnf
-r--r--r-- 1 root wheel 2502 Aug 12 2009 /usr/local/share/mysql/my-small.cnf

I have chosen to use the my-medium.cnf as a skele to tune up, as my server is not high iron one e.g. the host I run the mysql is a (simple dual core 1.2Ghz system).

Further on I copied the /usr/local/share/mysql/my-medium.cnf to /var/db/mysql/my.cnf e.g.:

freebsd# cp -rpf /usr/local/share/mysql/my-medium.cnf /var/db/mysql/my.cnf

As a next step to properly tune up the default values of the newly copied my.cnf to my specific server I used the Tuning-Primer MySQL tuning script

Using tuning-primer.sh is really easy as all I did is download, launch it and follow the script suggestions to correct some of the values already in my.cnf

I have finally ended up with the following my.cnf after using tuning-primer.sh to optimize mysql server to work with my bsd host

Now I really hope the shitty swap_pager_getswapspace: failed errors would not haunt me once again by crashing my server and causing mem overheads.

Still I wonder why the port developer Alex Dupre – ale@FreeBSD.org choose not to provide the default mysql51-server conf with some kind of my.cnf file? I hope he had a good reason.

How to find out which processes are causing a hard disk I/O overhead in GNU/Linux

Wednesday, September 28th, 2011

iotop monitor hard disk io bottlenecks linux
To find out which programs are causing the most read/write overhead on a Linux server one can use iotop

Here is the description of iotop – simple top-like I/O monitor, taken from its manpage.

iotop does precisely the same as the classic linux top but for hard disk IN/OUT operations.

To check the overhead caused by some daemon on the system or some random processes launching iotop without any arguments is enough;

debian:~# iotop

The main overview of iostat statistics, are the:

Total DISK READ: xx.xx MB/s | Total DISK WRITE: xx.xx K/s
If launching iotop, shows a huge numbers and the server is facing performance drop downs, its a symptom for hdd i/o overheads.
iotop is available for Debian and Ubuntu as a standard package part of the distros repositories. On RHEL based Linuxes unfortunately, its not available as RPM.

While talking about keeping an eye on hard disk utilization and disk i/o’s as bottleneck and a possible pitfall to cause a server performance down, it’s worthy to mention about another really great tool, which I use on every single server I administrate. For all those unfamiliar I’m talking about dstat

dstat is a – versatile tool for generating system resource statistics as the description on top of the manual states. dstat is great for people who want to have iostat, vmstat and ifstat in one single program.
dstat is nowdays available on most Linux distributions ready to be installed from the respective distro package manager. I’ve used it and I can confirm tt is installable via a deb/rpm package on Fedora, CentOS, Debian and Ubuntu linuces.

Here is how the tool in action looks like:

dstat Linux hdd load stats screenshot

The most interesting things from all the dstat cmd output are read, writ and recv, send , they give a good general overview on hard drive performance and if tracked can reveal if the hdd disk/writes are a bottleneck to create server performance issues.
Another handy tool in tracking hdd i/o problems is iostat its a tool however more suitable for the hard core admins as the tool statistics output is not easily readable.

In case if you need to periodically grasp data about disks read/write operations you will definitely want to look at collectl i/o benchmarking tool .Unfortunately collect is not included as a packaget for most linux distributions except in Fedora. Besides its capabilities to report on servers disk usage, collect is also capable to show brief stats on cpu, network.

Collectl looks really promosing and even seems to be in active development the latest tool release is from May 2011. It even supports NVidia’s GPU monitoring 😉 In short what collectl does is very similar to sysstat which by the way also has some possibilities to track disk reads in time.  collectl’s website praises the tool, much and says that in most machines the extra load the tool would add to a system to generate reports on cpu, disk and disk io is < 0.1%.  I couldn’t find any data online on how much sysstat (sar) extra loads a system. It will be interesting if some of someone concluded some testing and can tell which of the two puts less load on a system.