Posts Tagged ‘article’

Debugging routing and network issues on Linux common approaches. A step by step guide to find out why routing or network service fails

Thursday, November 30th, 2023

For system administrators having a Network issue is among the Hell-ish stuff that can happen every now and then. That is especially true in Heterogenous / Hybrid and complicated Network topologies (with missing well crafted documentation), that were build without an initial overview "on the fly".
Such a networking connectivity or routing issues are faced by every novice, mid or even expert system administrators as the Company's Network IT environments are becoming more and more complicated day by day.

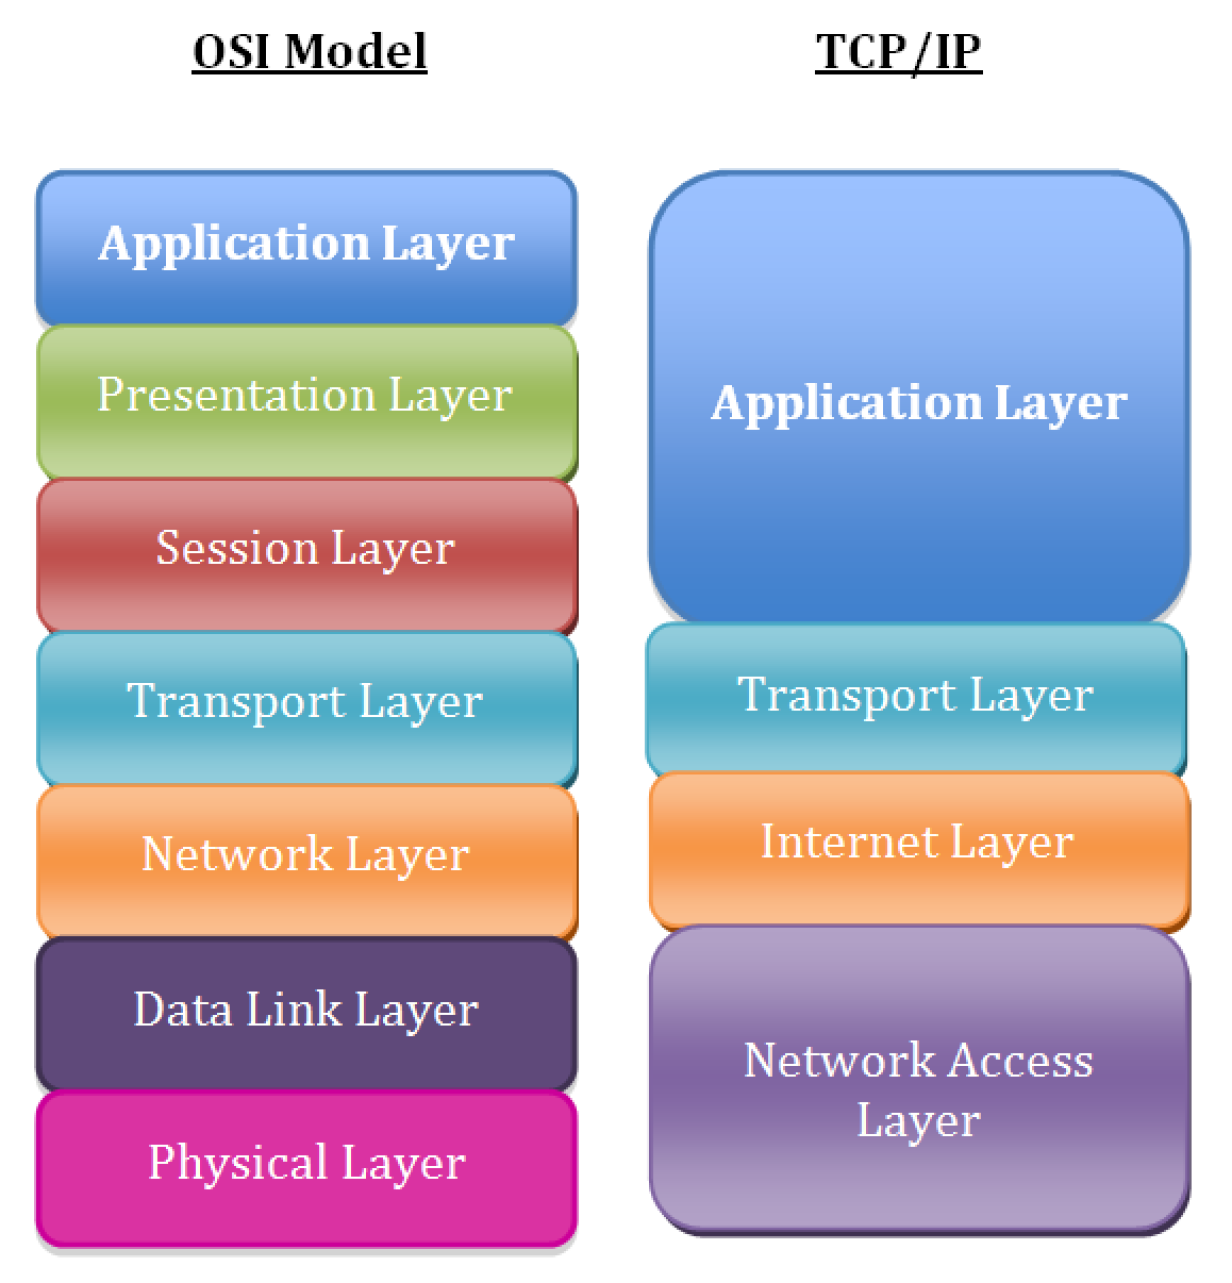
When the "Disaster" of being unable to connect two servers or at times  home laptops / PCs to see each other even though on the Physical layer / Transport Layer (Hardware such as external Switches / Routers / Repeaters / Cabling etc.) is Present machines are connected and everything on the 1 Physical Layer from OSI layears is present happens, then it is time to Debug it with some software tools and methods.

To each operating system the tools and methods to test networking connection and routings is a bit different but generally speaking most concepts are pretty much the same across different types of operating systems (Linux ditros / OpenBSD / FreeBSD / Mac OS / Android / iOS / HP-UX / IBM AIX / DOS / Windows etc.).

Debugging network issues across separate operating systems has its variations but in this specific (ideas) are much close to this article. As the goal at that guide will be to point out how to debug network issues on Linux, in future if I have the time or need to debug other OS-es from Linux, I'll try to put an article on how to debug Network issues on Windows when have some time to do it.

Consider to look for the issue following the basic TCP / IP OSI Level model, every system administrator should have idea about it already, it is part of most basic networking courses such as Cisco's CCNA

TCPIP_OSI_model-networking-levels

1. Check what is the Link status of the Interface with ethtool
 

root@freak:~# ethtool eno1
Settings for eno1:
    Supported ports: [ TP ]
    Supported link modes:   10baseT/Half 10baseT/Full
                            100baseT/Half 100baseT/Full
                            1000baseT/Full
    Supported pause frame use: Symmetric
    Supports auto-negotiation: Yes
    Supported FEC modes: Not reported
    Advertised link modes:  10baseT/Half 10baseT/Full
                            100baseT/Half 100baseT/Full
                            1000baseT/Full
    Advertised pause frame use: Symmetric
    Advertised auto-negotiation: Yes
    Advertised FEC modes: Not reported
    Speed: 100Mb/s
    Duplex: Full
    Auto-negotiation: on
    Port: Twisted Pair
    PHYAD: 1
    Transceiver: internal
    MDI-X: on (auto)
    Supports Wake-on: pumbg
    Wake-on: g
        Current message level: 0x00000007 (7)
                               drv probe link
    Link detected: yes


root@freak:~# ethtool eno2
Settings for eno2:
    Supported ports: [ TP ]
    Supported link modes:   10baseT/Half 10baseT/Full
                            100baseT/Half 100baseT/Full
                            1000baseT/Full
    Supported pause frame use: Symmetric
    Supports auto-negotiation: Yes
    Supported FEC modes: Not reported
    Advertised link modes:  10baseT/Half 10baseT/Full
                            100baseT/Half 100baseT/Full
                            1000baseT/Full
    Advertised pause frame use: Symmetric
    Advertised auto-negotiation: Yes
    Advertised FEC modes: Not reported
    Speed: 1000Mb/s
    Duplex: Full
    Auto-negotiation: on
    Port: Twisted Pair
    PHYAD: 1
    Transceiver: internal
    MDI-X: on (auto)
    Supports Wake-on: pumbg
    Wake-on: g
        Current message level: 0x00000007 (7)
                               drv probe link
    Link detected: yes


For example lets check only if Cable of Network card is plugged in and detected to have a network connection to remote node or switch and show the connection speed on which the 'autoneg on' (autonegiation option) of the LAN card has detected the network exat maximum speed:

root@pcfreak:~# ethtool eth0|grep -i 'link detected'; ethtool eth0 |grep 'Speed: '
    Link detected: yes
    Speed: 100Mb/s


1. Check ip command network configuration output

root@freak:~# ip addr show
1: lo: <LOOPBACK,UP,LOWER_UP> mtu 65536 qdisc noqueue state UNKNOWN group default qlen 1000
    link/loopback 00:00:00:00:00:00 brd 00:00:00:00:00:00
    inet 127.0.0.1/8 scope host lo
       valid_lft forever preferred_lft forever
2: eno1: <BROADCAST,MULTICAST,UP,LOWER_UP> mtu 1500 qdisc mq master xenbr0 state UP group default qlen 1000
    link/ether 70:e2:84:13:44:15 brd ff:ff:ff:ff:ff:ff
    altname enp7s0
3: eno2: <BROADCAST,MULTICAST,UP,LOWER_UP> mtu 1500 qdisc mq master xenbr1 state UP group default qlen 1000
    link/ether 70:e2:84:13:44:17 brd ff:ff:ff:ff:ff:ff
    altname enp8s0
4: xenbr0: <BROADCAST,MULTICAST,UP,LOWER_UP> mtu 1500 qdisc noqueue state UP group default qlen 1000
    link/ether 70:e2:84:13:44:13 brd ff:ff:ff:ff:ff:ff
    inet 192.168.1.7/24 brd 192.168.1.255 scope global dynamic xenbr0
       valid_lft 7361188sec preferred_lft 7361188sec
5: xenbr1: <BROADCAST,MULTICAST,UP,LOWER_UP> mtu 1500 qdisc noqueue state UP group default qlen 1000
    link/ether 70:e2:84:13:44:15 brd ff:ff:ff:ff:ff:ff
    inet 192.168.0.5/24 brd 192.168.0.255 scope global dynamic xenbr1
       valid_lft 536138sec preferred_lft 536138sec
10: vif2.0: <BROADCAST,MULTICAST,UP,LOWER_UP> mtu 1500 qdisc mq master xenbr0 state UP group default qlen 2000
    link/ether fe:ff:ff:ff:ff:ff brd ff:ff:ff:ff:ff:ff
11: vif2.1: <BROADCAST,MULTICAST,UP,LOWER_UP> mtu 1500 qdisc mq master xenbr1 state UP group default qlen 2000
    link/ether fe:ff:ff:ff:ff:ff brd ff:ff:ff:ff:ff:ff
12: vif3.0: <BROADCAST,MULTICAST,UP,LOWER_UP> mtu 1500 qdisc mq master xenbr0 state UP group default qlen 2000
    link/ether fe:ff:ff:ff:ff:ff brd ff:ff:ff:ff:ff:ff
13: vif3.1: <BROADCAST,MULTICAST,UP,LOWER_UP> mtu 1500 qdisc mq master xenbr1 state UP group default qlen 2000
    link/ether fe:ff:ff:ff:ff:ff brd ff:ff:ff:ff:ff:ff
14: vif4.0: <BROADCAST,MULTICAST,UP,LOWER_UP> mtu 1500 qdisc mq master xenbr0 state UP group default qlen 2000
    link/ether fe:ff:ff:ff:ff:ff brd ff:ff:ff:ff:ff:ff
15: vif4.1: <BROADCAST,MULTICAST,UP,LOWER_UP> mtu 1500 qdisc mq master xenbr1 state UP group default qlen 2000
    link/ether fe:ff:ff:ff:ff:ff brd ff:ff:ff:ff:ff:ff
16: vif5.0: <BROADCAST,MULTICAST,UP,LOWER_UP> mtu 1500 qdisc mq master xenbr0 state UP group default qlen 2000
    link/ether fe:ff:ff:ff:ff:ff brd ff:ff:ff:ff:ff:ff
17: vif5.1: <BROADCAST,MULTICAST,UP,LOWER_UP> mtu 1500 qdisc mq master xenbr1 state UP group default qlen 2000
    link/ether fe:ff:ff:ff:ff:ff brd ff:ff:ff:ff:ff:ff
18: vif6.0: <BROADCAST,MULTICAST,UP,LOWER_UP> mtu 1500 qdisc mq master xenbr0 state UP group default qlen 2000
    link/ether fe:ff:ff:ff:ff:ff brd ff:ff:ff:ff:ff:ff
19: vif6.1: <BROADCAST,MULTICAST,UP,LOWER_UP> mtu 1500 qdisc mq master xenbr0 state UP group default qlen 2000
    link/ether fe:ff:ff:ff:ff:ff brd ff:ff:ff:ff:ff:ff
30: vif17.0: <BROADCAST,MULTICAST,UP,LOWER_UP> mtu 1500 qdisc mq master xenbr0 state UP group default qlen 2000
    link/ether fe:ff:ff:ff:ff:ff brd ff:ff:ff:ff:ff:ff
31: vif17.1: <BROADCAST,MULTICAST,UP,LOWER_UP> mtu 1500 qdisc mq master xenbr1 state UP group default qlen 2000
    link/ether fe:ff:ff:ff:ff:ff brd ff:ff:ff:ff:ff:ff
34: vif21.0: <BROADCAST,MULTICAST,UP,LOWER_UP> mtu 1500 qdisc mq master xenbr0 state UP group default qlen 2000
    link/ether fe:ff:ff:ff:ff:ff brd ff:ff:ff:ff:ff:ff
35: vif21.1: <BROADCAST,MULTICAST,UP,LOWER_UP> mtu 1500 qdisc mq master xenbr1 state UP group default qlen 2000
    link/ether fe:ff:ff:ff:ff:ff brd ff:ff:ff:ff:ff:ff
48: vif25.0-emu: <BROADCAST,MULTICAST,UP,LOWER_UP> mtu 1500 qdisc pfifo_fast master xenbr0 state UNKNOWN group default qlen 1000
    link/ether fe:ff:ff:ff:ff:ff brd ff:ff:ff:ff:ff:ff
49: vif25.1-emu: <BROADCAST,MULTICAST,UP,LOWER_UP> mtu 1500 qdisc pfifo_fast master xenbr1 state UNKNOWN group default qlen 1000
    link/ether fe:ff:ff:ff:ff:ff brd ff:ff:ff:ff:ff:ff
50: vif25.0: <NO-CARRIER,BROADCAST,MULTICAST,UP> mtu 1500 qdisc mq master xenbr0 state DOWN group default qlen 2000
    link/ether fe:ff:ff:ff:ff:ff brd ff:ff:ff:ff:ff:ff
51: vif25.1: <NO-CARRIER,BROADCAST,MULTICAST,UP> mtu 1500 qdisc mq master xenbr1 state DOWN group default qlen 2000
    link/ether fe:ff:ff:ff:ff:ff brd ff:ff:ff:ff:ff:ff
118: vif47.0-emu: <BROADCAST,MULTICAST,UP,LOWER_UP> mtu 1500 qdisc pfifo_fast master xenbr0 state UNKNOWN group default qlen 1000
    link/ether fe:ff:ff:ff:ff:ff brd ff:ff:ff:ff:ff:ff
119: vif47.1-emu: <BROADCAST,MULTICAST,UP,LOWER_UP> mtu 1500 qdisc pfifo_fast master xenbr1 state UNKNOWN group default qlen 1000
    link/ether fe:ff:ff:ff:ff:ff brd ff:ff:ff:ff:ff:ff
120: vif47.0: <NO-CARRIER,BROADCAST,MULTICAST,UP> mtu 1500 qdisc mq master xenbr0 state DOWN group default qlen 2000
    link/ether fe:ff:ff:ff:ff:ff brd ff:ff:ff:ff:ff:ff
121: vif47.1: <NO-CARRIER,BROADCAST,MULTICAST,UP> mtu 1500 qdisc mq master xenbr1 state DOWN group default qlen 2000
    link/ether fe:ff:ff:ff:ff:ff brd ff:ff:ff:ff:ff:ff
root@freak:~# 

ip a s (is a also a shortcut command alias) you can enjoy if you have to deal with ip command frequently.

2. Check the status of the interfaces

Old fashioned way is to just do:

/sbin/ifconfig


root@freak:~# ifconfig 
eno1: flags=4163<UP,BROADCAST,RUNNING,MULTICAST>  mtu 1500
        ether 70:e2:84:13:44:15  txqueuelen 1000  (Ethernet)
        RX packets 52366502  bytes 10622469320 (9.8 GiB)
        RX errors 0  dropped 0  overruns 0  frame 0
        TX packets 242622195  bytes 274688121244 (255.8 GiB)
        TX errors 0  dropped 0 overruns 0  carrier 0  collisions 0
        device memory 0xfb200000-fb27ffff  

eno2: flags=4163<UP,BROADCAST,RUNNING,MULTICAST>  mtu 1500
        ether 70:e2:84:13:44:17  txqueuelen 1000  (Ethernet)
        RX packets 220995454  bytes 269698276095 (251.1 GiB)
        RX errors 0  dropped 7  overruns 0  frame 0
        TX packets 192319925  bytes 166233773782 (154.8 GiB)
        TX errors 0  dropped 0 overruns 0  carrier 0  collisions 0
        device memory 0xfb100000-fb17ffff  

lo: flags=73<UP,LOOPBACK,RUNNING>  mtu 65536
        inet 127.0.0.1  netmask 255.0.0.0
        loop  txqueuelen 1000  (Local Loopback)
        RX packets 2553  bytes 147410 (143.9 KiB)
        RX errors 0  dropped 0  overruns 0  frame 0
        TX packets 2553  bytes 147410 (143.9 KiB)
        TX errors 0  dropped 0 overruns 0  carrier 0  collisions 0

vif17.0: flags=4163<UP,BROADCAST,RUNNING,MULTICAST>  mtu 1500
        ether fe:ff:ff:ff:ff:ff  txqueuelen 2000  (Ethernet)
        RX packets 14517375  bytes 133226551792 (124.0 GiB)
        RX errors 0  dropped 0  overruns 0  frame 0
        TX packets 139688950  bytes 145111993017 (135.1 GiB)
        TX errors 0  dropped 0 overruns 0  carrier 0  collisions 0

vif17.1: flags=4163<UP,BROADCAST,RUNNING,MULTICAST>  mtu 1500
        ether fe:ff:ff:ff:ff:ff  txqueuelen 2000  (Ethernet)
        RX packets 86113294  bytes 156944058681 (146.1 GiB)
        RX errors 0  dropped 0  overruns 0  frame 0
        TX packets 181513904  bytes 267892940821 (249.4 GiB)
        TX errors 0  dropped 0 overruns 0  carrier 0  collisions 0

vif2.0: flags=4163<UP,BROADCAST,RUNNING,MULTICAST>  mtu 1500
        ether fe:ff:ff:ff:ff:ff  txqueuelen 2000  (Ethernet)
        RX packets 1521875  bytes 88282472 (84.1 MiB)
        RX errors 0  dropped 0  overruns 0  frame 0
        TX packets 152691174  bytes 278372314505 (259.2 GiB)
        TX errors 0  dropped 3 overruns 0  carrier 0  collisions 0

vif2.1: flags=4163<UP,BROADCAST,RUNNING,MULTICAST>  mtu 1500
        ether fe:ff:ff:ff:ff:ff  txqueuelen 2000  (Ethernet)
        RX packets 454915  bytes 81069760 (77.3 MiB)
        RX errors 0  dropped 0  overruns 0  frame 0
        TX packets 266953989  bytes 425692364876 (396.4 GiB)
        TX errors 0  dropped 26 overruns 0  carrier 0  collisions 0

vif21.0: flags=4163<UP,BROADCAST,RUNNING,MULTICAST>  mtu 1500
        ether fe:ff:ff:ff:ff:ff  txqueuelen 2000  (Ethernet)
        RX packets 20043711  bytes 1283926794 (1.1 GiB)
        RX errors 0  dropped 0  overruns 0  frame 0
        TX packets 141580485  bytes 277396881113 (258.3 GiB)
        TX errors 0  dropped 3 overruns 0  carrier 0  collisions 0

vif21.1: flags=4163<UP,BROADCAST,RUNNING,MULTICAST>  mtu 1500
        ether fe:ff:ff:ff:ff:ff  txqueuelen 2000  (Ethernet)
        RX packets 73004  bytes 3802174 (3.6 MiB)
        RX errors 0  dropped 0  overruns 0  frame 0
        TX packets 267151006  bytes 425621892663 (396.3 GiB)
        TX errors 0  dropped 14 overruns 0  carrier 0  collisions 0

vif25.0: flags=4099<UP,BROADCAST,MULTICAST>  mtu 1500
        ether fe:ff:ff:ff:ff:ff  txqueuelen 2000  (Ethernet)
        RX packets 0  bytes 0 (0.0 B)
        RX errors 0  dropped 0  overruns 0  frame 0
        TX packets 0  bytes 0 (0.0 B)
        TX errors 0  dropped 0 overruns 0  carrier 0  collisions 0

vif25.1: flags=4099<UP,BROADCAST,MULTICAST>  mtu 1500
        ether fe:ff:ff:ff:ff:ff  txqueuelen 2000  (Ethernet)
        RX packets 0  bytes 0 (0.0 B)
        RX errors 0  dropped 0  overruns 0  frame 0
        TX packets 0  bytes 0 (0.0 B)
        TX errors 0  dropped 0 overruns 0  carrier 0  collisions 0

vif25.0-emu: flags=4163<UP,BROADCAST,RUNNING,MULTICAST>  mtu 1500
        ether fe:ff:ff:ff:ff:ff  txqueuelen 1000  (Ethernet)
        RX packets 2736348  bytes 295661367 (281.9 MiB)
        RX errors 0  dropped 0  overruns 0  frame 0
        TX packets 260385509  bytes 265751226663 (247.5 GiB)
        TX errors 0  dropped 200 overruns 0  carrier 0  collisions 0

vif25.1-emu: flags=4163<UP,BROADCAST,RUNNING,MULTICAST>  mtu 1500
        ether fe:ff:ff:ff:ff:ff  txqueuelen 1000  (Ethernet)
        RX packets 145387  bytes 36011655 (34.3 MiB)
        RX errors 0  dropped 0  overruns 0  frame 0
        TX packets 370314760  bytes 394725961081 (367.6 GiB)
        TX errors 0  dropped 0 overruns 0  carrier 0  collisions 0

vif3.0: flags=4163<UP,BROADCAST,RUNNING,MULTICAST>  mtu 1500
        ether fe:ff:ff:ff:ff:ff  txqueuelen 2000  (Ethernet)
        RX packets 55382861  bytes 130042280927 (121.1 GiB)
        RX errors 0  dropped 0  overruns 0  frame 0
        TX packets 99040097  bytes 147929196318 (137.7 GiB)
        TX errors 0  dropped 1 overruns 0  carrier 0  collisions 0

vif3.1: flags=4163<UP,BROADCAST,RUNNING,MULTICAST>  mtu 1500
        ether fe:ff:ff:ff:ff:ff  txqueuelen 2000  (Ethernet)
        RX packets 5132631  bytes 295493762 (281.8 MiB)
        RX errors 0  dropped 0  overruns 0  frame 0
        TX packets 262314199  bytes 425416945203 (396.2 GiB)
        TX errors 0  dropped 16 overruns 0  carrier 0  collisions 0

vif4.0: flags=4163<UP,BROADCAST,RUNNING,MULTICAST>  mtu 1500
        ether fe:ff:ff:ff:ff:ff  txqueuelen 2000  (Ethernet)
        RX packets 4902015  bytes 615387539 (586.8 MiB)
        RX errors 0  dropped 0  overruns 0  frame 0
        TX packets 149342891  bytes 277802504143 (258.7 GiB)
        TX errors 0  dropped 1 overruns 0  carrier 0  collisions 0

vif4.1: flags=4163<UP,BROADCAST,RUNNING,MULTICAST>  mtu 1500
        ether fe:ff:ff:ff:ff:ff  txqueuelen 2000  (Ethernet)
        RX packets 276927  bytes 30720101 (29.2 MiB)
        RX errors 0  dropped 0  overruns 0  frame 0
        TX packets 267132395  bytes 425745668273 (396.5 GiB)
        TX errors 0  dropped 14 overruns 0  carrier 0  collisions 0

vif47.0: flags=4099<UP,BROADCAST,MULTICAST>  mtu 1500
        ether fe:ff:ff:ff:ff:ff  txqueuelen 2000  (Ethernet)
        RX packets 0  bytes 0 (0.0 B)
        RX errors 0  dropped 0  overruns 0  frame 0
        TX packets 0  bytes 0 (0.0 B)
        TX errors 0  dropped 0 overruns 0  carrier 0  collisions 0

vif47.1: flags=4099<UP,BROADCAST,MULTICAST>  mtu 1500
        ether fe:ff:ff:ff:ff:ff  txqueuelen 2000  (Ethernet)
        RX packets 0  bytes 0 (0.0 B)
        RX errors 0  dropped 0  overruns 0  frame 0
        TX packets 0  bytes 0 (0.0 B)
        TX errors 0  dropped 0 overruns 0  carrier 0  collisions 0

vif47.0-emu: flags=4163<UP,BROADCAST,RUNNING,MULTICAST>  mtu 1500
        ether fe:ff:ff:ff:ff:ff  txqueuelen 1000  (Ethernet)
        RX packets 208745  bytes 20096596 (19.1 MiB)
        RX errors 0  dropped 0  overruns 0  frame 0
        TX packets 110905731  bytes 110723486135 (103.1 GiB)
        TX errors 0  dropped 0 overruns 0  carrier 0  collisions 0

vif47.1-emu: flags=4163<UP,BROADCAST,RUNNING,MULTICAST>  mtu 1500
        ether fe:ff:ff:ff:ff:ff  txqueuelen 1000  (Ethernet)
        RX packets 140517  bytes 14596061 (13.9 MiB)
        RX errors 0  dropped 0  overruns 0  frame 0
        TX packets 150831959  bytes 162931572456 (151.7 GiB)
        TX errors 0  dropped 0 overruns 0  carrier 0  collisions 0

vif5.0: flags=4163<UP,BROADCAST,RUNNING,MULTICAST>  mtu 1500
        ether fe:ff:ff:ff:ff:ff  txqueuelen 2000  (Ethernet)
        RX packets 2030528  bytes 363988589 (347.1 MiB)
        RX errors 0  dropped 0  overruns 0  frame 0
        TX packets 152264264  bytes 278131541781 (259.0 GiB)
        TX errors 0  dropped 1 overruns 0  carrier 0  collisions 0

vif5.1: flags=4163<UP,BROADCAST,RUNNING,MULTICAST>  mtu 1500
        ether fe:ff:ff:ff:ff:ff  txqueuelen 2000  (Ethernet)
        RX packets 4169244  bytes 1045889687 (997.4 MiB)
        RX errors 0  dropped 0  overruns 0  frame 0
        TX packets 263561100  bytes 424894400987 (395.7 GiB)
        TX errors 0  dropped 7 overruns 0  carrier 0  collisions 0

vif6.0: flags=4163<UP,BROADCAST,RUNNING,MULTICAST>  mtu 1500
        ether fe:ff:ff:ff:ff:ff  txqueuelen 2000  (Ethernet)
        RX packets 300242  bytes 16210963 (15.4 MiB)
        RX errors 0  dropped 0  overruns 0  frame 0
        TX packets 153909576  bytes 278461295620 (259.3 GiB)
        TX errors 0  dropped 2 overruns 0  carrier 0  collisions 0

vif6.1: flags=4163<UP,BROADCAST,RUNNING,MULTICAST>  mtu 1500
        ether fe:ff:ff:ff:ff:ff  txqueuelen 2000  (Ethernet)
        RX packets 43  bytes 1932 (1.8 KiB)
        RX errors 0  dropped 0  overruns 0  frame 0
        TX packets 154205631  bytes 278481298141 (259.3 GiB)
        TX errors 0  dropped 2 overruns 0  carrier 0  collisions 0

xenbr0: flags=4163<UP,BROADCAST,RUNNING,MULTICAST>  mtu 1500
        inet 192.168.1.8  netmask 255.255.255.0  broadcast 192.168.1.255
        ether 70:e2:84:13:44:11  txqueuelen 1000  (Ethernet)
        RX packets 13689902  bytes 923464162 (880.6 MiB)
        RX errors 0  dropped 0  overruns 0  frame 0
        TX packets 12072932  bytes 1307055530 (1.2 GiB)
        TX errors 0  dropped 0 overruns 0  carrier 0  collisions 0

xenbr1: flags=4163<UP,BROADCAST,RUNNING,MULTICAST>  mtu 1500
        inet 192.168.0.3  netmask 255.255.255.0  broadcast 192.168.0.255
        ether 70:e2:84:13:44:12  txqueuelen 1000  (Ethernet)
        RX packets 626995  bytes 180026901 (171.6 MiB)
        RX errors 0  dropped 0  overruns 0  frame 0
        TX packets 12815  bytes 942092 (920.0 KiB)
        TX errors 0  dropped 0 overruns 0  carrier 0  collisions 0


root@freak:~# ifconfig        
eno1: flags=4163<UP,BROADCAST,RUNNING,MULTICAST>  mtu 1500
        ether 70:e2:84:13:44:11  txqueuelen 1000  (Ethernet)
        RX packets 52373358  bytes 10623034427 (9.8 GiB)
        RX errors 0  dropped 0  overruns 0  frame 0
        TX packets 242660000  bytes 274734018669 (255.8 GiB)
        TX errors 0  dropped 0 overruns 0  carrier 0  collisions 0
        device memory 0xfb200000-fb27ffff  

eno2: flags=4163<UP,BROADCAST,RUNNING,MULTICAST>  mtu 1500
        ether 70:e2:84:13:44:12  txqueuelen 1000  (Ethernet)
        RX packets 221197892  bytes 269978137472 (251.4 GiB)
        RX errors 0  dropped 7  overruns 0  frame 0
        TX packets 192573206  bytes 166491370299 (155.0 GiB)
        TX errors 0  dropped 0 overruns 0  carrier 0  collisions 0
        device memory 0xfb100000-fb17ffff  

lo: flags=73<UP,LOOPBACK,RUNNING>  mtu 65536
        inet 127.0.0.1  netmask 255.0.0.0
        loop  txqueuelen 1000  (Local Loopback)
        RX packets 2553  bytes 147410 (143.9 KiB)
        RX errors 0  dropped 0  overruns 0  frame 0
        TX packets 2553  bytes 147410 (143.9 KiB)
        TX errors 0  dropped 0 overruns 0  carrier 0  collisions 0

vif17.0: flags=4163<UP,BROADCAST,RUNNING,MULTICAST>  mtu 1500
        ether fe:ff:ff:ff:ff:ff  txqueuelen 2000  (Ethernet)
        RX packets 14519247  bytes 133248290251 (124.0 GiB)
        RX errors 0  dropped 0  overruns 0  frame 0
        TX packets 139708738  bytes 145135168676 (135.1 GiB)
        TX errors 0  dropped 0 overruns 0  carrier 0  collisions 0

vif17.1: flags=4163<UP,BROADCAST,RUNNING,MULTICAST>  mtu 1500
        ether fe:ff:ff:ff:ff:ff  txqueuelen 2000  (Ethernet)
        RX packets 86206104  bytes 157189755115 (146.3 GiB)
        RX errors 0  dropped 0  overruns 0  frame 0
        TX packets 181685983  bytes 268170806613 (249.7 GiB)
        TX errors 0  dropped 0 overruns 0  carrier 0  collisions 0

vif2.0: flags=4163<UP,BROADCAST,RUNNING,MULTICAST>  mtu 1500
        ether fe:ff:ff:ff:ff:ff  txqueuelen 2000  (Ethernet)
        RX packets 1522072  bytes 88293701 (84.2 MiB)
        RX errors 0  dropped 0  overruns 0  frame 0
        TX packets 152712638  bytes 278417240910 (259.2 GiB)
        TX errors 0  dropped 3 overruns 0  carrier 0  collisions 0

vif2.1: flags=4163<UP,BROADCAST,RUNNING,MULTICAST>  mtu 1500
        ether fe:ff:ff:ff:ff:ff  txqueuelen 2000  (Ethernet)
        RX packets 454933  bytes 81071616 (77.3 MiB)
        RX errors 0  dropped 0  overruns 0  frame 0
        TX packets 267218860  bytes 426217224334 (396.9 GiB)
        TX errors 0  dropped 26 overruns 0  carrier 0  collisions 0

vif21.0: flags=4163<UP,BROADCAST,RUNNING,MULTICAST>  mtu 1500
        ether fe:ff:ff:ff:ff:ff  txqueuelen 2000  (Ethernet)
        RX packets 20045530  bytes 1284038375 (1.1 GiB)
        RX errors 0  dropped 0  overruns 0  frame 0
        TX packets 141601066  bytes 277441739746 (258.3 GiB)
        TX errors 0  dropped 3 overruns 0  carrier 0  collisions 0

vif21.1: flags=4163<UP,BROADCAST,RUNNING,MULTICAST>  mtu 1500
        ether fe:ff:ff:ff:ff:ff  txqueuelen 2000  (Ethernet)
        RX packets 73010  bytes 3802474 (3.6 MiB)
        RX errors 0  dropped 0  overruns 0  frame 0
        TX packets 267415889  bytes 426146753845 (396.8 GiB)
        TX errors 0  dropped 14 overruns 0  carrier 0  collisions 0

vif25.0: flags=4099<UP,BROADCAST,MULTICAST>  mtu 1500
        ether fe:ff:ff:ff:ff:ff  txqueuelen 2000  (Ethernet)
        RX packets 0  bytes 0 (0.0 B)
        RX errors 0  dropped 0  overruns 0  frame 0
        TX packets 0  bytes 0 (0.0 B)
        TX errors 0  dropped 0 overruns 0  carrier 0  collisions 0

vif25.1: flags=4099<UP,BROADCAST,MULTICAST>  mtu 1500
        ether fe:ff:ff:ff:ff:ff  txqueuelen 2000  (Ethernet)
        RX packets 0  bytes 0 (0.0 B)
        RX errors 0  dropped 0  overruns 0  frame 0
        TX packets 0  bytes 0 (0.0 B)
        TX errors 0  dropped 0 overruns 0  carrier 0  collisions 0

vif25.0-emu: flags=4163<UP,BROADCAST,RUNNING,MULTICAST>  mtu 1500
        ether fe:ff:ff:ff:ff:ff  txqueuelen 1000  (Ethernet)
        RX packets 2736576  bytes 295678097 (281.9 MiB)
        RX errors 0  dropped 0  overruns 0  frame 0
        TX packets 260429831  bytes 265797660906 (247.5 GiB)
        TX errors 0  dropped 200 overruns 0  carrier 0  collisions 0

vif25.1-emu: flags=4163<UP,BROADCAST,RUNNING,MULTICAST>  mtu 1500
        ether fe:ff:ff:ff:ff:ff  txqueuelen 1000  (Ethernet)
        RX packets 145425  bytes 36018716 (34.3 MiB)
        RX errors 0  dropped 0  overruns 0  frame 0
        TX packets 370770440  bytes 395263409640 (368.1 GiB)
        TX errors 0  dropped 0 overruns 0  carrier 0  collisions 0

vif3.0: flags=4163<UP,BROADCAST,RUNNING,MULTICAST>  mtu 1500
        ether fe:ff:ff:ff:ff:ff  txqueuelen 2000  (Ethernet)
        RX packets 55392503  bytes 130064444520 (121.1 GiB)
        RX errors 0  dropped 0  overruns 0  frame 0
        TX packets 99052116  bytes 147951838129 (137.7 GiB)
        TX errors 0  dropped 1 overruns 0  carrier 0  collisions 0

vif3.1: flags=4163<UP,BROADCAST,RUNNING,MULTICAST>  mtu 1500
        ether fe:ff:ff:ff:ff:ff  txqueuelen 2000  (Ethernet)
        RX packets 5133054  bytes 295517366 (281.8 MiB)
        RX errors 0  dropped 0  overruns 0  frame 0
        TX packets 262578665  bytes 425941777243 (396.6 GiB)
        TX errors 0  dropped 16 overruns 0  carrier 0  collisions 0

vif4.0: flags=4163<UP,BROADCAST,RUNNING,MULTICAST>  mtu 1500
        ether fe:ff:ff:ff:ff:ff  txqueuelen 2000  (Ethernet)
        RX packets 4902949  bytes 615496460 (586.9 MiB)
        RX errors 0  dropped 0  overruns 0  frame 0
        TX packets 149363618  bytes 277847322538 (258.7 GiB)
        TX errors 0  dropped 1 overruns 0  carrier 0  collisions 0

vif4.1: flags=4163<UP,BROADCAST,RUNNING,MULTICAST>  mtu 1500
        ether fe:ff:ff:ff:ff:ff  txqueuelen 2000  (Ethernet)
        RX packets 276943  bytes 30721141 (29.2 MiB)
        RX errors 0  dropped 0  overruns 0  frame 0
        TX packets 267397268  bytes 426270528575 (396.9 GiB)
        TX errors 0  dropped 14 overruns 0  carrier 0  collisions 0

vif47.0: flags=4099<UP,BROADCAST,MULTICAST>  mtu 1500
        ether fe:ff:ff:ff:ff:ff  txqueuelen 2000  (Ethernet)
        RX packets 0  bytes 0 (0.0 B)
        RX errors 0  dropped 0  overruns 0  frame 0
        TX packets 0  bytes 0 (0.0 B)
        TX errors 0  dropped 0 overruns 0  carrier 0  collisions 0

vif47.1: flags=4099<UP,BROADCAST,MULTICAST>  mtu 1500
        ether fe:ff:ff:ff:ff:ff  txqueuelen 2000  (Ethernet)
        RX packets 0  bytes 0 (0.0 B)
        RX errors 0  dropped 0  overruns 0  frame 0
        TX packets 0  bytes 0 (0.0 B)
        TX errors 0  dropped 0 overruns 0  carrier 0  collisions 0

vif47.0-emu: flags=4163<UP,BROADCAST,RUNNING,MULTICAST>  mtu 1500
        ether fe:ff:ff:ff:ff:ff  txqueuelen 1000  (Ethernet)
        RX packets 208790  bytes 20100733 (19.1 MiB)
        RX errors 0  dropped 0  overruns 0  frame 0
        TX packets 110950236  bytes 110769932971 (103.1 GiB)
        TX errors 0  dropped 0 overruns 0  carrier 0  collisions 0

vif47.1-emu: flags=4163<UP,BROADCAST,RUNNING,MULTICAST>  mtu 1500
        ether fe:ff:ff:ff:ff:ff  txqueuelen 1000  (Ethernet)
        RX packets 140551  bytes 14599509 (13.9 MiB)
        RX errors 0  dropped 0  overruns 0  frame 0
        TX packets 151287643  bytes 163469024604 (152.2 GiB)
        TX errors 0  dropped 0 overruns 0  carrier 0  collisions 0

vif5.0: flags=4163<UP,BROADCAST,RUNNING,MULTICAST>  mtu 1500
        ether fe:ff:ff:ff:ff:ff  txqueuelen 2000  (Ethernet)
        RX packets 2030676  bytes 363997181 (347.1 MiB)
        RX errors 0  dropped 0  overruns 0  frame 0
        TX packets 152285777  bytes 278176471509 (259.0 GiB)
        TX errors 0  dropped 1 overruns 0  carrier 0  collisions 0

vif5.1: flags=4163<UP,BROADCAST,RUNNING,MULTICAST>  mtu 1500
        ether fe:ff:ff:ff:ff:ff  txqueuelen 2000  (Ethernet)
        RX packets 4169387  bytes 1045898303 (997.4 MiB)
        RX errors 0  dropped 0  overruns 0  frame 0
        TX packets 263825846  bytes 425419251935 (396.2 GiB)
        TX errors 0  dropped 7 overruns 0  carrier 0  collisions 0

vif6.0: flags=4163<UP,BROADCAST,RUNNING,MULTICAST>  mtu 1500
        ether fe:ff:ff:ff:ff:ff  txqueuelen 2000  (Ethernet)
        RX packets 300266  bytes 16212271 (15.4 MiB)
        RX errors 0  dropped 0  overruns 0  frame 0
        TX packets 153931212  bytes 278506234302 (259.3 GiB)
        TX errors 0  dropped 2 overruns 0  carrier 0  collisions 0

vif6.1: flags=4163<UP,BROADCAST,RUNNING,MULTICAST>  mtu 1500
        ether fe:ff:ff:ff:ff:ff  txqueuelen 2000  (Ethernet)
        RX packets 43  bytes 1932 (1.8 KiB)
        RX errors 0  dropped 0  overruns 0  frame 0
        TX packets 154227291  bytes 278526238467 (259.3 GiB)
        TX errors 0  dropped 2 overruns 0  carrier 0  collisions 0

xenbr0: flags=4163<UP,BROADCAST,RUNNING,MULTICAST>  mtu 1500
        inet 192.168.1.8  netmask 255.255.255.0  broadcast 192.168.1.255
        ether 70:e2:84:13:44:11  txqueuelen 1000  (Ethernet)
        RX packets 13690768  bytes 923520126 (880.7 MiB)
        RX errors 0  dropped 0  overruns 0  frame 0
        TX packets 12073667  bytes 1307127765 (1.2 GiB)
        TX errors 0  dropped 0 overruns 0  carrier 0  collisions 0

xenbr1: flags=4163<UP,BROADCAST,RUNNING,MULTICAST>  mtu 1500
        inet 192.168.0.3  netmask 255.255.255.0  broadcast 192.168.0.255
        ether 70:e2:84:13:44:12  txqueuelen 1000  (Ethernet)
        RX packets 627010  bytes 180028847 (171.6 MiB)
        RX errors 0  dropped 0  overruns 0  frame 0
        TX packets 12815  bytes 942092 (920.0 KiB)
        TX errors 0  dropped 0 overruns 0  carrier 0  collisions 0


To see ethernet interfaces that seem up and then do a ifconfig -a to check whether some interfaces are down (e.g. not shown in the simple ifconfig list).
/sbin/ifconfig -a

! Please note that some virtual IP configurations might not appear and noly be visible in an (ip addr show) command.


3. Check iproute2 for special rt_tables (Routing Tables) rules
 

By default Linux distributions does not have any additional rules in /etc/iproute2/rt_tables however some Linux router machines, needs to have a multiple Gateways. Perhaps the most elegant way to do multiple routings with Linux is to use iproute2's routing tables rt_tables.

Here is example of an OpenXEN system that has 2 Internet providers attached and routes different traffic via


root@freak:~# cat /etc/iproute2/rt_tables
#
# reserved values
#
255    local
254    main
253    default

100    INET1
200     INET2
0    unspec
#
# local
#
#1    inr.ruhep


root@freak:~# ip rule list
0:    from all lookup local
32762:    from all to 192.168.1.8 lookup INET2
32763:    from 192.168.1.8 lookup INET2
32764:    from all to 192.168.0.3 lookup INET1
32765:    from 192.168.0.3 lookup INET1
32766:    from all lookup main
32767:    from all lookup default
root@freak:~# 
 

4. Using ip route get to find out traffic route (path)

root@freak:~# ip route get 192.168.0.1
192.168.0.1 via 192.168.0.1 dev xenbr1 src 192.168.0.3 uid 0 
    cache 


root@freak:~# /sbin/route -n
Kernel IP routing table
Destination     Gateway         Genmask         Flags Metric Ref    Use Iface
0.0.0.0         192.168.1.1     0.0.0.0         UG    0      0        0 xenbr0
192.168.0.0     192.168.0.1     255.255.255.0   UG    0      0        0 xenbr1
192.168.0.0     0.0.0.0         255.255.255.0   U     0      0        0 xenbr1
192.168.1.0     0.0.0.0         255.255.255.0   U     0      0        0 xenbr0
root@freak:~# 

root@freak:~# ip route show
default via 192.168.1.1 dev xenbr0 
192.168.0.0/24 via 192.168.0.1 dev xenbr1 
192.168.0.0/24 dev xenbr1 proto kernel scope link src 192.168.0.3 
192.168.1.0/24 dev xenbr0 proto kernel scope link src 192.168.1.8 


If you find that gateway is missing you might want to add it with:

root@freak:~#  ip route add default via 192.168.5.1

If you need to add a speicic network IP range via separate gateways, you can use commands like:

To add routing for 192.168.0.1/24 / 192.168.1.1/24 via 192.168.0.1 and 192.168.1.1

# /sbin/route add -net 192.168.1.0 netmask 255.255.255.0 gw 192.168.1.1 dev eth1
# /sbin/route add -net 192.168.0.0 netmask 255.255.255.0 gw 192.168.0.1 dev eth1


If you need to delete a configured wrong route with ip command

# ip route del 192.168.1.0/24 via 0.0.0.0 dev eth1
# ip route del 192.168.0.0/24 via 0.0.0.0 dev eth1

5. Use ping (ICMP protocol) the Destionation IP
 

root@freak:~# ping -c 3 192.168.0.1
PING 192.168.0.1 (192.168.0.1) 56(84) bytes of data.
64 bytes from 192.168.0.1: icmp_seq=1 ttl=64 time=0.219 ms
64 bytes from 192.168.0.1: icmp_seq=2 ttl=64 time=0.295 ms
64 bytes from 192.168.0.1: icmp_seq=3 ttl=64 time=0.270 ms

— 192.168.0.1 ping statistics —
3 packets transmitted, 3 received, 0% packet loss, time 2048ms
rtt min/avg/max/mdev = 0.219/0.261/0.295/0.031 ms
root@freak:~# ping -c 3 192.168.0.39
PING 192.168.0.39 (192.168.0.39) 56(84) bytes of data.
From 192.168.1.80: icmp_seq=2 Redirect Host(New nexthop: 192.168.0.39)
From 192.168.1.80: icmp_seq=3 Redirect Host(New nexthop: 192.168.0.39)
From 192.168.1.80 icmp_seq=1 Destination Host Unreachable


— 192.168.0.39 ping statistics —
3 packets transmitted, 0 received, +1 errors, 100% packet loss, time 2039ms
pipe 3


Note that sometimes you might get 100% traffic loss but still have connection to the destionation in case if the ICMP protocol is filtered for security.

However if you get something like Network is unreachable that is usually an indicator of some routing problem or wrongly configured network netmask.

root@freak:~# ping 192.168.0.5
ping: connect: Network is unreachable

Test network with different packet size. To send 8972 bytes of payload in a Ethernet frame without fragmentation, the following command can be used:

root@pcfreak:~# ping -s 8972 -M do -c 4 freak
PING xen (192.168.1.8) 8972(9000) bytes of data.
ping: local error: message too long, mtu=1500
^C
— xen ping statistics —
3 packets transmitted, 0 received, +3 errors, 100% packet loss, time 2037ms

root@pcfreak:~# 


 -M pmtudisc_opt
           Select Path MTU Discovery strategy.  pmtudisc_option may be either do (prohibit fragmentation, even local one), want (do PMTU discovery, fragment locally when packet size is
           large), or dont (do not set DF flag).


root@pcfreak:~# ping -s 8972 -M want -c 4 freak
PING xen (192.168.1.8) 8972(9000) bytes of data.
8980 bytes from xen (192.168.1.5): icmp_seq=1 ttl=64 time=2.18 ms
8980 bytes from xen (192.168.1.5): icmp_seq=2 ttl=64 time=1.90 ms
8980 bytes from xen (192.168.1.5): icmp_seq=3 ttl=64 time=2.10 ms
^C
— xen ping statistics —
3 packets transmitted, 3 received, 0% packet loss, time 2002ms
rtt min/avg/max/mdev = 1.901/2.059/2.178/0.116 ms

root@pcfreak:~# 

  • -M do: prohibit fragmentation
  • -s 8972 8972 bytes of data
  • ICMP header: 8 bytes
  • IP header: 20 bytes (usually, it can be higher)
  • 8980 bytes of bytes is the IP payload
     

These commands can be used to capture for MTU (maximum transmition units) related issues between hosts that are preventing for hosts to properly send traffic between themselves.
A common issue for Linux hosts to be unable to see each other on the same network is caused by Jumbo Frames (MTU 9000) packets enabled on one of the sides and MTU of 1500 on the other side.
Thus it is always a good idea to thoroughully look up all configured MTUs for all LAN Devices on each server.

6. Check traceroute path to host

If there is no PING but ip route get shows routing is properly configured and the routes existing in the Linux machine routing tables, next step is to check the output of traceroute / tracepath / mtr


raceroute to 192.168.0.1 (192.168.0.1), 30 hops max, 60 byte packets
 1  pcfreak (192.168.0.1)  0.263 ms  0.166 ms  0.119 ms
root@freak:~# tracepath 192.168.1.1
 1?: [LOCALHOST]                      pmtu 1500
 1:  vivacom-gigabit-router                                0.925ms reached
 1:  vivacom-gigabit-router                                0.835ms reached
     Resume: pmtu 1500 hops 1 back 1 


It might be useful to get a frequent output of the command (especially on Linux hosts) where mtr command is not installed with:


root@freak:~# watch -n 0.1 traceroute 192.168.0.1


root@freak:~# traceroute -4 google.com
traceroute to google.com (172.217.17.110), 30 hops max, 60 byte packets
 1  vivacom-gigabit-router (192.168.1.1)  0.657 ms  1.280 ms  1.647 ms
 2  213.91.190.130 (213.91.190.130)  7.983 ms  8.168 ms  8.097 ms
 3  * * *
 4  * * *
 5  212-39-66-222.ip.btc-net.bg (212.39.66.222)  16.613 ms  16.336 ms  17.151 ms
 6  * * *
 7  142.251.92.65 (142.251.92.65)  18.808 ms  13.246 ms 209.85.254.242 (209.85.254.242)  15.541 ms
 8  142.251.92.3 (142.251.92.3)  14.223 ms 142.251.227.251 (142.251.227.251)  14.507 ms 142.251.92.3 (142.251.92.3)  15.328 ms
 9  ams15s29-in-f14.1e100.net (172.217.17.110)  14.097 ms  14.909 ms 142.251.242.230 (142.251.242.230)  13.481 ms
root@freak:~# 

If you have MTR then you can get plenty of useful additional information such as the Network HOP name or the Country location of the HOP.


To get HOP name:


root@freak:~# mtr -z google.com


To get info on where (which Country) exactly network HOP is located physically:

root@freak:~# mtr -y 2 google.com


7. Check iptables INPUT / FORWARD / OUTPUT rules are messing with something
 

# iptables -L -n 

# iptables -t nat -L -n


Ideally you would not have any firewall

# iptables -L -n 

Chain INPUT (policy ACCEPT)
target     prot opt source               destination         

Chain FORWARD (policy ACCEPT)
target     prot opt source               destination         

Chain OUTPUT (policy ACCEPT)
target     prot opt source               destination         

# iptables -t nat -L -n
Chain PREROUTING (policy ACCEPT)
target     prot opt source               destination         

Chain INPUT (policy ACCEPT)
target     prot opt source               destination         

Chain OUTPUT (policy ACCEPT)
target     prot opt source               destination         

Chain POSTROUTING (policy ACCEPT)
target     prot opt source               destination         


In case if something like firewalld is enabled as a default serviceto provide some modern Linux firewall as Ubuntu and Redhat / CentOS / Fedoras has it often turned on as a service stop and disable the service

# systemctl stop firewalld

# systemctl disable firewalld


8. Debug for any possible MAC address duplicates
 

root@pcfrxen:~# arp -an
? (192.168.1.33) at 00:16:3e:59:96:9e [ether] on eth0
? (192.168.1.1) at 18:45:93:c6:d8:00 [ether] on eth1
? (192.168.0.1) at 8c:89:a5:f2:e8:d9 [ether] on eth1
? (192.168.1.1) at 18:45:93:c6:d8:00 [ether] on eth0
? (192.168.1.11) at 7c:0a:3f:89:b6:fa [ether] on eth1
? (192.168.1.17) at <incomplete> on eth0
? (192.168.1.37) at 00:16:3e:ea:05:ce [ether] on eth0
? (192.168.1.80) at 8c:89:a5:f2:e7:d8 [ether] on eth0
? (192.168.1.11) at 7c:0a:3f:89:a5:fa [ether] on eth0
? (192.168.1.30) at 00:16:3e:bb:46:45 [ether] on eth1
? (192.168.0.210) at 00:16:3e:68:d9:55 [ether] on eth1
? (192.168.1.30) at 00:16:3e:bb:46:45 [ether] on eth0
? (192.168.1.18) at 00:16:3e:0d:40:05 [ether] on eth1
? (192.168.0.211) at 00:16:3e:4d:41:05 [ether] on eth1
? (192.168.1.35) at 00:16:3e:d1:8f:77 [ether] on eth0
? (192.168.1.18) at 00:16:3e:0d:43:05 [ether] on eth0
? (192.168.1.28) at 00:16:3e:04:12:1c [ether] on eth1
? (192.168.0.3) at 70:e2:84:13:43:12 [ether] on eth1
? (192.168.0.208) at 00:16:3e:51:de:9c [ether] on eth1
? (192.168.0.241) at 00:16:3e:0d:48:06 [ether] on eth1
? (192.168.1.28) at 00:16:3e:04:12:1c [ether] on eth0
? (192.168.1.33) at 00:16:3e:59:97:8e [ether] on eth1
? (192.168.0.241) at 00:16:3e:0d:45:06 [ether] on eth0
? (192.168.0.209) at 00:16:3e:5c:df:96 [ether] on eth1

root@pcfrxen:~# ip neigh show
192.168.1.33 dev eth0 lladdr 00:16:3e:59:96:9e REACHABLE
192.168.1.1 dev eth1 lladdr 18:45:93:c6:d8:00 STALE
192.168.0.1 dev eth1 lladdr 8c:89:a5:f2:e8:d9 REACHABLE
192.168.1.1 dev eth0 lladdr 18:45:93:c6:d9:01 REACHABLE
192.168.1.11 dev eth1 lladdr 7c:0a:3f:89:a6:fb STALE
192.168.1.17 dev eth0  FAILED
192.168.1.37 dev eth0 lladdr 00:16:3e:ea:06:ce STALE
192.168.1.80 dev eth0 lladdr 8c:89:a5:f2:e8:d9 REACHABLE
192.168.1.11 dev eth0 lladdr 7c:0a:3f:89:a7:fa STALE
192.168.1.30 dev eth1 lladdr 00:16:3e:bb:45:46 STALE
192.168.0.210 dev eth1 lladdr 00:16:3e:68:d8:56 REACHABLE
192.168.1.30 dev eth0 lladdr 00:16:3e:bb:45:46 STALE
192.168.1.18 dev eth1 lladdr 00:16:3e:0d:48:04 STALE
192.168.0.211 dev eth1 lladdr 00:16:3e:4d:40:04 STALE
192.168.1.35 dev eth0 lladdr 00:16:3e:d2:8f:76 STALE
192.168.1.18 dev eth0 lladdr 00:16:3e:0d:48:06 STALE
192.168.1.28 dev eth1 lladdr 00:16:3e:04:11:2c STALE
192.168.0.3 dev eth1 lladdr 70:e2:84:13:44:13 STALE
192.168.0.208 dev eth1 lladdr 00:16:3e:51:de:9c REACHABLE
192.168.0.241 dev eth1 lladdr 00:16:3e:0d:48:07 STALE
192.168.1.28 dev eth0 lladdr 00:16:3e:04:12:1c REACHABLE
192.168.1.33 dev eth1 lladdr 00:16:3e:59:96:9e STALE
192.168.0.241 dev eth0 lladdr 00:16:3e:0d:49:06 STALE
192.168.0.209 dev eth1 lladdr 00:16:3e:5c:dd:97 STALE
root@pcfrxen:~# 


9. Check out with netstat / ss for any irregularities such as high amount of error of faulty ICMP / TCP / UDP network packs


For example check out the netstat network stack output

# netstat -s


root@pcfrxen:~# netstat -s
Ip:
    Forwarding: 2
    440044929 total packets received
    1032 with invalid addresses
    0 forwarded
    0 incoming packets discarded
    439988902 incoming packets delivered
    396161852 requests sent out
    3 outgoing packets dropped
    100 dropped because of missing route
Icmp:
    1025 ICMP messages received
    540 input ICMP message failed
    ICMP input histogram:
        destination unreachable: 1014
        timeout in transit: 11
    519 ICMP messages sent
    0 ICMP messages failed
    ICMP output histogram:
        destination unreachable: 519
IcmpMsg:
        InType3: 1014
        InType11: 11
        OutType3: 519
Tcp:
    1077237 active connection openings
    1070510 passive connection openings
    1398236 failed connection attempts
    111345 connection resets received
    83 connections established
    438293250 segments received
    508143650 segments sent out
    42567 segments retransmitted
    546 bad segments received
    329039 resets sent
Udp:
    1661295 packets received
    278 packets to unknown port received
    0 packet receive errors
    1545720 packets sent
    0 receive buffer errors
    0 send buffer errors
    IgnoredMulti: 33046
UdpLite:
TcpExt:
    1 invalid SYN cookies received
    1398196 resets received for embryonic SYN_RECV sockets
    1737473 packets pruned from receive queue because of socket buffer overrun
    1118775 TCP sockets finished time wait in fast timer
    638 time wait sockets recycled by time stamp
    656 packetes rejected in established connections because of timestamp
    2218959 delayed acks sent
    2330 delayed acks further delayed because of locked socket
    Quick ack mode was activated 7172 times
    271799723 packet headers predicted
    14917420 acknowledgments not containing data payload received
    171078735 predicted acknowledgments
    52 times recovered from packet loss due to fast retransmit
    TCPSackRecovery: 337
    Detected reordering 1551 times using SACK
    Detected reordering 1501 times using reno fast retransmit
    Detected reordering 61 times using time stamp
    9 congestion windows fully recovered without slow start
    38 congestion windows partially recovered using Hoe heuristic
    TCPDSACKUndo: 241
    104 congestion windows recovered without slow start after partial ack
    TCPLostRetransmit: 11550
    1 timeouts after reno fast retransmit
    TCPSackFailures: 13
    3772 fast retransmits
    2 retransmits in slow start
    TCPTimeouts: 24104
    TCPLossProbes: 101748
    TCPLossProbeRecovery: 134
    TCPSackRecoveryFail: 3
    128989224 packets collapsed in receive queue due to low socket buffer
    TCPBacklogCoalesce: 715034
    TCPDSACKOldSent: 7168
    TCPDSACKOfoSent: 341
    TCPDSACKRecv: 16612
    150689 connections reset due to unexpected data
    27063 connections reset due to early user close
    17 connections aborted due to timeout
    TCPDSACKIgnoredOld: 158
    TCPDSACKIgnoredNoUndo: 13514
    TCPSpuriousRTOs: 9
    TCPSackMerged: 1191
    TCPSackShiftFallback: 1011
    TCPDeferAcceptDrop: 699473
    TCPRcvCoalesce: 3311764
    TCPOFOQueue: 14289375
    TCPOFOMerge: 356
    TCPChallengeACK: 621
    TCPSYNChallenge: 621
    TCPSpuriousRtxHostQueues: 4
    TCPAutoCorking: 1605205
    TCPFromZeroWindowAdv: 132380
    TCPToZeroWindowAdv: 132441
    TCPWantZeroWindowAdv: 1445495
    TCPSynRetrans: 23652
    TCPOrigDataSent: 388992604
    TCPHystartTrainDetect: 69089
    TCPHystartTrainCwnd: 3264904
    TCPHystartDelayDetect: 4
    TCPHystartDelayCwnd: 128
    TCPACKSkippedPAWS: 3
    TCPACKSkippedSeq: 2001
    TCPACKSkippedChallenge: 2
    TCPWinProbe: 123043
    TCPKeepAlive: 4389
    TCPDelivered: 389507445
    TCPAckCompressed: 7343781
    TcpTimeoutRehash: 23311
    TcpDuplicateDataRehash: 8
    TCPDSACKRecvSegs: 17335
IpExt:
    InMcastPkts: 145100
    OutMcastPkts: 9429
    InBcastPkts: 18226
    InOctets: 722933727848
    OutOctets: 759502627470
    InMcastOctets: 58227095
    OutMcastOctets: 3284379
    InBcastOctets: 1756918
    InNoECTPkts: 440286946
    InECT0Pkts: 936


  • List all listening established connections to host

# netstat -ltne

  • List all UDP / TCP connections

# netstat -ltua

or if you prefer to do it with the newer and more comprehensive tool ss:
 

  • List all listening TCP connections 

# ss -lt

  • List all listening UDP connections 

# ss -ua

  • Display statistics about recent connections

root@pcfrxen:~# ss -s
Total: 329
TCP:   896 (estab 70, closed 769, orphaned 0, timewait 767)

Transport Total     IP        IPv6
RAW      0         0         0        
UDP      40        36        4        
TCP      127       118       9        
INET      167       154       13       
FRAG      0         0         0 

  • If you need to debug some specific sport or dport filter out the connection you need by port number

# ss -at '( dport = :22 or sport = :22 )'


Debug for any possible issues with ICMP unreachable but ports reachable with NMAP / telnet / Netcat
 

# nc 192.168.0.1 -vz

root@pcfrxen:/ # nc 192.168.0.1 80 -vz
pcfreak [192.168.0.1] 80 (http) open


root@pcfrxen:/ # nc 192.168.0.1 5555 -vz
pcfreak [192.168.0.1] 5555 (?) : Connection refused


root@pcfrxen:/# telnet 192.168.0.1 3128
Trying 192.168.0.1…
Connected to 192.168.0.1.
Escape character is '^]'.
^]
telnet> quit
Connection closed.


root@pcfrxen:/# nmap -sS -P0 192.168.0.1 -p 443 -O
Starting Nmap 7.80 ( https://nmap.org ) at 2023-11-27 19:51 EET
Nmap scan report for pcfreak (192.168.0.1)
Host is up (0.00036s latency).

PORT    STATE SERVICE
443/tcp open  https
MAC Address: 8C:89:A5:F2:E8:D8 (Micro-Star INT'L)
Warning: OSScan results may be unreliable because we could not find at least 1 open and 1 closed port
Aggressive OS guesses: Linux 3.11 (96%), Linux 3.1 (95%), Linux 3.2 (95%), AXIS 210A or 211 Network Camera (Linux 2.6.17) (94%), Linux 2.6.32 (94%), Linux 3.10 (94%), Linux 2.6.18 (93%), Linux 3.2 – 4.9 (93%), ASUS RT-N56U WAP (Linux 3.4) (93%), Linux 3.16 (93%)
No exact OS matches for host (test conditions non-ideal).
Network Distance: 1 hop

OS detection performed. Please report any incorrect results at https://nmap.org/submit/ .
Nmap done: 1 IP address (1 host up) scanned in 6.24 seconds
root@pcfrxen:/# 

10. Add static MAC address to Ethernet Interface (if you find a MAC address being wrongly assigned to interface)

Sometimes problems with network unrechability between hosts is caused by wrongly defined MAC addresses on a Switch that did not correspond correctly to the ones assigned on the Linux host.
The easiest resolution here if you don't have access to Switch in work environment is to reassign the default MAC addresses of interfaces to proper MAC addresses, expected by remote router.


root@pcfrxen:/#  ​/sbin/ifconfig eth2 hw ether 8c:89:a5:f2:e8:d6

root@pcfrxen:/#  /sbin/ifconfig eth1 hw ether 8c:89:a5:f2:e8:d5


root@pcfrxen:/#  ifconfig eth0|grep -i ether
        ether 8c:89:a5:f2:e8:d6 txqueuelen 1000  (Ethernet)


11. Check for Network Address Translation (NAT) misconfigurations

If you do use some NAT-ing between Linux host and the remote Network Device you cannot reach, make sure IP Forwarding is enabled (i.e. /etc/sysctl.conf was not mistakenly overwritten by a script or admin for whatever reason).
 

root@server:~# sysctl net.ipv4.ip_forward
net.ipv4.ip_forward = 1
root@server:~# sysctl net.ipv4.conf.all.forwarding
net.ipv4.conf.all.forwarding = 1

root@server:~# sysctl net.ipv6.conf.all.forwarding
net.ipv6.conf.all.forwarding = 0

12. Check for Resolving DNS irregularities with /etc/resolv.conf


If network connectivity is okay on TCP / IP , UDP Level but problems with DNS of course, check what you have configured inside /etc/resolv.conf

And if use newer Linux distributions and have resolving managed by systemd check status of resolvectl
 

root@server:~# cat /etc/resolv.conf
# Dynamic resolv.conf(5) file for glibc resolver(3) generated by resolvconf(8)
#     DO NOT EDIT THIS FILE BY HAND — YOUR CHANGES WILL BE OVERWRITTEN
# 127.0.0.53 is the systemd-resolved stub resolver.
# run "resolvectl status" to see details about the actual nameservers.

nameserver 127.0.0.1
search pc-freak.net
domain pc-freak.net
nameserver 8.8.8.8
nameserver 8.8.4.4
nameserver 109.104.195.2
nameserver 109.104.195.1
nameserver 208.67.222.222
nameserver 208.67.220.220
options timeout:2 rotate

root@pcfreak:~# 


root@server:~# resolvectl status
Global
       Protocols: -LLMNR -mDNS -DNSOverTLS DNSSEC=no/unsupported
resolv.conf mode: stub

Link 2 (ens3)
    Current Scopes: DNS
         Protocols: +DefaultRoute +LLMNR -mDNS -DNSOverTLS DNSSEC=no/unsupported
Current DNS Server: 192.168.5.1
       DNS Servers: 192.168.5.1


  As seen see, the systemd-resolved service is used to provide domain names resolution and we can modify its configuration file /etc/systemd/resolved.conf to add the DNS server – the following line is set (two DNS servers’ addresses are added):

For example …

DNS=8.8.8.8 

13. Fix problems with wrongly configured Network Speed between hosts

It is not uncommon to have a Switch between two Linux hosts that is set to communicate on a certain maximum amount of Speed but a Linux host is set to communicate or lesser or more of Speed, this might create network issues so in such cases make sure either you use the Auto Negitionation network feature
or set both sides to be communicating on the same amount of network speed.

To turn on auto negotiation for ether interface 

# ethtool -s eth1 speed 1000 duplex full autoneg on


For example to set a Linux network interface to communicate on 1 Gigabit speed and switch off autonegotiation off.

# ethtool -s eth1 speed 1000 duplex full autoneg off

14. Check arp and icmp traffic with tcpdump

On both sides where the IPs can't see each other we can run a tcpdump to check the ARP and ICMP traffic flowing between the hosts.
 

# tcpdump -i eth1 arp or icmp

cpdump: verbose output suppressed, use -v[v]… for full protocol decode
listening on eth1, link-type EN10MB (Ethernet), snapshot length 262144 bytes
15:29:07.001841 IP freak-eth1 > pcfr_hware_local_ip: ICMP echo request, id 13348, seq 65, length 64
15:29:07.001887 IP pcfr_hware_local_ip > freak-eth1: ICMP echo reply, id 13348, seq 65, length 64
15:29:07.598413 ARP, Request who-has pcfr_hware_local_ip tell zabbix-server, length 46
15:29:07.598425 ARP, Reply pcfr_hware_local_ip is-at 8c:89:a5:f2:e8:d8 (oui Unknown), length 28
15:29:07.633055 ARP, Request who-has freak_vivacom_auto_assigned_dhcp_ip tell 192.168.1.1, length 46
15:29:08.025824 IP freak-eth1 > pcfr_hware_local_ip: ICMP echo request, id 13348, seq 66, length 64
15:29:08.025864 IP pcfr_hware_local_ip > freak-eth1: ICMP echo reply, id 13348, seq 66, length 64


# tcpdump -i eth1 -vvv


If you want to sniff for TCP protocol and specific port and look up for DATA transfered for SMTP you can use something like:


# tcpdump -nNxXi eth0 -s 0 proto TCP and port 25​


If you need a bit more thorough explanation on what it would do check out my previous article How to catch / track mail server traffic abusers with tcpdump
 

15. Debugging network bridge issues

Having bridge network interface is another brink where things could go totally wrong.
If you have network bridges configured, check out what is the status of the bridge.
 

root@freak:/etc/network# brctl show
bridge name    bridge id        STP enabled    interfaces
xenbr0        8000.70e284134411    yes        eno1
                            vif1.0
                            vif10.0
                            vif16.0
                            vif16.0-emu
                            vif2.0
                            vif3.0
                            vif4.0
                            vif5.0
                            vif6.0
                            vif9.0
                            vif9.0-emu
xenbr1        8000.70e284134412    yes        eno2
                            vif1.1
                            vif10.1
                            vif16.1
                            vif16.1-emu
                            vif2.1
                            vif3.1
                            vif4.1
                            vif5.1
                            vif6.1
                            vif9.1
                            vif9.1-emu


Check out any configurations such as /etc/sysconfig/network-scripts/ifcfg-* are not misconfigured if on Redhat / CentOS / Fedora.
Or if on Debian / Ubuntu and other deb based Linuxes look up for /etc/network/interfaces config problems that might be causing the bridge to misbehave.

For example one bridge network issue, I've experienced recently is related to bridge_ports variable configured as bridge_ports all.
This was causing the second bridge xenbr1 to be unable to see another local network that was directly connected with a cable to it.

The fix was bridge_ports none. Finding out this trivial issue caused by a restored network config from old backup took me days to debug.
As everything seemed on a network level to be perfect just like in Physical layer, same way and on Software level, routings were okay.

Checked everything multiple times and did not see anything irregular. ping was missing and hosts cannot see each other even though having the right netmask and
network configuration in place.

Below is my /etc/network/interfaces configuration with the correct bridge_ports none changed.

root@freak:/etc/network# cat /etc/network/interfaces
auto lo
iface lo inet loopback
 

auto eno1
allow-hotplug eno1
iface eno1 inet manual
dns-nameservers 127.0.0.1 8.8.8.8 8.8.4.4 207.67.222.222 208.67.220.220
auto eno2
allow-hotplug eno2
iface eno2 inet manual
dns-nameservers 127.0.0.1 8.8.8.8 8.8.4.4 207.67.222.222 208.67.220.220

auto xenbr0
allow-hotplug xenbr0
 # Bridge setup
# fetching dhcp ip from 192.168.1.20 (vivacom fiber optics router) routing traffic via 1Gigabit network
 iface xenbr0 inet dhcp
    hwaddress ether 70:e2:84:13:44:11
#    address 192.168.1.5/22
    address 192.168.1.5
    netmask 255.255.252.0
    # address 192.168.1.8 if dhcp takes from vivacom dhcpd
    bridge_ports eno1
    gateway 192.168.1.20
    bridge_stp on
    bridge_waitport 0
    bridge_fd 0
    bridge_ports none
    dns-nameservers 8.8.8.8 8.8.4.4

auto xenbr1
# fetching dhcp ip from pc-freak.net (192.168.0.1) bergon.net routing traffic through it
allow-hotplug xenbr1
 iface xenbr1 inet dhcp
    hwaddress ether 70:e2:84:13:44:11
##    address 192.168.0.3/22
    address 192.168.0.8
    netmask 255.255.252.0
   # address 192.168.0.8 if dhcp takes from vivacom dhcpd (currently mac deleted from vivacom router)
   # address 192.168.0.9 if dhcp takes from pc-freak.net hware host
#    hwaddress ether 70:e2:84:13:44:13
    gateway 192.168.0.1
    bridge_ports eno2
    bridge_stp on
    bridge_waitport 0
    bridge_fd 0
    bridge_ports none
    dns-nameservers 8.8.8.8 8.8.4.4
root@freak:/etc/network# 


root@freak:/etc/network# brctl showstp xenbr0
xenbr0
 bridge id        8000.70e284134411
 designated root    8000.70e284134411
 root port           0            path cost           0
 max age          20.00            bridge max age          20.00
 hello time           2.00            bridge hello time       2.00
 forward delay          15.00            bridge forward delay      15.00
 ageing time           0.00
 hello timer           1.31            tcn timer           0.00
 topology change timer       0.00            gc timer           0.00
 flags            


eno1 (1)
 port id        8001            state             forwarding
 designated root    8000.70e284134411    path cost          19
 designated bridge    8000.70e284134411    message age timer       0.00
 designated port    8001            forward delay timer       0.00
 designated cost       0            hold timer           0.31
 flags            

vif1.0 (2)
 port id        8002            state             forwarding
 designated root    8000.70e284134411    path cost         100
 designated bridge    8000.70e284134411    message age timer       0.00
 designated port    8002            forward delay timer       0.00
 designated cost       0            hold timer           0.31
 flags            

vif10.0 (12)
 port id        800c            state             forwarding
 designated root    8000.70e284134411    path cost         100
 designated bridge    8000.70e284134411    message age timer       0.00
 designated port    800c            forward delay timer       0.00
 designated cost       0            hold timer           0.31
 flags            

vif16.0 (13)
 port id        800d            state               disabled
 designated root    8000.70e284134411    path cost         100
 designated bridge    8000.70e284134411    message age timer       0.00
 designated port    800d            forward delay timer       0.00
 designated cost       0            hold timer           0.00
 flags            

vif16.0-emu (14)
 port id        800e            state             forwarding
 designated root    8000.70e284134411    path cost         100
 designated bridge    8000.70e284134411    message age timer       0.00
 designated port    800e            forward delay timer       0.00
 designated cost       0            hold timer           0.31
 flags            

vif2.0 (4)
 port id        8004            state             forwarding
 designated root    8000.70e284134411    path cost         100
 designated bridge    8000.70e284134411    message age timer       0.00
 designated port    8004            forward delay timer       0.00
 designated cost       0            hold timer           0.31
 flags            

vif3.0 (5)
 port id        8005            state             forwarding
 designated root    8000.70e284134411    path cost         100
 designated bridge    8000.70e284134411    message age timer       0.00
 designated port    8005            forward delay timer       0.00
 designated cost       0            hold timer           0.31
 flags            

vif4.0 (3)
 port id        8003            state             forwarding
 designated root    8000.70e284134411    path cost         100
 designated bridge    8000.70e284134411    message age timer       0.00
 designated port    8003            forward delay timer       0.00
 designated cost       0            hold timer           0.31
 flags            

vif5.0 (6)
 port id        8006            state             forwarding
 designated root    8000.70e284134411    path cost         100
 designated bridge    8000.70e284134411    message age timer       0.00
 designated port    8006            forward delay timer       0.00
 designated cost       0            hold timer           0.31
 flags            

vif6.0 (7)
 port id        8007            state             forwarding
 designated root    8000.70e284134411    path cost         100
 designated bridge    8000.70e284134411    message age timer       0.00
 designated port    8007            forward delay timer       0.00
 designated cost       0            hold timer           0.31
 flags            

vif9.0 (10)
 port id        800a            state               disabled
 designated root    8000.70e284134411    path cost         100
 designated bridge    8000.70e284134411    message age timer       0.00
 designated port    800a            forward delay timer       0.00
 designated cost       0            hold timer           0.00
 flags            

vif9.0-emu (11)
 port id        800b            state             forwarding
 designated root    8000.70e284134411    path cost         100
 designated bridge    8000.70e284134411    message age timer       0.00
 designated port    800b            forward delay timer       0.00
 designated cost       0            hold timer           0.31
 flags            

root@freak:/etc/network# 


Sum it up

We have learned how to debug various routing issues, how to add and remote default gateways, check network reachability with ICMP protocol with ping, traceroute as well check for DNS issues and given some hints how to resolve DNS misconfigurations.
We also learned how to check the configured Network interfaces certain settings and resolve issues caused by Network sides max Speed misconfigurations as well how to track and resolve communication issues caused by wrongly configured MAC addresses.
Further more learned on how to do a basic port and protocol debugging of state of Network packets with netstat and nc and check problems related to iptables Firewall and IP Forwarding misconfigurations.
Finally we learned some basic usage of tcpdump on how to track arp and MAC traffic and look up for a specific TCP / UDP protocol  and its contained data.
There is certainly things this article is missing as the topic of debugging network connectivity issues on Linux is a whole ocean, especially as the complexity of Linux has grown dramatically these days.
I gues it is worthy to mention that unable to see remote network could be caused by wrong VLAN configurations on Linux or even buggy switches and router devices, due to hardware or software,
but I hope this article at least covers the very basics of network debugging and Linux. 

Enjojy 🙂

Check the Type and Model of available installed Memory on Linux / Unix / BSD Server howto

Monday, October 30th, 2023

how-linux-kernel-manages-memory-picture

As a system administrator one of the common task, one has to do is Add / Remove or Replace (of Broken or failing Bank of RAM memory) a piece of additional Bank of memory Bank to a Linux / BSD / Unix server.  Lets say you need to fullfil the new RAM purchase and provide some information to the SDM (Service Delivery Manager) of the compnay you're hirder in or you need to place the purchase yourself. Then you  need to know the exact speed and type of RAM currently installed on the server installed.

In this article i'll shortly explain how do I find out ram (SDRAM) information from a via ordinary remote ssh shell session cmd prompt. In short will be shown how can one check RAM speed configured and detected by Linux / Unix kernel ? 
As well as  how to Check the type of memory (if it is DDR / DDR2 / DDR or DDR4) or ECC with no access to Hardware Console.  Please note this article will be definitely boring for the experienced sysadmins but might help to a starter sysadmins to get on board with a well know basic stuff.

There are several approaches, of course easiest one is to use remote hardware access interrace statistics web interface of ILO (on IBM machine) or the IDRAC on (Dell Server) or Fujitsu's servers iRMC. However as not always access to remote Remote hardware management interface is available to admin. Linux comes with few commands that can do the trick, that are available to most Linux distributions straight for the default package repositories.

Since mentioning about ECC a bit up, most old school admins and computer users knows pretty well about DDRs as they have been present over time but ECC is being used over actively on servers perhaps over the last 10 / 15 years and for those not dealt with it below is a short description on what is ECC RAM Memory.

ECC RAM, short for Error Correcting Code Random Access Memory, is a kind of RAM can detect most common kinds of memory errors and correct a subset of them. ECC RAM is common in enterprise deployments and most server-class hardware. Above a certain scale and memory density, single-bit errors which were up to this point are sufficiently statistically unlikely begin to occur with enough frequency that they can no longer be ignored. At certain scales and densities of memory arbitrary memory errors that are literally "one in a million chances" (or more) may in fact occur several times throughout a system's operational life.

Putting some basics, Lets proceed and Check RAM speed and type (line DDR or DDR2 or DDR3 or DDR4) without having to physically go to the the Data Center numbered rack that is containing the server.


Most famous and well known (also mentioned) on few occasions in my previous articles are: dmidecode and lshw

Quickest way to get a quick overview of installed servers memory is with:
 

root@server:~# dmidecode -t memory | grep -E "Speed:|Type:" | sort | uniq -c
      4     Configured Memory Speed: 2133 MT/s
     12     Configured Memory Speed: Unknown
      4     Error Correction Type: Multi-bit ECC
      2     Speed: 2133 MT/s
      2     Speed: 2400 MT/s
     12     Speed: Unknown
     16     Type: DDR4


To get more specifics on the exact type of memory installed on the server, the respective slots that are already taken and the free ones:

root@server:~# dmidecode –type 17 | less

Usually the typical output the command would produce regarding lets say 4 installed Banks of RAM memory on the server will be like:

Handle 0x002B, DMI type 17, 40 bytes
Memory Device
        Array Handle: 0x0029
        Error Information Handle: Not Provided
        Total Width: 72 bits
        Data Width: 64 bits
       
Size: 16 GB
        Form Factor: RIMM
        Set: None
        Locator: CPU1 DIMM A1
        Bank Locator: A1_Node0_Channel0_Dimm1
       
Type: DDR4
        Type Detail: Synchronous
       
Speed: 2400 MT/s
        Manufacturer: Micron
       
Serial Number: 15B36358
        Asset Tag: CPU1 DIMM A1_AssetTag
       
Part Number: 18ASF2G72PDZ-2G3B1 
        Rank: 2
       
Configured Memory Speed: 2133 MT/s
        Minimum Voltage: Unknown
        Maximum Voltage: Unknown
        Configured Voltage: Unknown

Handle 0x002E, DMI type 17, 40 bytes
Memory Device
        Array Handle: 0x0029
        Error Information Handle: Not Provided
        Total Width: Unknown
        Data Width: Unknown
        Size: No Module Installed
        Form Factor: RIMM
        Set: None
        Locator: CPU1 DIMM A2
        Bank Locator: A1_Node0_Channel0_Dimm2
        Type: DDR4
        Type Detail: Synchronous
        Speed: Unknown
        Manufacturer: NO DIMM
        Serial Number: NO DIMM
        Asset Tag: NO DIMM
        Part Number: NO DIMM
        Rank: Unknown
        Configured Memory Speed: Unknown
        Minimum Voltage: Unknown
        Maximum Voltage: Unknown
        Configured Voltage: Unknown


Handle 0x002D, DMI type 17, 40 bytes
Memory Device
        Array Handle: 0x0029
        Error Information Handle: Not Provided
        Total Width: 72 bits
        Data Width: 64 bits
        Size: 16 GB
        Form Factor: RIMM
        Set: None
        Locator: CPU1 DIMM B1
        Bank Locator: A1_Node0_Channel1_Dimm1
        Type: DDR4
        Type Detail: Synchronous
        Speed: 2400 MT/s
        Manufacturer: Micron
        Serial Number: 15B363AF
        Asset Tag: CPU1 DIMM B1_AssetTag
        Part Number: 18ASF2G72PDZ-2G3B1 
        Rank: 2
        Configured Memory Speed: 2133 MT/s
        Minimum Voltage: Unknown
        Maximum Voltage: Unknown
        Configured Voltage: Unknown

Handle 0x0035, DMI type 17, 40 bytes
Memory Device
        Array Handle: 0x0031
        Error Information Handle: Not Provided
        Total Width: 72 bits
        Data Width: 64 bits
        Size: 16 GB
        Form Factor: RIMM
        Set: None
        Locator: CPU1 DIMM D1
        Bank Locator: A1_Node0_Channel3_Dimm1
        Type: DDR4
        Type Detail: Synchronous
        Speed: 2133 MT/s
        Manufacturer: Micron
        Serial Number: 1064B491
        Asset Tag: CPU1 DIMM D1_AssetTag
        Part Number: 36ASF2G72PZ-2G1A2  
        Rank: 2
        Configured Memory Speed: 2133 MT/s
        Minimum Voltage: Unknown
        Maximum Voltage: Unknown
        Configured Voltage: Unknown

Handle 0x0033, DMI type 17, 40 bytes
Memory Device
        Array Handle: 0x0031
        Error Information Handle: Not Provided
        Total Width: 72 bits
        Data Width: 64 bits
        Size: 16 GB
        Form Factor: RIMM
        Set: None
        Locator: CPU1 DIMM C1
        Bank Locator: A1_Node0_Channel2_Dimm1
        Type: DDR4
        Type Detail: Synchronous
        Speed: 2133 MT/s
        Manufacturer: Micron
        Serial Number: 10643A5B
        Asset Tag: CPU1 DIMM C1_AssetTag
        Part Number: 36ASF2G72PZ-2G1A2  
        Rank: 2
        Configured Memory Speed: 2133 MT/s
        Minimum Voltage: Unknown
        Maximum Voltage: Unknown
        Configured Voltage: Unknown


The marked in green are the banks of memory that are plugged in the server. The

field Speed: and Configured Memory Speed: are fields indicating respectively the Maximum speed on which a plugged-in RAM bank can operate and the the actual Speed the Linux kernel has it configured and uses is at.

It is useful for the admin to usually check the complete number of available RAM slots on a server, this can be done with command like:

root@server:~#  dmidecode –type 17 | grep -i Handle | grep 'DMI'|wc -l
16


As you can see at this specific case 16 Memory slots are avaiable (4 are already occupied and working configured on the machine at 2133 Mhz and 12 are empty and can have installed a memory banks in).


Perhaps the most interesting information for the RAM replacement to be ordered is to know the data communication SPEED on which the Memory is working on the server and interacting with Kernel and Processor to find out.

root@server:~#  dmidecode –type 17 | grep -i "speed"|grep -vi unknown
    Speed: 2400 MT/s
    Configured Memory Speed: 2133 MT/s
    Speed: 2400 MT/s
    Configured Memory Speed: 2133 MT/s
    Speed: 2133 MT/s
    Configured Memory Speed: 2133 MT/s
    Speed: 2133 MT/s
    Configured Memory Speed: 2133 MT/s


If you're lazy to remember the exact dmidecode memory type 17 you can use also memory keyword:

root@server:~# dmidecode –type memory | more

For servers that have the lshw command installed, a quick overview of RAM installed and Full slots available for memory placement can be done with:
 

root@server:~#  lshw -short -C memory
H/W path                 Device        Class          Description
=================================================================
/0/0                                   memory         64KiB BIOS
/0/29                                  memory         64GiB System Memory
/0/29/0                                memory         16GiB RIMM DDR4 Synchronous 2400 MHz (0.4 ns)
/0/29/1                                memory         RIMM DDR4 Synchronous [empty]
/0/29/2                                memory         16GiB RIMM DDR4 Synchronous 2400 MHz (0.4 ns)
/0/29/3                                memory         RIMM DDR4 Synchronous [empty]
/0/29/4                                memory         16GiB RIMM DDR4 Synchronous 2133 MHz (0.5 ns)
/0/29/5                                memory         RIMM DDR4 Synchronous [empty]
/0/29/6                                memory         16GiB RIMM DDR4 Synchronous 2133 MHz (0.5 ns)
/0/29/7                                memory         RIMM DDR4 Synchronous [empty]
/0/29/8                                memory         RIMM DDR4 Synchronous [empty]
/0/29/9                                memory         RIMM DDR4 Synchronous [empty]
/0/29/a                                memory         RIMM DDR4 Synchronous [empty]
/0/29/b                                memory         RIMM DDR4 Synchronous [empty]
/0/29/c                                memory         RIMM DDR4 Synchronous [empty]
/0/29/d                                memory         RIMM DDR4 Synchronous [empty]
/0/29/e                                memory         RIMM DDR4 Synchronous [empty]
/0/29/f                                memory         RIMM DDR4 Synchronous [empty]
/0/43                                  memory         768KiB L1 cache
/0/44                                  memory         3MiB L2 cache
/0/45                                  memory         30MiB L3 cache

Now once we know the exact model and RAM Serial and Part number you can google it online and to purchase more of the same RAM Model and Type you need so the installed memory work on the same Megaherzes as the installed ones.
 

How to Create New Windows 10 NTFS Drive partition from new empty ( Unallocated ) space with Windows Disk Management or diskpart command

Thursday, November 18th, 2021

Windows-10-paritioning-with-disk-management-diskmgmt.msc

As mentioned in previous article, I've been setting up a new PC that is a bit old a 11 years old Lenovo ThinkCentre model M90P with 8 GB of Memory, Intel(R) Core(TM) i5 CPU         650  @ 3.20GHz   3.19 GHz, Intel Q57 Express Chipset.

After the installation was successful on the new Desktop PC attached SSD, I was curious to see how Windows detects the 521 GB Solid State Drive Samsung  Disk, as well as to assign all the SSD Disk space, so I don't have unused parts of the drive hanging around.

To get the exact type of SSD installed on the Lenovo ThinkCentre, it comes to a simple PowerShell command (note that the PowerShell command has to be executed as Administrator).


Windows PowerShell
Copyright (C) Microsoft Corporation. All rights reserved.

Try the new cross-platform PowerShell https://aka.ms/pscore6

PS C:\Windows\system32> Get-PhysicalDisk

Number FriendlyName               SerialNumber   MediaType CanPool OperationalStatus HealthStatus Usage            Size
—— ————               ————   ——— ——- —————– ———— —–            —-
0      SAMSUNG MZ7LN512HAJQ-00000 S3TVNX0MC04330 SSD       True    OK                Healthy      Auto-Select 476.94 GB


PS C:\Windows\system32>


PowerShell-Get-PhysicalDisk-command-print-exact-SSD-type-attached-to-a-Windows-computer 

During the Windows installation, I did installed Windows on a 110GB partition that was left behind from my attempt to copy another 120GB ssd drive as, I've described in my previous article.
Cause of that big part of the SAMSUNG MZ7LN512HAJQ-00000 SSD was left unpartitioned ( unallocated ) and respectively the space did not show in Windows, hence to work around this I was supposed to 
create new Windows Drive and format it either in VFAT (FAT32) or NTFS. Through the years when I had to do such an operations I often either booted from some bootCD and did the desired partitioning or if
partitioning had to be done on a LivePC without reboot, I've used Windows Partitioning Software, such as:

  • The Industry Standard Partition Manager ( Acronis Disk Director ) 
     
  • EaseUS Partition Manager


Using a Good partition manager is a great thing if some complicated partitioning operations needs to be done,  however for such a trivial stuff such as mine in that case – Creating a new NTFS filesystem from unallocated space is a bit of nonsense, thus this time I've decided to use the Windows Standard tool for Partitioinng
 

  • Disk Management

To run the tool you need to run Computer Management tool first either by just looking it up in the Search bar near Start menu (Windows 10 flag icon) or by invoking command line start window, by pressing together

Windows Button + R and runnining command:

C:\Users\Emilian> compmgmt.msc


From there on navigate to

Storage -> Disk Management

windows-computer-management-screenshot

Go over box Unallocated (365.15 GB) and Press Right Mouse Button and select

-> New Simple Volume

new-simple-volume-screenshot

Next steps are quite self explanatory, had to just follow the New Simple Volme Wizard steps

windows-computer-management-screenshot

windows-computer-management-screenshot-3

windows-computer-management-screenshot-4

I Prefer to use NTFS because it is quicker and kinda of a standard since Windows 8+ onwards, besides that this computer will be used as a simple web browsing station and there is no plans the disk will ever have to be attached to a different OS like UNIX / LInux..However always keep in mind for compitability reasons VFAT Filesystem is usually not a bad idea. 

windows-computer-management-screenshot-5

https://www.pc-freak.net/images/new-ntfs-volume-F-drive-windows-10-screenshot

As you can see the drive is prepared and now accessible from Windows Explorer under Drive F:\. If you wonder why the drive is not D:\, it seems to create the D:\ the unallocated space is supposed to be be on a separate Disk which waas not the case with this PC setup.

After installing the SSD drive and setting the proper partitions another good practice is to use Disk Defragmenter Win tool to optimize the Drives for speed. Another useful feature of disk degragmenter is you can use it to check what kind of hard drive you have installed e.g. SATA or SSD, as well as check if the installed SSD is NVME (Non-Volatile-Memory-Express), e.g. of a faster type.

To run Disk Degrafmenter do  Win key + R


C:\Users\Emilian> dfrgui


dfrgui-command-screenshot-windows-1

Below is what dfrgui reports on the ThinkCentre after running Disk Optimize for each Drive – (Optimize All) option.

dfrgui-partitions-on-lenovo-thinkcentre-windows-screeshot

Just to show you what you can see with dfrgui, here is the dfrgui screenshot from another PC that has attached both SATA disk and NVME SSD Drive.

dfrgui-command-screenshot-windows-2


How to do partitioning from Windows console with diskpart command (useful for scripting)


If you're coming from Linux world and you're pretty used to fdisk / cfdisk etc. to do partitioning daily, then you'll be most happy to hear about existence of the diskpart command in Windows, which is a kinda of an equivalent tool.
The tool is perfect for domain administrators which need to do some dynamic partitioning operations on multiple computers at once.

 To use diskpart you need Administrator command prompt, there is much you can do with diskpart, below is how to create another NTFS partition on a secondary

C:\Windows\System32> diskpart

diskpart-win-screenshot-1

DISKPART> list disk

diskpart-win-screenshot-2

DISKPART> select disk 2

diskpart-win-screenshot-3

To clean all the content (e.g. delete everything on hard drive) e.g. all files and directories

!!! BEWARE NOT TO DELETE BY MISTAKE YOUR DATA DON'T BLAME ME IF YOU JUST COPY PASTE IRRESPONSIBLY WITHOUT THINKING.
AFTER ALL IT IS YOUR COMPUTER !!!

DISKPART> clean


diskpart-win-screenshot-4

Next lets, create a partition, in below screenshot you can see how to use help and what are the supported partition types in Windows 10 as of year 2021.


/diskpart-help-create-partition-type-screenshot
 

DISKPART> create partition primary

diskpart-win-screenshot-6

To format new assigned primary partition as NTFS

DISKPART> format fs=ntfs

diskpart-win-screenshot-7

Once formatted to assign Drive letter that is the next available free one in order

DISKPART> assign


diskpart-win-screenshot-8

If instead of auto assigning a letter to new formatted partition, you would want to assign a specific Drive letter, lets say F:\> as it was in our case with the Graphical Windows Disk Management tool earlier in article.

DISKPART> assign letter=F


Using diskpart it is pretty easy to do much stuff from command line such as formatting a new attached empty unallocated drive, or formatting and setting a desired filesysteem of external attached Hard Drive. Note that the disk list arguments will list any externally attached Supported Storage and you can use disklist similarly to do quick format / repartition / wipe out data or whatever.

Further on just for fun I've run CPUID which is a great Windows freeware tool to report System Information, pretty much like the good old Everest such as exact CPU type, MainBoard, Graphics Card and Mainboard type of the certain hardware you have on running.

cpuid-screenshot-windows-10
 
That's all folks Hope this article, helped you learn something new.

Cheers 😉


17th of May Saint Martyr Nikolay Sofiiski (Nikolas of Sofia) – Bulgarian Martyr Confessor saint from the XV century

Friday, May 21st, 2021

Saint Confessor Nikolay Sofijski (Nikolay of Sofia) Short Biography


saint_Nikolay-of-Sofia-icon-on-the-entrance-of-his-Church-in-capital-of-Bulgaria-Sofia

St. Nikolay (Nicolas) of Sofia has been born in Ioannina (city now in territory of Greece). He was a pious and with his honorable craft of shoemaking going through the stormy sea of life. When he arrived in Sofia (Serdica / Sredetz), one of the main cities of the Ottoman Empire of that time, a long remain of the glorious past when even the righteous emperor Constantine The great was considering to set as a capital of the Eastern empire either Constantinople today's Istanbul in Turkey or Sofia (Fortress of Serdika).

When Nikolay came to Sofia, he was immediately recognized by the Turkish authorities and rich people of the city  and to have him part of their "nobel" turkish society and enrich the city ruleship, the Turkish tried to push Nikolay to accept Islam. 
Once a time Turkish invited Nikolay, put a somniferous herb in his offered drink and once he fall asleep without his knowledge they have circumcised him according to Islamic tradition observance. 
Once awaken Nikolay realised what has been done to him and fall in a deep regret and mourned over the abuse of his body which according the Christian faith is a temple of the Holy Spirit. Once he started appearing on the streets of Sofia, Turkish immediately invited him to attend the mosque considering him already a muslim due to the circumcision ritual commited on him. 
He firmly rejected the offer publicly, considering himself a Christian as he never publicly resigned his Christian faith and never ever wanted to be muslim and never ever has attended another temple apart from the Eastern Orthodox Christian Church he belonged to.
Facing the rejection, the powerful of the day turks cannot believe their eyes as they already thought Nikolay accepted the fact he is already a muslim, not understanding that for a Christian the temporary flesh is nothing but a temporary hut and the Spiritual and Eternal Soul and The Spirit of God which enlightens it as well as the Eternal Kingdom of Heaven is everything. The turks thouhgt over it fleshly, thinking that having a sign of circumcision already puts a person belonging to his faith, not knowing that the the first desciples of Christ, the most holy apostles as belonging to the Jewish faith had their circumcision themselves, and this circumcision never ever hindered their faith in the Resurrected Messiah Jesus Christ.

Immediately facing the rejecting the Turks, arrested him as a traitor of their faith and put him into a harsh torments.

Saint_Nikolay_Sofijski-living-and-martyrdom-scenes-icon-painting

Saint_Nikolay_Sofijski-martyrdom-scenes-icon-painting

Combined icon with the living of saint Nikolay of Sofia

Putting him on trial In the local court, the judge announced his opinion that Nikolay doesn't hold a fault, neither against Islam neither against the claimants.
Nevertheless the crowd put Nikolay outside of Sofia (in a similar way the Jews resurrected Christ outside of the city of Jerusalem) in Sofia's near region called "Yuch Bunar", translated from Turkish as the  ("The Tree Wells"), there they stoned to death on 17th of May year 1555 A.D., (the stoning a transgressor of the Islamic law, tradition is still followed by some countries even today, for example I heard similar cases do happen still in Saudi Arabia for sinners against islamic law).

Saint_Bulgarian_Christian_martyr_Nikolay-Sofiiski-year-1555AD-commemorated-17-th-of-May

Saint Nikolay icon in his traditional Bulgarian clothes wear (Nosia)
holding his shoemaking instrument

His holy body has been moved to the graveyear called (Търница) Térnitza and has been burned – and the dust has been scattered through the four directions of the world North, East, South, West following islamic tradition and in attempt to completely irradicate the memory of the saint in the relatives and the living Christians of that time.  Even though due to the request of Matey Gramatik (Mathew the Gramatik – translated as Chronicler / Annalist), a boy managed to collect little burned part remains of the relics and a pious christian, secretly made a burial prayer for his Soul (Опело – called Opelo in the Slavonic Eastern Orthodox Church) according to the Christian tradition and buried him with honor.

saint_Nikolay-new-of-Sofia-sv_nikolay_novi
 

Soon after the martyrdom of saint Nikolay the New, the Metropolitan of Sredetz Iakov (Jacob), announced the canonization of st. Nikolay on a specially summoned for the consideration of saintship of St. Nikolay, a Local Church Metropolitan Council. Jacob received parts from holy relics (parts of the skull and the bones) of st. Nikolay, that has been secretly kept by a faithful Christians till then and placed the new received saint relics and placed them together in the ark (coffin) with the incorruptable holy relics of Saint King Stephan Milutin at that time located in Church of St. Archangel Michaelsee my previous article pilgrimage to the incorruptable Holy relics of Saint Stephan Milutin in Cathedral Saint Nedelya, Sofia Bulgaria. Later parts of the holy relics has been housed in in a Wood maden Church.


The grave of saint Nikolay of Sofia is one of the few known graves of Bulgarian saints. Today, it is situated in the city center of Sofia capital city of Bulgaria in the district "Три кладенци" / "The Three Wells". Three hundred meters from there (in the tiny park like garden between the streets of "Pirotska" and "Opalchenska") lays a Beatiful Majestic Church, dedicated to the Holy Martyr st. Nikolay Sofijski. The Church of Saint Nicolas of Sofia is one of the biggest Cathedral Churches in Bulgaria (it is second by size in city of Sofia). The Temple has been rised following a project of architecture created by Anton Tornyov after the Liberation of Bulgarian following the Russian/Bulgarian-Turkish war on 3-rd of December 1900. Church saint Nikolay Sofijski has been consecrated by Metropolitan Partenij (Parthenius of Sofia was a senior Bulgarian clergyman and church figure, Metropolitan of Sofia from 1892 to 1918. Metropolitan Parthenius is an exceptional clergyman who has left a lasting mark in the history of the Bulgarian Orthodox Church.).

Church-of-Saint_Nikolay-Sofijski-Cyrkva_Sv_Nikolaj_Sofijski

Church of Saint Nikolay of Sofia in Sofia Bulgaria (corner of street "Opalchenska" and "Pirotska").


Church-of-saint-Nikolay-of-Sofia-internal-view-Church-icons-and-architecture-decoration

Church Nikolay Sofijski view to Iconostasis Church interior

Saint-Nikolay-of-Sofia-Church-dome-Christ

Church dome paintings of St. Nikolay Sofijski

Saint-Nikolay-of-Sofia-Church-Iconostasis-icons

Iconostasis of the Church (notice the beatiful flower forms curved wood)

In the beginning of XXth century in 1870s on the exact place of the grave of the saint has been built a small chapel in his memoriam. It is situated in a small yard on today's Street of "Tzar Simeon / King Simeon" it is opened for pilgrim visitors everyday in the early afternoon every working day. 
Chapel-with-grave-of-Saint-Nikolay-of-Sofia-1
The Chapel entrance door 

Chapel-with-grave-of-Saint-Nikolay-of-Sofia-2

A Heavenly beauty roman like chapel

Chapel_paraklis_sv_Nikolaj_Sofijski_novi

The Chapel on the grave of Saint Nikolas of Sofia, built on the place called "Terniza" (Tzar Simeon Street), where on 17-th of May, year 1555 A.D. where remains of the saint has been burned by turks – photo by Martin Mitov (C) 

Chapel-with-grave-of-Saint-Nikolay-of-Sofia-3

The Grave of Saint Nikolay of Sofia (View to Alter dedicated to the matryr saint)


The holy relics of Saint Nikolay the new are now preserved in his Church  and are brought for veneration by believers and pilgrims on each 16 and 17 of May and sometimes in a Church feasts of a higher importance.

Each 17-th of May in Sofia it is a tradition for clirics (clergy) to gather together with pilgrims and layman for a Lithia with the holy relics of saint Nikolay from the Church to the chapel, and for the following two days 18, 19th of May his holy relics are publicly displayed for veneration.

Sofia's mediaval historian and clergyman deacon Matey Gramatik (upmentioned), was a comtemporary of the saint and eyewitness of his martyrdom and death, soon after wrote his Church service and Biography (Saint Living). Today the original manuscript is preserved in the the Library of the church "St. Martyr Nikolai Novi Sofiyski" in Sofia.

Let by the holy prayers of Saint Nikolay Sofijski our homeland Bulgaria is given peace prosperity in The Hope, Faith and Love and every Good and firmness in the True faith given by Christ the Holy Eastern Orthodox faith. Let by his Holy prayers God gives peace and love to everyone in the world and grant, repentance for us the lost and spiritually poor and "fatherless" children of the 21st century.

Christ is Risen – Truly He is Risen – Happy Easter !

Tuesday, May 4th, 2021

admin

One more year the Holy Fire has descended and we have been blessed to great Each other with the All Joyful Paschal Greeting !

Христос възкресе! Воистина възкресе! (Hristos vozkrese! Voistina vozkrese!)


Христос Воскресе – Воистину Воскресе! Христос възкресе! Воистина възкресе! (Hristos vozkrese! Voistina vozkrese!)
Христос васкрсе! Ваистину васкрсе! (Hristos vaskrse! Vaistinu vaskrse!)
Χριστὸς ἀνέστη! Ἀληθῶς ἀνέστη! 

Christus ist auferstanden! Er ist wahrhaftig auferstanden!Christ is Risen ! Truly He is Risen !

For complete list of Paschal Greeting as a referrence to get idea how other weird languages sound like and how it is used in the major Eastern Orthodox Churches all around the world check out my previous article Christ is Risen Eastern Orthodox Resurrection Paschal Greeting in Different Languages

Kh

SEO: Best day and time to write new articles and tweet to get more blog reads – Social Network Timing

Tuesday, June 17th, 2014

what-is-best-time-to-write-articles-to-increase-your-blog-traffic

I'm trying to regularly blog – as this gives me a roadmap what I'm into and how I spent my time. When have free time,  I blog almost daily except on weekends (as in weekends I'm trying to stay away from computers). So if you want to attract more readers to your blog the interesting question arises
 

What time is best to hit publish on your posts?

writing-in-the-mogning-on-the-internet-timing-morning-is-best-for-your-posts
Now there are different angles from where you can extract conclusions on best timing to blog post.One major thing to consider always when posting is that highest percentage of users read blogs in the morning with their morning coffee. Here are some more facts on when web content is more red:

  • 70% of users say they read blogs in the morning
  • More men read blogs at night than woman
  • Mondays are the highest traffic days for avarage blogs
  • 11 a.m. is normally the highest traffic hour for blogs
  • Usually most comments are put on Saturdays
  • Blogs with more than one post a day has higher chance of inbound links and usually get more unique visitors

As my blog is more technical oriented most of my visitors are men and therefore posting my blogs at night doesn't interfere much with my readers.
However, I've noticed that for me personally posting in time interval from 13:00 to 17:00 influence positively the amount of unique visitors the blog gets.

According to research done by Social Fresh – Thursday is the best day to publish an article if you want to get more Social SharesBest-Day-to-Blog-to-get-more-shares-in-social-networks

As a rule of thumb Thursday wins 10% more shares than all other days. In fact, 31% of the top 100 social share days in 2011 fell on Thursday.
My logical explanation on this phenomenon is that people tend to be more and more bored from their work and try to entertain more and more as the week progresses.

To get more attention on what I'm writting I use a bit of social networking but I prefer using only a micro blogging social networking.  I use Twitter to share what I'm into. When I write a new article on my blog I tweet its title with a link to my article, because this drives people attention to what I have to say.

In overall I am skeptical about social siting like Facebook and MySpace because it has negative impact on how people use their time and especially negative on youngsters Other reason why I don't like Friends Networks is because sharing what you have to say on sites like FB, Google+ or "The Russian Facebook" –  Vkontekte VK.com are not respecting privacy of your data.


You write free fresh content for their website for free and you get nothing!


Moreover by daily posting latest buzz you read / watched on Facebook etc. or simply saying what's happening with you, where you're situated now etc., you slowly get addicted to posting – yes for good or bad people tend to be maniacal).

By placing all of your pesronal or impersonal stuff online, you're making these sites better index their sites into Google / Yahoo / Yandex search engines and therefore making them profitable and high ranked websites on the internet and giving out your personal time for Facebook profit? + you loose control over your data (your data is not physically on your side but situated on some remote server, somewhere on the internet).
 

Best avarage time to post on Tweet Facebook, Google+ and Linkedin

best-time-and-day-to-write-new-articles-schedule-content-at-the-right-time-on-social-media-to-get-high-trafficrank

So What is Best Day timing to Post, Pin or Tweet?

Below is an infographic I fond on this blog (visual data is originalcompiled by SurePayRoll) and showing visualized results from some extensive research on the topic.

best-time-to-post-and-tweet-blog-articles-social-media-infographic


Here is most important facts this infographic reveals:


The avarage best time to post tweet and pin your new articles is about 15:00 h
 

  • Best timing to post on Twitter is on Mondays to Thursdays from 13:00 to 15:00 h
  • Best timing to post on facebook is between 13:00 and 16:00 h
  • For Linkedin it is best to place your publish between Tuesdays to Thursdays


Peak times on Facebook, Twitter and Linkedin

  • Peak times for use of Facebook is on Wednesdays about 15:00 h
  • Peak times for use of Twitter is from Monday to Thursdays from 9:00  to 15:00 h
  • Linkedin Peak time is from 17:00 to 18:00 h
  • Including images to your articles increases traffic, tweets with images increase visits, favorites and leads


Worst time (when users will probably not view your content) on FB, Twitter and Linkedin

  • Weekends before 08:00  and after 20:00 h
  • Everyday after 20:00 and Fridays after 15:00 noon
  • Mondays and Fridays from 22:00 to 06:00 morning

Facts about Google+
 

  • Google+ is the fastest growing demographic social network for people aged 45 to 54
  • Best time to share your posts on Google+ is from 09:00 to 10:00 in the morning
  • Including images to your articles increases traffic, tweets with images increase visits, favorites and leads
     

Images generate more traffic and engagement

  • Including images to your articles increases traffic, tweets with images increase visits, favorites and leads


I'm aware as every research above info on best time to tweet and post is just a generalization and according to field of information posted suggested time could be different from optiomal time for individual writer, however as a general direction, info is very useful and it gives you some idea.
Twitter engagement for brands is 17% higher on weekends according to Dan Zarrella’s research. Tweets posted on Friday, Saturday and Sunday had higher CTR (Click Through Rate) than those posted in the rest of the week.

tweet-on-the-weekends-is-better-for-high-click-through-rate

Other best day to tweet other than weekends is mid-week time Wednesday.
Whether your site or blog is using retweet to generate more traffic to website best time to retweet is said to be around 5 pm. CTR is higher

How to redirect / forward all postfix emails to one external email address?

Thursday, October 29th, 2020

Postfix_mailserver-logo-howto-forward-email-with-regular-expression-or-maildrop

Lets say you're  a sysadmin doing email migration of a Clustered SMTP and due to that you want to capture for a while all incoming email traffic and redirect it (forward it) towards another single mailbox, where you can review the mail traffic that is flowing for a few hours and analyze it more deeper. This aproach is useful if you have a small or middle sized mail servers and won't be so useful on a mail server that handels few  hundreds of mails hourly. In below article I'll show you how.

How to redirect all postfix mail for a specific domain to single external email address?

There are different ways but if you don't want to just intercept the traffic and a create a copy of email traffic using the always_bcc integrated postfix option (as pointed in my previous article postfix copy every email to a central mailbox).  You can do a copy of email flow via some custom written dispatcher script set to be run by the MTA on each mail arriva, or use maildrop filtering functionality below is very simple example with maildrop in case if you want to filter out and deliver to external email address only email targetted to specific domain.

If you use maildrop as local delivery agent to copy email targetted to specifidc domain to another defined email use rule like:

if ( /^From:.*domain\.com/:h ) {
  cc "!someothermail@domain2.com"
}


To use maildrop to just forward email incoming from a specific sender towards local existing email address on the postfix to an external email address  use something like:

if ( /^From: .*linus@mail.example.com.*/ )
{
        dotlock "forward.lock" {
          log "Forward mail"
          to "|/usr/sbin/sendmail linuxbox@collector.example.com"
        }
}

Then to make the filter active assuming the user has a physical unix mailbox, paste above to local user's  $HOME/.mailfilter.

What to do if your mail delivered via your Email-Server.com are sent from a monitoring and alarming scripts that are sending towards many mailboxes that no longer exist after the migration?

To achive capturing all normal attempted to be sent traffic via the mail server, we can forward all served mails towards a single external mail address you can use the nice capability of postfix to understand PCRE perl compatible regular expressions. Regular expressions in postfix of course has its specific I recommend you take a look to the postfix regexp table documentation here, as well as check the Postfix Regex / Tester / Debugger online tool – useful to validate a regexp you want to implement.

How to use postfix regular expression to do a redirect of all sent emails via your postfix mail relayhost towards external mail servers?


In main.cf /etc/postfix/main.cf include this line near bottom or as a last line:

virtual_maps = hash:/etc/postfix/virtual, regexp:/etc/postfix/virtual-regexp

One defines the virtual file which can be used to define any of your virtual domains you want to simulate as present on the local postfix, the regexp: does load the file which is read by postfix where you can type the regular expression applied to every incoming email via SMTP port 25 or encrypted MTA ports 385 / 995 etc.

So how to redirect all postfix mail to one external email address for later analysis?

Create file /etc/postfix/virtual-regexp

/.+@.+/ external-forward-email@gmail.com

Next build the mapfile (this will generate /etc/postfix/virtual-regexp.db )
 

# postmap /etc/postfix/virtual-regexp

This also requires a virtual.db to exist. If it doesn't create an empty file called virtual and run again postmap postfix .db generator

# touch /etc/postfix/virtual && postmap /etc/postfix/virtual


Note in /etc/postfix/virtual you can add your postfix mail domains for which you want the MTA to accept mail as a local mail.

In case you need to view all postfix defined virtual domains configured to accept mail locally on the mail server.
 

$ postconf -n | grep virtual
virtual_alias_domains = mydomain.com myanotherdomain.com
virtual_alias_maps = hash:/etc/postfix/virtual


The regexp /.+@.+/ external-forward-email@gmail.com applied will start forwarding mails immediately after you reload the MTA with:

# systemctl restart postfix


If you want to exclude target mail domains to not be captured by above regexp, in /etc/postfix/virtual-regexp place:

/.+@exclude-domain1.com/ @exclude-domain1.com
/.+@exclude-domain2.com/ @exclude-domain2.com

Time for a test. Send a test email


Next step is to Test it mail forwarding works as expected
 

# echo -e "Tseting body" | mail -s "testing subject" -r "testing@test.com" whatevertest-user@mail-recipient-domain.com

Linux show largest sized packages / Which Deb, RPM Linux installed package use most disk space and How to Free Space for critical system updates

Sunday, January 12th, 2020

linux-show-largest-sized-packages-which-deb-rpm-linux-package-use-most-disk-space-to-free-space-for-critical-system-updates

A very common problem that happens on both Linux installed servers and Desktop Linux is a starting to fill / (root partition). This problem could happen due to several reasons just to point few of them out of my experience low disk space (ending free space) could be due to:

– Improper initial partitioning / bad space planning / or OS install made in a hurry (due to time constrains)
– Linux installed on old laptop machine with low Hard Disk Drive capacity (e.g. 80 Giga / 160 GB)
– Custom user partitioning on install time aiming for a small root partition originally and changing space requirements in time
– Due to increasing space taken by Linux updates / user stored files etc / distribution OS Level upgrades dist-upgrades.
– Improperly assigned install time partitions cause of lack of knowledge to understand how partitioning is managed.
– Due to install being made in a hurry

– Linux OS installed on a Cloud based VPN (e.g. running) in a Cloud Instance that is hosted in Amazon EC2, Linode, Digital Ocean, Hostgator etc.

So here is a real time situation that happened me many times, you're launching an apt-get upgrade / apt-get dist-upgrade or yum upgrade the packages are about to start downloading or downloaded and suddenly you get a message of not enough disk space to apply OS package updates …
That's nasty stuff mostly irritating and here there are few approaches to take.

a. perhaps easiest you can ofcourse extend the partition (with a free spaced other Primary or Extended partition) with something like:

parted (the disk partitioning manipulator for Linux), gparted (in case if Desktop with GUI / XOrg server running)

b. if not enough space on the Hard Disk Drive or SSD (Solid State Drive) and you have a budget to buy and free laptop / PC slot to place another physical HDD to clone it to a larger sized HDD and use some kind of partition clone tool, such as:

or any of the other multiple clone tools available in Linux.

But what if you don't have the option for some reason to extend the paritiotn, how can you apply the Critical Security Errata Updates issued to patch security vulnerabilities reported by well known CVEs?
Well you can start with the obvious easy you can start removing unnecessery stuff from the system (if home is also stored on the / – root partiiton) to delete something from there, even delete the /usr/local/man pages if you don't plan to read it free some logs by archiving purging logs from /var/log/* …

But if this is not possible, a better approach is simply try to remove / purge any .deb / .rpm whatever distro package manager packages that are not necessery used and just hanging around, that is often the case especially on Linux installed on Notebooks for a personal home use, where with years you have installed a growing number of packages which you don't actively use but installed just to take a look, while hunting for Cool Linux games and you wanted to give a try to Battle of Wesnoth  / FreeCIV / AlienArena / SuperTux Kart / TuxRacer etc.  or some GUI heavy programs like Krita / Inskape / Audacity etc.

To select which package might be not needed and just takes space hence you need to to list all installed packages on the system ordered by their size this is different in Debian based Linuces e.g. – Debian GNU / Linux / Ubuntu / Mint etc. and RPM based ones Fedora / CentOS / OpenSuSE


1. List all RPM installed packages by Size on CentOS / SuSE
 

Finding how much space each of the installed rpm packages take on the HDD and displaying them in a sorted order is done with:

rpm -qa –queryformat '%10{size} – %-25{name} \t %{version}\n' | sort -n

From the command above,  the '%10{size}' option aligns the size of the package to the right with a padding of 10 characters. The '%-25{name} aligns the name of the package to the left, padded to 25 characters. The '%{version} indicates the version and 'sort -n' flag sorts the packages according to size from the smallest to the largest in bytes.


2. List all installed RPM packages sorted by size on Fedora

Fedora has introduced the dnf package manager instead of yum, to get how much size individual rpm package occupies on system:

dnf info samba
Available Packages
Name        : samba
Arch        : x86_64
Epoch       : 2
Version     : 4.1.20
Release     : 1.fc21
Size        : 558 k
Repo        : updates
Summary     : Server and Client software to interoperate with Windows machines
URL         : http://www.samba.org/
License     : GPLv3+ and LGPLv3+
Description : Samba is the standard Windows interoperability suite of programs
            : for Linux and Unix.


To get a list of all packages on system with their size

dnf info * | grep -i "Installed size" |sort -n


3. List all installed DEB packages on Debian / Ubuntu / Mint etc. with dpkg / aptitude / apt-get and wajig


The most simple way to get a list of largest packages is through dpkg


# dpkg-query -Wf '${Installed-Size}\t${Package}\n' | sort -n
        brscan4
6       default-jre
6       libpython-all-dev
6       libtinfo-dev
6       python-all
6       python-all-dev
6       task-cinnamon-desktop
6       task-cyrillic
6       task-desktop
6       task-english
6       task-gnome-desktop
6       task-laptop
6       task-lxde-desktop
6       task-mate-desktop
6       task-print-server
6       task-ssh-server
6       task-xfce-desktop
8       mysql-client
8       printer-driver-all


207766    libwine
215625    google-chrome-stable
221908    libwine
249401    frogatto-data
260717    linux-image-4.19.0-5-amd64
262512    linux-image-4.19.0-6-amd64
264899    mame
270589    fonts-noto-extra
278903    skypeforlinux
480126    metasploit-framework


above cmd displays packages in size order, largest package last, but the output will include also size of packages, that used to exist,
have been removed but was not purged. Thus if you find  a package that is shown as very large by size but further dpkg -l |grep -i package-name shows package as purged e.g. package state is not 'ii' but 'rc', the quickest work around is to purge all removed packages, that are still not purged and have some configuration remains and other chunks of data that just take space for nothing with:

# dpkg –list |grep "^rc" | cut -d " " -f 3 | xargs sudo dpkg –purge


Be cautious when you execute above command, because if for some reason you uninstalled a package with the idea to keep old configuration files only and in case if you decide to use it some time in future to reuse already custom made configs but do run above purge commands all such package saved kept configs will disappear.
For people who don't want to mess up with, uninstalled but present packages use this to filter out ready to be purged state packages.

# dpkg-query -Wf '${db:Status-Status} ${Installed-Size}\t${Package}\n' | sed -ne 's/^installed //p'|sort -n


aptitude – (high level ncurses interface like to package management) can also be easily used to list largest size packages eating up your hard drive in both interactive or cli mode, like so:


# aptitude search –sort '~installsize' –display-format '%p %I' '~i' | head
metasploit-framework 492 MB
skypeforlinux 286 MB
fonts-noto-extra 277 MB
mame 271 MB
linux-image-4.19.0-6-amd64 269 MB
linux-image-4.19.0-5-amd64 267 MB
frogatto-data 255 MB
libwine 227 MB
google-chrome-stable 221 MB
libwine:i386 213 MB


  • –sort is package sort order, and ~installsize specifies a package sort policy.
  • installsize means 'sort on (estimated) installed size', and the preceding ~ means sort descending (since default for all sort policies is ascending).
  • –display-format changes the <you guessed :->. The format string '%p %I' tells aptitude to output package name, then installed size.
  • '~i' tells aptitude to search only installed packages.

How much a certain .deb package removal will free up on the disk can be seen with apt-get as well to do so for the famous 3D acceleration Graphic Card (enabled) or not  test game extremetuxracer

apt-get –assume-no –purge remove "texlive*" | grep "be freed" | 
   awk '{print $4, $5}'

Perhaps,  the easiest to remember and more human readable output biggest packages occupied space on disk is to install and use a little proggie called wajig to do so


# apt install –yes wajig


Here is how to pick up 10 biggest size packages.

root@jeremiah:/home/hipo# wajig large|tail -n 10
fonts-noto-cjk-extra               204,486      installed
google-chrome-stable               215,625      installed
libwine                            221,908      installed
frogatto-data                      249,401      installed
linux-image-4.19.0-5-amd64         260,717      installed
linux-image-4.19.0-6-amd64         262,512      installed
mame                               264,899      installed
fonts-noto-extra                   270,589      installed
skypeforlinux                      278,903      installed
metasploit-framework               480,126      installed


As above example lists a short package name and no description for those who want get more in depth knowledge on what exactly is the package bundle used for use:

# aptitude search –sort '~installsize' –display-format '%30p %I %r %60d' '~i' |head


%30p %I %r %60d display more information in your format string, or change field widths, enhanced format string

Meaning of parameters is:

  • %30p : package name in field width=30 char
  • %I : estimated install size
  • %r : 'reverse depends count': approximate number of other installed packages which depend upon this package
  • %60d : package's short description in field width=60 char

wajig is capable is a python written and idea is to easify Debian console package management (so you don't have to all time remember when and with which arguments to use apt-get / apt-cache etc.), below is list of commands it accepts.


root@jeremiah:/home/hipo## wajig commands
addcdrom           Add a Debian CD/DVD to APT's list of available sources
addrepo            Add a Launchpad PPA (Personal Package Archive) repository
aptlog             Display APT log file
autoalts           Mark the Alternative to be auto-set (using set priorities)
autoclean          Remove no-longer-downloadable .deb files from the download cache
autodownload       Do an update followed by a download of all updated packages
autoremove         Remove unused dependency packages
build              Get source packages, unpack them, and build binary packages from them.
builddeps          Install build-dependencies for given packages
changelog          Display Debian changelog of a package
clean              Remove all deb files from the download cache
contents           List the contents of a package file (.deb)
dailyupgrade       Perform an update then a dist-upgrade
dependents         Display packages which have some form of dependency on the given package
describe           Display one-line descriptions for the given packages
describenew        Display one-line descriptions of newly-available packages
distupgrade        Comprehensive system upgrade
download           Download one or more packages without installing them
editsources        Edit list of Debian repository locations for packages
extract            Extract the files from a package file to a directory
fixconfigure       Fix an interrupted install
fixinstall         Fix an install interrupted by broken dependencies
fixmissing         Fix and install even though there are missing dependencies
force              Install packages and ignore file overwrites and depends
hold               Place packages on hold (so they will not be upgraded)
info               List the information contained in a package file
init               Initialise or reset wajig archive files
install            Package installer
installsuggested   Install a package and its Suggests dependencies
integrity          Check the integrity of installed packages (through checksums)
large              List size of all large (>10MB) installed packages
lastupdate         Identify when an update was last performed
listall            List one line descriptions for all packages
listalternatives   List the objects that can have alternatives configured
listcache          List the contents of the download cache
listcommands       Display all wajig commands
listdaemons        List the daemons that wajig can start, stop, restart, or reload
listfiles          List the files that are supplied by the named package
listhold           List packages that are on hold (i.e. those that won't be upgraded)
listinstalled      List installed packages
listlog            Display wajig log file
listnames          List all known packages; optionally filter the list with a pattern
listpackages       List the status, version, and description of installed packages
listscripts        List the control scripts of the package of deb file
listsection        List packages that belong to a specific section
listsections       List all available sections
liststatus         Same as list but only prints first two columns, not truncated
localupgrade       Upgrade using only packages that are already downloaded
madison            Runs the madison command of apt-cache
move               Move packages in the download cache to a local Debian mirror
new                Display newly-available packages
newdetail          Display detailed descriptions of newly-available packages
news               Display the NEWS file of a given package
nonfree            List packages that don't meet the Debian Free Software Guidelines
orphans            List libraries not required by any installed package 
policy             From preferences file show priorities/policy (available)
purge              Remove one or more packages and their configuration files
purgeorphans       Purge orphaned libraries (not required by installed packages)
purgeremoved       Purge all packages marked as deinstall
rbuilddeps         Display the packages which build-depend on the given package
readme             Display the README file(s) of a given package
recdownload        Download a package and all its dependencies
recommended        Display packages installed as Recommends and have no dependents
reconfigure        Reconfigure package
reinstall          Reinstall the given packages
reload             Reload system daemons (see LIST-DAEMONS for available daemons)
remove             Remove packages (see also PURGE command)
removeorphans      Remove orphaned libraries
repackage          Generate a .deb file from an installed package
reportbug          Report a bug in a package using Debian BTS (Bug Tracking System)
restart            Restart system daemons (see LIST-DAEMONS for available daemons)
rpm2deb            Convert an .rpm file to a Debian .deb file
rpminstall         Install an .rpm package file
search             Search for package names containing the given pattern
searchapt          Find nearby Debian package repositories
show               Provide a detailed description of package
sizes              Display installed sizes of given packages
snapshot           Generates a list of package=version for all installed packages
source             Retrieve and unpack sources for the named packages
start              Start system daemons (see LIST-DAEMONS for available daemons)
status             Show the version and available versions of packages
statusmatch        Show the version and available versions of matching packages
stop               Stop system daemons (see LISTDAEMONS for available daemons)
tasksel            Run the task selector to install groups of packages
todo               Display the TODO file of a given package
toupgrade          List versions of upgradable packages
tutorial           Display wajig tutorial
unhold             Remove listed packages from hold so they are again upgradeable
unofficial         Search for an unofficial Debian package at apt-get.org
update             Update the list of new and updated packages
updatealternatives Update default alternative for things like x-window-manager
updatepciids       Updates the local list of PCI ids from the internet master list
updateusbids       Updates the local list of USB ids from the internet master list
upgrade            Conservative system upgrade
upgradesecurity    Do a security upgrade
verify             Check package's md5sum
versions           List version and distribution of given packages
whichpackage       Search for files matching a given pattern within packages


4. List installed packages order by size in Arch Linux

ArchLinux is using the funny named package manager – pacman (a nice prank for the good old arcade game).
What is distinctive of pacman uses libalpm (Arch Linux Package Management (ALPM) library) as a back-end to perform all the actions.


# pacman -Qi | awk '/^Name/{name=$3} /^Installed Size/{print $4$5, name}' | sort -hr | head -25
296.64MiB linux-firmware
144.20MiB python
105.43MiB gcc-libs
72.90MiB python2
66.91MiB linux
57.47MiB perl
45.49MiB glibc
35.33MiB icu
34.68MiB git
30.96MiB binutils
29.95MiB grub
18.96MiB systemd
13.94MiB glib2
13.79MiB coreutils
13.41MiB python2-boto
10.65MiB util-linux
9.50MiB gnupg
8.09MiB groff
8.05MiB gettext
7.99MiB texinfo
7.93MiB sqlite
7.15MiB bash
6.50MiB lvm2
6.43MiB openssl
6.33MiB db


There is another mean to list packages by size using a ArchLinux tool called pacgraph


# pacgraph -c | head -25

Autodetected Arch.
Loading package info
Total size: 1221MB
367MB linux
144MB pacgraph
98MB cloud-init
37MB grub
35MB icu
34MB git
31698kB binutils
19337kB pacman
11029kB man-db
8186kB texinfo
8073kB lvm2
7632kB nano
7131kB openssh
5735kB man-pages
3815kB xfsprogs
3110kB sudo
3022kB wget
2676kB tar
2626kB netctl
1924kB parted
1300kB procps-ng
1248kB diffutils


4. Debian Goodies


Most debian users perhaps never hear of debian-goodies package, but I thought it is worthy to mention it as sooner or later as a sysadmin or .deb based Desktop user it might help you somewhere.
 

Debian-goodies is sall toolbox-style utilities for Debian systems
 These programs are designed to integrate with standard shell tools,
 extending them to operate on the Debian packaging system.

 .
  dglob  – Generate a list of package names which match a pattern
           [dctrl-tools, apt*, apt-file*, perl*]
  dgrep  – Search all files in specified packages for a regex
           [dctrl-tools, apt-file (both via dglob)]
 .
 These are also included, because they are useful and don't justify
 their own packages:
 .
  check-enhancements
 
           – find packages which enhance installed packages [apt,
                dctrl-tools]
  checkrestart
 
           – Help to find and restart processes which are using old versions
               of upgraded files (such as libraries) [python3, procps, lsof*]
  debget     – Fetch a .deb for a package in APT's database [apt]
  debman     – Easily view man pages from a binary .deb without extracting
               [man, apt* (via debget)]
  debmany    – Select manpages of installed or uninstalled packages [man |
               sensible-utils, whiptail | dialog | zenity, apt*, konqueror*,
               libgnome2-bin*, xdg-utils*]
  dhomepage  – Open homepage of a package in a web browser [dctrl-tools,
               sensible-utils*, www-browser* | x-www-browser*]
  dman       – Fetch manpages from online manpages.debian.org service [curl,
               man, lsb-release*]
  dpigs      – Show which installed packages occupy the most space
               [dctrl-tools]
  find-dbgsym-packages
             – Get list of dbgsym packages from core dump or PID [dctrl-tools,
               elfutils, libfile-which-perl, libipc-system-simple-perl]
  popbugs    – Display a customized release-critical bug list based on
               packages you use (using popularity-contest data) [python3,
               popularity-contest]
  which-pkg-broke
             – find which package might have broken another [python3, apt]
  which-pkg-broke-build
             – find which package might have broken the build of another
               [python3 (via which-pkg-broke), apt]

Even simpler by that is to use dpigs shell script part of the debian-goodies package which will automatically print out the largest packages.

dpigs command output is exactly the same as 'dpkg-query -Wf '${Installed-Size}\t${Package}\n' | sort -nr | head', but is useful cause you don't have to remember that complex syntax.


5. Checking where your space is gone in a Spacesniffer like GUI manner with Baobab


In my prior article Must have software on a new installed Windows 2 of the  of the precious tools to set are Spacesniffer and WinDirStat.
Windows users will be highly delighted to know that SpaceSniffer equivallent is already present on Linux – say hello baobab.
Baobab
is simple but useful Graphic disk usage overview program for those who don't want to mess to much with the console / terminal to find out which might be the possible directory candidate for removal. It is very simplistic but it does well what it is aimed for, to install it on a Debian or .deb based OS.

# apt install –yes baobab


baobab-entry-screen-debian-gnu-linux-screenshot

baobab Linux Hard Disk Usage Analyzer for GNOME. – It can easily scan either the whole filesystem or a specific user-requested branch (Iocal or remote)


baobab-entry-screen-debian-gnu-linux-directories-taking-most-space-pie-screenshot

Baobab / (root) directory statistics Rings Chart pie


baobab-entry-screen-debian-gnu-linux-disk-space-by-size-visualized-screenshot

baobab – Treemap Chart for directory usage sorted by size on disk 

!!! Note that before removing any files found as taking up too much space with baobab – make sure this files are not essential parts of a .deb package first, otherwise you might break up your system !!!

KDE (Plasma) QT library users could use Qdirstat instead of baobab 

qdirstat-on-gnu-linur checking what is the disk space bottleneck qdirstat KDE


6. Use ncdu or duper perl script tool to generate directory disk usage in ASCII chart bar

ncdu and duper are basicly the same except one is using ncurses and is interactive in a very simplistic interface with midnight commander.
 

# apt install –yes ncdu
# ncdu /root


ncdu-gnu-linux-debian-screenshot


# apt-get install –yes durep
# durep -td 1 /usr

[ /usr    14.4G (0 files, 11 dirs) ]
   6.6G [#############                 ]  45.54% lib/
   5.5G [###########                   ]  38.23% share/
   1.1G [##                            ]   7.94% bin/
 552.0M [#                             ]   3.74% local/
 269.2M [                              ]   1.83% games/
 210.4M [                              ]   1.43% src/
  88.9M [                              ]   0.60% libexec/
  51.3M [                              ]   0.35% sbin/
  41.2M [                              ]   0.28% include/
   8.3M [                              ]   0.06% lib32/
 193.8K [                              ]   0.00% lib64/


Conclusion


In this article, I've shortly explained the few approach you can take to handle low disk space preventing you to update a regular security updates on Linux.
The easiest one is to clone your drive to a bigger (larger) sized SATA HDD or SDD Drive or using a free space left on a hard drive to exnted the current filling up the root partition. 

Further, I looked through the common reasons for endind with a disk being low spaced and a quick work around to free disk space through listing and purging larges sized package, this is made differently in different Linux distributions, because different Linux has different package managers. As I'm primary using Debian, I explained thoroughfully on how this is achieved with apt-get / dpkg-query / dpkg / aptitude and the little known debian-goodies .deb package manager helper pack. For GUI Desktop users there is baobab / qdirstat. ASCII lovers could enjoy durep and ncdu.

That's all folks hope you enjoyed and learned something new. If you know of other cool tools or things this article is missing please share.