Archive for the ‘Zabbix’ Category

Zabbix script to track arp address cache loss (arp incomplete) from Linux server to gateway IP

Tuesday, January 30th, 2024

Zabbix_arp-network-incomplete-check-logo.svg

Some of the Linux servers recently, I'm responsible had a very annoying issue recently. The problem is ARP address to default configured server gateway is being lost, every now and then and it takes up time, fot the remote CISCO router to realize the problem and resolve it. We have debugged with the Network expert colleague, while he was checking the Cisco router and we were checking the arp table on the Linux server with arp command. And we came to conclusion this behavior is due to some network mess because of too many NAT address configurations on the network or due to a Cisco bug. The colleagues asked Cisco but cisco does not have any solution to the issue and the only close work around for the gateway loosing the mac is to set a network rule on the Cisco router to flush its arp record for the server it was loosing the MAC address for.
This does not really solve completely the problem but at least, once we run into the issue, it gets resolved as quick as 5 minutes time. }

As we run a cluster environment it is useful to Monitor and know immediately once we hit into the MAC gateway disappear issue and if the issue persists, exclude the Linux node from the Cluster so we don't loose connection traffic.
For the purpose of Monitoring MAC state from the Linux haproxy machine towards the Network router GW, I have developed a small userparameter script, that is periodically checking the state of the MAC address of the IP address of remote gateway host and log to a external file for any problems with incomplete MAC address of the Remote configured default router.

In case if you happen to need the same MAC address state monitoring for your servers, I though that might be of a help to anyone out there.
To monitor MAC address incomplete state with Zabbix, do the following:
 

1. Create  userparamater_arp_gw_check.conf Zabbix script
 

# cat userparameter_arp_gw_check.conf 
UserParameter=arp.check,/usr/local/bin/check_gw_arp.sh


2. Create the following shell script /usr/local/bin/check_gw_arp.sh


#!/bin/bash
# simple script to run on cron peridically or via zabbix userparameter
# to track arp loss issues to gateway IP
#gw_ip='192.168.0.55';
gw_ip=$(ip route show|grep -i default|awk '{ print $3 }');
log_f='/var/log/arp_incomplete.log';
grep_word='incomplete';
inactive_status=$(arp -n "$gw_ip" |grep -i $grep_word);
# if GW incomplete record empty all is ok
if [[ $inactive_status == ” ]]; then 
echo $gw_ip OK 1; 
else 
# log inactive MAC to gw_ip
echo "$(date '+%Y-%m-%d %H:%M:%S')" "ARP_ERROR $inactive_status 0" | tee -a $log_f 2>&1 >/dev/null;
# printout to zabbix
echo "1 ARP FAILED: $inactive_status"; 
fi

You can download the check_gw_arp.sh here.

The script is supposed to automatically grep for the Default Gateway router IP, however before setting it up. Run it and make sure this corresponds correctly to the default Gateway IP MAC you would like to monitor.
 

3. Create New Zabbix Template for ARP incomplete monitoring
 

arp-machine-to-default-gateway-failure-monitoring-template-screenshot

Create Application 

*Name
Default Gateway ARP state

4. Create Item and Dependent Item 
 

Create Zabbix Item and Dependent Item like this

arp-machine-to-default-gateway-failure-monitoring-item-screenshot


arp-machine-to-default-gateway-failure-monitoring-item1-screenshot

arp-machine-to-default-gateway-failure-monitoring-item2-screenshot


5. Create Trigger to trigger WARNING or whatever you like
 

arp-machine-to-default-gateway-failure-monitoring-trigger-screenshot


arp-machine-to-default-gateway-failure-monitoring-trigger1-screenshot

arp-machine-to-default-gateway-failure-monitoring-trigger2-screenshot


6. Create Zabbix Action to notify via Email etc.
 

arp-machine-to-default-gateway-failure-monitoring-action1-screenshot


arp-machine-to-default-gateway-failure-monitoring-action2-screenshot

That's all. Once you set up this few little things, you can enjoy having monitoring Alerts for your ARP state incomplete on your Linux / Unix servers.
Enjoy !

How to monitor Postfix Mail server work correct with simple one liner Zabbix user parameter script / Simple way to capture and report SMTP machine issues Zabbix template

Thursday, June 22nd, 2023

setup-zabbix-smtp-mail-monitoring-postfix-qmail-exim-with-easy-userparameter-script-and-template-zabbix-logo

In this article, I'm going to show you how to setup a very simple monitoring if a local running SMTP (Postfix / Qmail / Exim) is responding correctly on basic commands. The check would helpfully keep you in track to know whether your configured Linux server local MTA (Mail Transport Agent) is responding on requests on TCP / IP protocol Port 25, as well as a check for process existence of master (that is the main postfix) proccess, as well as the usual postfix spawned sub-processes qmgr (the postfix queue manager), tsl mgr (TLS session cache and PRNG manager), pickup (Postfix local mail pickup) – or email receiving process.


Normally a properly configured postfix installation on a Linux whatever you like distribution would look something like below:

#  ps -ef|grep -Ei 'master|postfix'|grep -v grep
root        1959       1  0 Jun21 ?        00:00:00 /usr/libexec/postfix/master -w
postfix     1961    1959  0 Jun21 ?        00:00:00 qmgr -l -t unix -u
postfix     4542    1959  0 Jun21 ?        00:00:00 tlsmgr -l -t unix -u
postfix  2910288    1959  0 11:28 ?        00:00:00 pickup -l -t unix -u

At times, during mail server restarts the amount of processes that are sub spawned by postfix, may very and if you a do a postfix restart

# systemctl restart postfix

The amout of spawned processes running as postfix username might decrease, and only qmgr might be available for second thus in the consequential shown Template the zabbix processes check to make sure the Postfix is properly operational on the Linux machine is made to check for the absolute minumum of 

1. master (postfix process) that runs with uid root
2. and one (postfix) username binded proccess 

If the amount of processes on the host is less than this minimum number and the netcat is unable to simulate a "half-mail" sent, the configured Postfix alarm Action (media and Email) will take place, and you will get immediately notified, that the monitored Mail server has issue!

The idea is to use a small one liner connection with netcat and half simulate a normal SMTP transaction just like you would normally do:


root@pcfrxen:/root # telnet localhost 25
Trying 127.0.0.1…
Connected to localhost.
Escape character is '^]'.
220 This is Mail2 Pc-Freak.NET ESMTP
HELO localhost
250 This is Mail2 Pc-Freak.NET
MAIL FROM:<hipopo@pc-freak.net>
250 ok
RCPT TO:<hip0d@remote-smtp-server.com>


and then disconnect the connection.

1. Create new zabbix userparameter_smtp_check.conf file

The simple userparameter one liner script to do the task looks like this:

# vi /etc/zabbix/zabbix_agent.d/userparameter_smtp_check.conf

UserParameter=smtp.check,(if [[ $(echo -e “HELO localhost\n MAIL FROM: root@$HOSTNAME\n RCPT TO: report-email@your-desired-mail-server.com\n  QUIT\n” | /usr/bin/nc localhost 25 -w 5 2>&1 | grep -Ei ‘220\s.*\sESMTP\sPostfix|250\s\.*|250\s\.*\sOk|250\s\.*\sOk|221\.*\s\w’|wc -l) == ‘5’ ]]; then echo "SMTP OK 1"; else echo "SMTP NOK 0"; fi)

Set the proper permissions so either file is owned by zabbix:zabbix or it is been able to be read from all system users.
 

# chmod a+r /etc/zabbix/zabbix_agent.d/userparameter_smtp_check.conf

2. Create a new Template for the Mail server monitoring


Just like any other template name it with what fits you as you see, I've call it PROD SMTP Monitoring, as the template is prepared to specifically monitor In Production Linux machines, and a separate template is used to monitor the Quality Assurance (QAs) as well as PreProd (Pre Productions).

3. Create the followng Items and Depedent Item to process zabbix-agent received data from the Userparam script
 

Above is the list of basic Items and Dependent Item you will need to configure inside the SMTP Check zabbix Template.

The Items should have the following content and configurations:
 

/postfix-main-proc-service-item-zabbix-shot


*Name: postfix_main_proc.service
Type: Zabbix agent(active)
*Key: proc.num[master,root]
Type of Information: Numeric (unassigned)
*Update interval: 30s
Custom Intervals: Flexible
*History storage period: 90d
*Trend storage period: 365d
Show Value: as is
Applications: Postfix Checks
Populated host inventory field: -None-
Description: The item counts master daemon process that runs Postfix daemons on demand

Where the arguments pased to proc.num[] function are:
  master is the process that is being looked up for and root is the username with which the the postfix master daemon is running. If you need to adapt it for qmail or exim that shouldn't be a big deal you only have to in advance check the exact processes that are normally running on the machine
and configure a similar process check for it.

*Name: postfix_sub_procs.service_cnt
Type: Zabbix agent(active)
*Key: proc.num[,postfix]
Type of information: Numeric (unassigned)
Update Interval: 30s
*History Storage period: Storage Period 90d
*Trend storage period: Storage Period 365d
Description: The item counts master daemon processes that runs postfix daemons on demand.

Here the idea with this Item is to check the number of processes that are running with user / groupid that is postfix. Again for other SMPT different from postfix, just set it to whatever user / group 
you would like zabbix to look up for in Linux the process list. As you can see here the check for existing postfix mta process is done every 30 seconds (for more critical environments you can put it to less).

For simple zabbix use this Dependent Item is not necessery required. But as we would like to process more closely the output of the userparameter smtp script, you have to set it up.
If you want to write graphical representation by sending data to Grafana.

*Name: postfix availability check
Key: postfix_boolean_check[boolean]
Master Item: PROD SMTP Monitoring: postfix availability check
Type of Information: Numeric unassigned
*History storage period: Storage period 90d
*Trend storage period: 365d

Applications: Postfix Checks

Description: It returns boolean value of SMTP check
1 – True (SMTP is OK)
0 – False (SMTP does not responds)

Enabled: Tick

*Name: postfix availability check
*Key: smtp.check
Custom intervals: Flexible
*Update interval: 30 m
History sotrage period: Storage Period 90d
Applications: Postfix Checks
Populates host inventory field: -None-
Description: This check is testing if the SMTP relay is reachable, without actual sending an email
Enabled: Tick

4. Configure following Zabbix Triggers


Note: The severity levels you should have previosly set in Zabbix up to your desired ones.

Name: postfix master root process is not running
*Problem Expression: {PROD SMTP Monitoring:proc.num[master,root].last()}<1

OK event generation: Recovery expression
*Recovery Expression: {PROD SMTP Monitoring:proc.num[master,root].last()}>=1
Allow manual close: Tick

Description: The item counts master daemon process that runs Postfix daemon on demand.
Enabed: Tick

I would like to have an AUTO RESOLVE for any detected mail issues, if an issue gets resolved. That is useful especially if you don't have the time to put the Zabbix monitoring in Maintainance Mode during Operating system planned updates / system reboots or unexpected system reboots due to electricity power loss to the server colocated – Data Center / Rack . 


*Name: postfix master sub processes are not running
*Problem Expression: {P09 PROD SMTP Monitoring:proc.num[,postfix].last()}<1
PROBLEM event generation mode: Single
OK event closes: All problems

*Recovery Expression: {P09 PROD SMTP Monitoring:proc.num[,postfix].last()}>=1
Problem event generation mode: Single
OK event closes: All problems
Allow manual close: Tick
Enabled: Tick

Name: SMTP connectivity check
Severity: WARNING
*Expression: {PROD SMTP Monitoring:postfix_boolen_check[boolean].last()}=0
OK event generation: Expression
PROBLEM even generation mode: SIngle
OK event closes: All problems

Allow manual close: Tick
Enabled: Tick

5. Configure respective Zabbix Action


zabbix-configure-Actions-screenshotpng
 

As the service is tagged with 'pci service' tag we define the respective conditions and according to your preferences, add as many conditions as you need for the Zabbix Action to take place.

NOTE! :
Assuming that communication chain beween Zabbix Server -> Zabbix Proxy (if zabbix proxy is used) -> Zabbix Agent works correctly you should start receiving that from the userparameter script in Zabbix with the configured smtp.check userparam key every 30 minutes.

Note that this simple nc check will keep a trail records inside your /var/log/maillog for each netcat connection, so keep in mind that in /var/log/maillog on each host which has configured the SMTP Check zabbix template, you will have some records  similar to:

# tail -n 50 /var/log/maillog
2023-06-22T09:32:18.164128+02:00 lpgblu01f postfix/smtpd[2690485]: improper command pipelining after HELO from localhost[127.0.0.1]:  MAIL FROM: root@your-machine-fqdn-address.com\n RCPT TO: your-supposable-receive-addr@whatever-mail-address.com\n  QUIT\n
2023-06-22T09:32:18.208888+02:00 lpgblu01f postfix/smtpd[2690485]: 32EB02005B: client=localhost[127.0.0.1]
2023-06-22T09:32:18.209142+02:00 lpgblu01f postfix/smtpd[2690485]: disconnect from localhost[127.0.0.1] helo=1 mail=1 rcpt=1 quit=1 commands=4
2023-06-22T10:02:18.889440+02:00 lpgblu01f postfix/smtpd[2747269]: connect from localhost[127.0.0.1]
2023-06-22T10:02:18.889553+02:00 lpgblu01f postfix/smtpd[2747269]: improper command pipelining after HELO from localhost[127.0.0.1]:  MAIL FROM: root@your-machine-fqdn-address.com\n RCPT TO: your-supposable-receive-addr@whatever-mail-address.com\n  QUIT\n
2023-06-22T10:02:18.933933+02:00 lpgblu01f postfix/smtpd[2747269]: E3ED42005B: client=localhost[127.0.0.1]
2023-06-22T10:02:18.934227+02:00 lpgblu01f postfix/smtpd[2747269]: disconnect from localhost[127.0.0.1] helo=1 mail=1 rcpt=1 quit=1 commands=4
2023-06-22T10:32:26.143282+02:00 lpgblu01f postfix/smtpd[2804195]: connect from localhost[127.0.0.1]
2023-06-22T10:32:26.143439+02:00 lpgblu01f postfix/smtpd[2804195]: improper command pipelining after HELO from localhost[127.0.0.1]:  MAIL FROM: root@your-machine-fqdn-address.com\n RCPT TO: your-supposable-receive-addr@whatever-mail-address.com\n  QUIT\n
2023-06-22T10:32:26.186681+02:00 lpgblu01f postfix/smtpd[2804195]: 2D7F72005B: client=localhost[127.0.0.1]
2023-06-22T10:32:26.186958+02:00 lpgblu01f postfix/smtpd[2804195]: disconnect from localhost[127.0.0.1] helo=1 mail=1 rcpt=1 quit=1 commands=4
2023-06-22T11:02:26.924039+02:00 lpgblu01f postfix/smtpd[2860398]: connect from localhost[127.0.0.1]
2023-06-22T11:02:26.924160+02:00 lpgblu01f postfix/smtpd[2860398]: improper command pipelining after HELO from localhost[127.0.0.1]:  MAIL FROM: root@your-machine-fqdn-address.com\n RCPT TO: your-supposable-receive-addr@whatever-mail-address.com\n  QUIT\n
2023-06-22T11:02:26.963014+02:00 lpgblu01f postfix/smtpd[2860398]: EB08C2005B: client=localhost[127.0.0.1]
2023-06-22T11:02:26.963257+02:00 lpgblu01f postfix/smtpd[2860398]: disconnect from localhost[127.0.0.1] helo=1 mail=1 rcpt=1 quit=1 commands=4
2023-06-22T11:32:29.145553+02:00 lpgblu01f postfix/smtpd[2916905]: connect from localhost[127.0.0.1]
2023-06-22T11:32:29.145664+02:00 lpgblu01f postfix/smtpd[2916905]: improper command pipelining after HELO from localhost[127.0.0.1]:  MAIL FROM: root@your-machine-fqdn-address.com\n RCPT TO: your-supposable-receive-addr@whatever-mail-address.com\n  QUIT\n
2023-06-22T11:32:29.184539+02:00 lpgblu01f postfix/smtpd[2916905]: 2CF7D2005B: client=localhost[127.0.0.1]
2023-06-22T11:32:29.184729+02:00 lpgblu01f postfix/smtpd[2916905]: disconnect from localhost[127.0.0.1] helo=1 mail=1 rcpt=1 quit=1 commands=4


That's all folks use the :
Configuration -> Host (menu)

and assign the new SMTP check template to as many of the Linux hosts where you have setup the Userparameter script and Enjoy the new mail server monitoring at hand.

Install specific zabbix-agent version / Downgrade Zabbix Agent client to exact preferred old RPM version on CentOS / Fedora / RHEL Linux from repo

Wednesday, June 7th, 2023

zabbix-update-downgrade-on-centos-rhel-fedora-and-other-rpm-based-linux-zabbix-logo


In below article, I'll give you the short Update zabbix procedure to specific version release, if you need to have it running in tandem with rest of zabbix infra, as well as expain shortly how to downgrade zabbix version to a specific release number
to match your central zabbix-serveror central zabbix proxies.

The article is based on personal experience how to install / downgrade the specific zabbuix-agent  release on RPM based distros.
I know this is pretty trivial stuff but still, hope this might be useful to some sysadmin out there thus I decided to quickly blog it.


1. Prepare backup of zabbix_agentd.conf
 

cp -rpf /etc/zabbix/zabbix_agentd.conf /home/your-user/zabbix_agentd.conf.bak.$(date +"%b-%d-%Y")


2. Create zabbix repo source file in yum.repos.d directory

cd /etc/yum.repos.d/
vim zabbix.repo 


[zabbix-5.0]

name=Zabbix 5.0 repo

baseurl=http://zabixx-rpm-mirrors-site.com/centos/external/zabbix-5.0/8/x86_64/

enabled=1

gpgcheck=0


3. Update zabbix-agent to a specific defined version

yum search zabbix-agent –enablerepo zabbix-5.0

To update zabbix-agent for RHEL 7.*

# yum install zabbix-agent-5.0.34-1.el7.x86_64


For RHEL 8.*

# yum install zabbix-agent-5.0.34-1.el8.x86_64


4. Restart zabbix-agentd and check its status to make sure it works correctly
 

systemctl status zabbix-agentd
systemctl restart zabbix-agentd
# systemctl status zabbix-agentd


Go to zabbix-server WEB GUI interface and check that data is delivered as normally in Latest Data for the host fom recent time, to make sure host monitoring is continuing flawlessly as before change.

NB !: If yum use something like versionlock is enabled remove the versionlock for package and update then, otherwise it will (weirldly look) look like the package is missing.
I'm saying that because I've hit this issue and was wondering why i cannot install the zabbix-agent even though the version is listed, available and downloadable from the repository.


5. Downgrade agent-client to specific version (Install old version of Zabbix from Repo)
 

Sometimes by mistake you might have raised the Zabbix-agent version to be higher release than the zabbix-server's version and thus breach out the Zabbix documentation official recommendation to keep
up the zabbix-proxy, zabbix-server and zabbix-agent at the exactly same version major and minor version releases. 

If so, then you would want to decrease / downgrade the version, to match your Zabbix overall infrastructure exact version for each of Zabbix server -> Zabbix Proxy server -> Agent clients.

To downgrade the version, I prefer to create some backups, just in case for all /etc/zabbix/ configurations and userparameter scripts (from experience this is useful as sometimes some RPM binary update packages might cause /etc/zabbix/zabbix_agentd.conf file to get overwritten. To prevent from restoring zabbix_agentd.conf from your most recent backup hence, I prefer to just crease the zabbix config backups manually.
 

# cd /root

# mkdir -p /root/backup/zabbix-agent 

# tar -czvf zabbix_agent.tar.gz /etc/zabbix/

# tar -xzvf zabbix_agent.tar.gz 


Then list the available installable zabbix-agent versions
 

[root@sysadminshelp:~]# yum –showduplicates list zabbix-agent
Заредени плъгини: fastestmirror
Determining fastest mirrors
 * base: centos.uni-sofia.bg
 * epel: fedora.ipacct.com
 * extras: centos.uni-sofia.bg
 * remi: mirrors.uni-ruse.bg
 * remi-php74: mirrors.uni-ruse.bg
 * remi-safe: mirrors.uni-ruse.bg
 * updates: centos.uni-sofia.bg
Инсталирани пакети
zabbix-agent.x86_64                                                     5.0.30-1.el7                                                     @zabbix
Налични пакети
zabbix-agent.x86_64                                                     5.0.0-1.el7                                                      zabbix
zabbix-agent.x86_64                                                     5.0.1-1.el7                                                      zabbix
zabbix-agent.x86_64                                                     5.0.2-1.el7                                                      zabbix
zabbix-agent.x86_64                                                     5.0.3-1.el7                                                      zabbix
zabbix-agent.x86_64                                                     5.0.4-1.el7                                                      zabbix
zabbix-agent.x86_64                                                     5.0.5-1.el7                                                      zabbix
zabbix-agent.x86_64                                                     5.0.6-1.el7                                                      zabbix
zabbix-agent.x86_64                                                     5.0.7-1.el7                                                      zabbix
zabbix-agent.x86_64                                                     5.0.8-1.el7                                                      zabbix
zabbix-agent.x86_64                                                     5.0.9-1.el7                                                      zabbix
zabbix-agent.x86_64                                                     5.0.10-1.el7                                                     zabbix
zabbix-agent.x86_64                                                     5.0.11-1.el7                                                     zabbix
zabbix-agent.x86_64                                                     5.0.12-1.el7                                                     zabbix
zabbix-agent.x86_64                                                     5.0.13-1.el7                                                     zabbix
zabbix-agent.x86_64                                                     5.0.14-1.el7                                                     zabbix
zabbix-agent.x86_64                                                     5.0.15-1.el7                                                     zabbix
zabbix-agent.x86_64                                                     5.0.16-1.el7                                                     zabbix
zabbix-agent.x86_64                                                     5.0.17-1.el7                                                     zabbix
zabbix-agent.x86_64                                                     5.0.18-1.el7                                                     zabbix
zabbix-agent.x86_64                                                     5.0.19-1.el7                                                     zabbix
zabbix-agent.x86_64                                                     5.0.20-1.el7                                                     zabbix
zabbix-agent.x86_64                                                     5.0.21-1.el7                                                     zabbix
zabbix-agent.x86_64                                                     5.0.22-1.el7                                                     zabbix
zabbix-agent.x86_64                                                     5.0.23-1.el7                                                     zabbix
zabbix-agent.x86_64                                                     5.0.24-1.el7                                                     zabbix
zabbix-agent.x86_64                                                     5.0.25-1.el7                                                     zabbix
zabbix-agent.x86_64                                                     5.0.26-1.el7                                                     zabbix
zabbix-agent.x86_64                                                     5.0.27-1.el7                                                     zabbix
zabbix-agent.x86_64                                                     5.0.28-1.el7                                                     zabbix
zabbix-agent.x86_64                                                     5.0.29-1.el7                                                     zabbix
zabbix-agent.x86_64                                                     5.0.30-1.el7                                                     zabbix
zabbix-agent.x86_64                                                     5.0.31-1.el7                                                     zabbix
zabbix-agent.x86_64                                                     5.0.32-1.el7                                                     zabbix
zabbix-agent.x86_64                                                     5.0.33-1.el7                                                     zabbix
zabbix-agent.x86_64                                                     5.0.34-1.el7                                                     zabbix


Next lets install the most recent zabbix-versoin from the CentOS repo, which for me as of time of writting this article is 5.0.34.

# yum downgrade -y zabbix-agent-5.0.34-1.el7

# cp -rpf /root/backup/zabbix-agent/etc/zabbix/zabbix_agentd.conf /etc/zabbix/

# systemctl start zabbix-agent.service

# systemctl enable  zabbix-agent.service
 

# zabbix_agentd -V
zabbix_agentd (daemon) (Zabbix) 5.0.30
Revision 2c96c38fb4b 28 November 2022, compilation time: Nov 28 2022 11:27:43

Copyright (C) 2022 Zabbix SIA
License GPLv2+: GNU GPL version 2 or later <https://www.gnu.org/licenses/>.
This is free software: you are free to change and redistribute it according to
the license. There is NO WARRANTY, to the extent permitted by law.

This product includes software developed by the OpenSSL Project
for use in the OpenSSL Toolkit (http://www.openssl.org/).

Compiled with OpenSSL 1.0.1e-fips 11 Feb 2013
Running with OpenSSL 1.0.1e-fips 11 Feb 2013


That's all folks you should be at your custom selected preferred version of zabbix-agent.
Enjoy ! 🙂

Install Zabbix Proxy configure and connect to Zabbix server on CentOS Linux

Thursday, May 4th, 2023

Install Zabbix Proxy configure and connect to Zabbix server on CentOS Linux

1. Why use Zabbix-Proxy hidden advantages of using Zabbix-Proxy ?
 

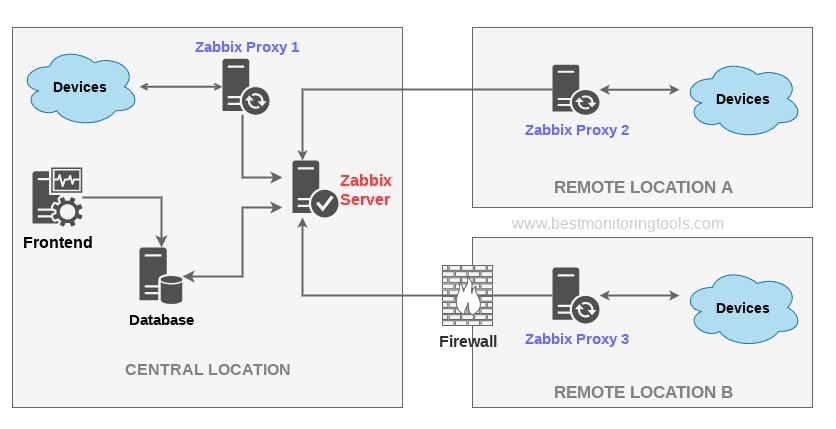
Proxy can be used for many purposes and can provide many hidden benefits, just to name few of them:

  • Offload Zabbix Server when monitoring thousands of devices
  • Monitor remote locations
  • Monitor locations having unreliable communications
  • Simplify maintenance of distributed monitoring
  • Improved Security (Zabbix server can be restricted to be connectable only by the set of connected Zabbix Proxy / Proxies


advantages-of-using-zabbix-proxy-instead-of-direct-connect-monitored-hosts-to-zabbix-server-diagram


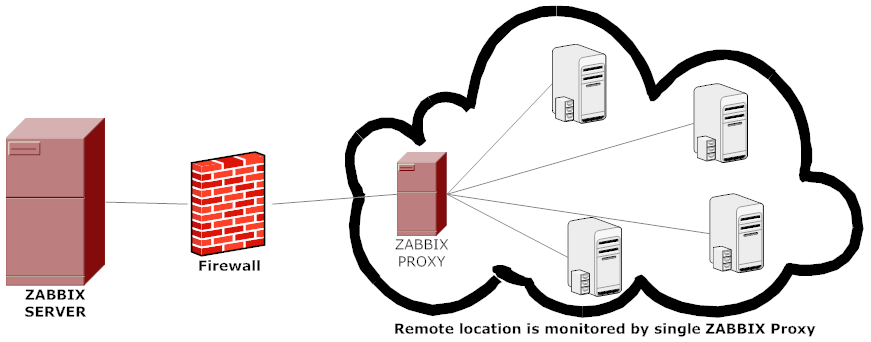
A Zabbix proxy is the ideal solution if you have numerous hosts with multiple slow items that are affecting the performance of the server simply because processes are spending most of the time simply waiting for a response. A proxy can collect information from all hosts using its internal processes and then send raw historical data to the server. The time needed to connect and receive the host response will be on the proxy site, and the server performance will not be affected at all. A proxy just sends raw values to the server, and the server itself does not have to connect to the host to get the data.
 

2. Install zabbix-proxy-sqlite3 rpm package from Zabbix Official Repositories download page

Zabbix repository provides choice of 3 packages named as follows:

zabbix-proxy-mysql
zabbix-proxy-pgsql
zabbix-proxy-sqlite3

where the last value of the name (after zabbix-proxy) represents database type of the package — MySQL, PostgreSQL and SQLite respectively.

To not bother installing MySQL / PostgreSQL separate database servers, a lightweight choice is to use the sqlite3 db version. 
As I prefer zabbix-proxy data to be stored inside a flat database, thus I choose to use zabbix-proxy-sqlite3.

[root@sysadminshelp:/root ]# yum info zabbix-proxy-sqlite3-5.0.31-1.el7.x86_64
Заредени плъгини: fastestmirror
Loading mirror speeds from cached hostfile
 * base: mirrors.netix.net
 * epel: fedora.ipacct.com
 * extras: mirrors.netix.net
 * remi: remi.mirror.karneval.cz
 * remi-php74: remi.mirror.karneval.cz
 * remi-safe: remi.mirror.karneval.cz
 * updates: mirrors.netix.net
Инсталирани пакети
Име         : zabbix-proxy-sqlite3
Архитект.   : x86_64
Версия      : 5.0.31
Издание     : 1.el7
Обем        : 4.4 M
Хранилище   : installed
Обобщение   : Zabbix proxy for SQLite3 database
URL         : http://www.zabbix.com/
Лиценз      : GPLv2+
Описание    : Zabbix proxy with SQLite3 database support.

My experience to try to install thethe default CentOS RPM package for zabbix-proxy-sqlite3 provided by default
RPM package that came with CentOS did not work as expected and trying to install / configure and use it via

[root@sysadminshelp:/root ]# yum install zabbix-proxy-sqlite3.x86_64 -y

[root@sysadminshelp:/root ]# vi /etc/zabbix/zabbix_proxy.conf


Led me to a nasty errors seen in /var/log/zabbixsrv/zabbix_proxy.log like:

May 1st 2023, 08:42:45.020 zabbix_server cannot set list of PSK ciphersuites: file ssl_lib.c line 1314: error:1410D0B9:SSL routines:SSL_CTX_set_cipher_list:no cipher match
May 1st 2023, 08:42:45.018 zabbix_server cannot set list of PSK ciphersuites: file ssl_lib.c line 1314: error:1410D0B9:SSL routines:SSL_CTX_set_cipher_list:no cipher match
May 1st 2023, 08:42:45.013 zabbix_server cannot set list of PSK ciphersuites: file ssl_lib.c line 1314: error:1410D0B9:SSL routines:SSL_CTX_set_cipher_list:no cipher match
May 1st 2023, 08:42:45.011 zabbix_server cannot set list of PSK ciphersuites: file ssl_lib.c line 1314: error:1410D0B9:SSL routines:SSL_CTX_set_cipher_list:no cipher match


After some googling and reading some threads came upon this one https://support.zabbix.com/browse/ZBXNEXT-3604, there is exmplaed errors preventing the configured zabbix-proxy
to start are caused by the zabbix-proxy-sqlite3 package provided by Redhat (due to openssl incompitability bug or something ).

As one of people in the discussion pointed out the quickest workaround suggested is simply to use the official Zabbix Repository packages for zabbix-proxy-sqlite3, in order to not waste anymore time on this
trivial stuff to install it, simply run:

[root@sysadminshelp:/root ]# rpm -Uvh \
https://repo.zabbix.com/zabbix/5.0/rhel/7/x86_64/zabbix-proxy-sqlite3-5.0.31-1.el7.x86_64.rpm

Alternative way if you seem to not have the machine connected to the internet is simply download the package with wget / lynx / curl / w3m from another machine 
that can reach the Internet upload the package via the local LAN or VPN and install it:

# wget https://repo.zabbix.com/zabbix/5.0/rhel/7/x86_64/zabbix-proxy-sqlite3-5.0.31-1.el7.x86_64.rpm

[root@sysadminshelp:/root ]# rpm -ivh zabbix-proxy-sqlite3-5.0.31-1.el7.x86_64.rpm

NOTE ! Before you install proxy, keep in mind that your proxy version must match the Zabbix server version !

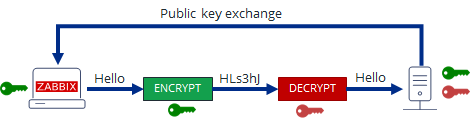
3. Generate a PSK random secret key and set proper permissions for zabbix-proxy directories


[root@sysadminshelp:/root ]# cd /etc/zabbix/
    
[root@sysadminshelp:/root ]# openssl rand -hex 32 >> /etc/zabbix/zabbix_proxy.psk     
[root@sysadminshelp:/root ]# chown root:zabbix zabbix_proxy.psk [root@sysadminshelp:/root ]# vi /etc/zabbix/zabbix_proxy.conf [root@sysadminshelp:/root ]# mkdir -p /var/lib/zabbix-proxy/sqlite3db
[root@sysadminshelp:/root ]# chown -R zabbix:zabbix /var/lib/zabbix-proxy
[root@sysadminshelp:/var/lib/zabbixsrv/sqlite3db]# sqlite3 zabbix_proxy
SQLite version 3.7.17 2013-05-20 00:56:22
Enter ".help" for instructions
Enter SQL statements terminated with a ";"
sqlite> .databases
seq  name             file
—  —————  ———————————————————-
0    main             /var/lib/zabbixsrv/sqlite3db/zabbix_proxy
sqlite>
[root@sysadminshelp:/root ]# vi /etc/zabbix_proxy.conf
#DBName=zabbix_proxy
DBName=/var/lib/zabbixsrv/sqlite3db/zabbix_proxy

4. Configure zabbix proxy to be able to connect to Zabbix Server

[root@sysadminshelp:/root ]#  vi /etc/zabbix/zabbix_proxy.conf     ############ GENERAL PARAMETERS #################
    ProxyMode=0
    Server=192.168.1.28
    ServerPort=10051
    Hostname=zabbix-proxy
    ListenPort=10051
    SourceIP=10.168.1.55
    LogFile=/var/log/zabbix/zabbix_proxy.log
    LogFileSize=1
    DebugLevel=2
    PidFile=/var/run/zabbix/zabbix_proxy.pid
    DBName=/var/lib/zabbix-proxy/sqlite3db/zabbix_proxy.db
    DBUser=zabbix
    
    ######### PROXY SPECIFIC PARAMETERS #############
    ProxyOfflineBuffer=24
    HeartbeatFrequency=60
    ConfigFrequency=120
    
    ############ ADVANCED PARAMETERS ################
    StartPollersUnreachable=3
    StartHTTPPollers=3
    JavaGateway=127.0.0.1
    JavaGatewayPort=10052
    StartJavaPollers=5
    SNMPTrapperFile=/var/log/snmptrap/snmptrap.log
    StartSNMPTrapper=1
    CacheSize=32M
    Timeout=4
    ExternalScripts=/usr/lib/zabbix/externalscripts
    LogSlowQueries=3000
    
    ####### TLS-RELATED PARAMETERS #######
    TLSConnect=psk
    TLSAccept=psk
    TLSPSKIdentity=PSK zabbix-proxy-fqdn-hostname
    TLSPSKFile=/etc/zabbix/zabbix_proxy.psk

5. Check and make sure the installed zabbix proxy as well as the zabbix_proxy server zabbix_agentd client and zabbix_server are at the same major version release

a) Check zabbix proxy version

[root@sysadminshelp:/etc/zabbix]# zabbix_proxy -V
zabbix_proxy (Zabbix) 5.0.31
Revision f64a07aefca 30 January 2023, compilation time: Jan 30 2023 09:55:10

Copyright (C) 2023 Zabbix SIA
License GPLv2+: GNU GPL version 2 or later <https://www.gnu.org/licenses/>.
This is free software: you are free to change and redistribute it according to
the license. There is NO WARRANTY, to the extent permitted by law.

This product includes software developed by the OpenSSL Project
for use in the OpenSSL Toolkit (http://www.openssl.org/).

Compiled with OpenSSL 1.0.1e-fips 11 Feb 2013
Running with OpenSSL 1.0.1e-fips 11 Feb 2013

[root@sysadminshelp:/etc/zabbix]#

b) check zabbix_agentd version

[root@sysadminshelp:/etc/zabbix]# zabbix_agentd -V
zabbix_agentd (daemon) (Zabbix) 5.0.30
Revision 2c96c38fb4b 28 November 2022, compilation time: Nov 28 2022 11:27:43

Copyright (C) 2022 Zabbix SIA
License GPLv2+: GNU GPL version 2 or later <https://www.gnu.org/licenses/>.
This is free software: you are free to change and redistribute it according to
the license. There is NO WARRANTY, to the extent permitted by law.

This product includes software developed by the OpenSSL Project
for use in the OpenSSL Toolkit (http://www.openssl.org/).

Compiled with OpenSSL 1.0.1e-fips 11 Feb 2013
Running with OpenSSL 1.0.1e-fips 11 Feb 2013

c) Check zabbix server version

[root@zabbix:~]# zabbix_server -V
zabbix_server (Zabbix) 5.0.30
Revision 2c96c38fb4b 28 November 2022, compilation time: Nov 28 2022 09:19:03

Copyright (C) 2022 Zabbix SIA
License GPLv2+: GNU GPL version 2 or later <https://www.gnu.org/licenses/>.
This is free software: you are free to change and redistribute it according to
the license. There is NO WARRANTY, to the extent permitted by law.

This product includes software developed by the OpenSSL Project
for use in the OpenSSL Toolkit (http://www.openssl.org/).

Compiled with OpenSSL 1.1.1d  10 Sep 2019
Running with OpenSSL 1.1.1n  15 Mar 2022

6. Starting the zabbix-proxy for a first time

Before beginning with installation make sure selinux is disabled, as it might cause some issues with Zabbix

[root@sysadminshelp:/etc/zabbix]# sestatus
SELinux status:                 disabled

If you need to have the selinux enabled you will have to allow the zabbix-proxy into selinux as well:

cd /tmp
# grep zabbix_proxy /var/log/audit/audit.log | grep denied | audit2allow -m zabbix_proxy > zabbix_proxy.te
grep zabbix_proxy /var/log/audit/audit.log | grep denied | audit2allow -M zabbix_proxy
semodule -i zabbix_proxy.pp


[root@sysadminshelp:/etc/zabbix]# systemctl start zabbix-proxy

Also lets enable zabbix-proxy to automatically start it on next server reboot / boot.

root@sysadminshelp:/etc/zabbix]# systemctl enable zabbix-proxy

Normally running zabbix-proxy should provide a status messages like:

[root@sysadminshelp:/etc/zabbix]# systemctl status zabbix-proxy
● zabbix-proxy.service – Zabbix Proxy
   Loaded: loaded (/usr/lib/systemd/system/zabbix-proxy.service; disabled; vendor preset: disabled)
   Active: active (running) since чт 2023-05-04 14:58:36 CEST; 2h 59min ago
  Process: 8500 ExecStop=/bin/kill -SIGTERM $MAINPID (code=exited, status=0/SUCCESS)
  Process: 8504 ExecStart=/usr/sbin/zabbix_proxy -c $CONFFILE (code=exited, status=0/SUCCESS)
 Main PID: 8506 (zabbix_proxy)
   CGroup: /system.slice/zabbix-proxy.service
           ├─8506 /usr/sbin/zabbix_proxy -c /etc/zabbix/zabbix_proxy.conf
           ├─8507 /usr/sbin/zabbix_proxy: configuration syncer [synced config 40521 bytes in 0.0…
           ├─8508 /usr/sbin/zabbix_proxy: trapper #1 [processed data in 0.000808 sec, waiting fo…
           ├─8509 /usr/sbin/zabbix_proxy: trapper #2 [processed data in 0.005028 sec, waiting fo…
           ├─8510 /usr/sbin/zabbix_proxy: trapper #3 [processed data in 0.001240 sec, waiting fo…
           ├─8511 /usr/sbin/zabbix_proxy: trapper #4 [processed data in 0.004378 sec, waiting fo…
           ├─8512 /usr/sbin/zabbix_proxy: trapper #5 [processed data in 0.004991 sec, waiting fo…
           ├─8513 /usr/sbin/zabbix_proxy: preprocessing manager #1 [queued 0, processed 3 values…
           ├─8514 /usr/sbin/zabbix_proxy: preprocessing worker #1 started
           ├─8515 /usr/sbin/zabbix_proxy: preprocessing worker #2 started
           ├─8516 /usr/sbin/zabbix_proxy: preprocessing worker #3 started
           ├─8517 /usr/sbin/zabbix_proxy: heartbeat sender [sending heartbeat message success in…
           ├─8518 /usr/sbin/zabbix_proxy: data sender [sent 0 values in 0.005241 sec, idle 1 sec…
           ├─8519 /usr/sbin/zabbix_proxy: housekeeper [deleted 4501 records in 0.011462 sec, idl…
           ├─8520 /usr/sbin/zabbix_proxy: http poller #1 [got 0 values in 0.000248 sec, idle 5 s…
           ├─8521 /usr/sbin/zabbix_proxy: http poller #2 [got 0 values in 0.000239 sec, idle 5 s…
           ├─8522 /usr/sbin/zabbix_proxy: http poller #3 [got 0 values in 0.000328 sec, idle 5 s…
           ├─8523 /usr/sbin/zabbix_proxy: discoverer #1 [processed 0 rules in 0.000261 sec, idle…
           ├─8524 /usr/sbin/zabbix_proxy: history syncer #1 [processed 0 values in 0.000009 sec,…
           ├─8525 /usr/sbin/zabbix_proxy: history syncer #2 [processed 0 values in 0.000007 sec,…
           ├─8526 /usr/sbin/zabbix_proxy: history syncer #3 [processed 0 values in 0.000014 sec,…
           ├─8527 /usr/sbin/zabbix_proxy: history syncer #4 [processed 0 values in 0.000021 sec,…
           ├─8528 /usr/sbin/zabbix_proxy: java poller #1 [got 0 values in 0.000017 sec, idle 5 s…
           ├─8529 /usr/sbin/zabbix_proxy: java poller #2 [got 0 values in 0.000019 sec, idle 5 s…
           ├─8530 /usr/sbin/zabbix_proxy: java poller #3 [got 0 values in 0.000019 sec, idle 5 s…
           ├─8531 /usr/sbin/zabbix_proxy: java poller #4 [got 0 values in 0.000018 sec, idle 5 s…
           ├─8532 /usr/sbin/zabbix_proxy: java poller #5 [got 0 values in 0.000013 sec, idle 5 s…
           ├─8533 /usr/sbin/zabbix_proxy: snmp trapper [processed data in 0.000026 sec, idle 1 s…
           ├─8534 /usr/sbin/zabbix_proxy: self-monitoring [processed data in 0.000034 sec, idle …
           ├─8535 /usr/sbin/zabbix_proxy: task manager [processed 0 task(s) in 0.000169 sec, idl…
           ├─8536 /usr/sbin/zabbix_proxy: poller #1 [got 0 values in 0.000012 sec, idle 5 sec]
           ├─8537 /usr/sbin/zabbix_proxy: poller #2 [got 0 values in 0.000021 sec, idle 5 sec]
           ├─8538 /usr/sbin/zabbix_proxy: poller #3 [got 0 values in 0.000039 sec, idle 5 sec]
           ├─8539 /usr/sbin/zabbix_proxy: poller #4 [got 0 values in 0.000024 sec, idle 5 sec]
           ├─8540 /usr/sbin/zabbix_proxy: poller #5 [got 0 values in 0.000019 sec, idle 5 sec]
           ├─8541 /usr/sbin/zabbix_proxy: unreachable poller #1 [got 0 values in 0.000011 sec, i…
           ├─8542 /usr/sbin/zabbix_proxy: unreachable poller #2 [got 0 values in 0.000018 sec, i…
           ├─8543 /usr/sbin/zabbix_proxy: unreachable poller #3 [got 0 values in 0.000041 sec, i…
           └─8544 /usr/sbin/zabbix_proxy: icmp pinger #1 [got 0 values in 0.000022 sec, idle 5 s…

май 04 14:58:36 sysadminshelp systemd[1]: Stopped Zabbix Proxy.
май 04 14:58:36 sysadminshelp systemd[1]: Starting Zabbix Proxy…
май 04 14:58:36 sysadminshelp systemd[1]: Started Zabbix Proxy.

zabbix-server-zabbix-proxy-and-zabbix-clients-overview-diagram

7. Configure zabbix-agentd to use your just new brand new zabbix-proxy

Here is my sample configuration file:

[root@sysadminshelp:/etc/zabbix]# grep -v \# /etc/zabbix/zabbix_agentd.conf | sed '/^$/d'
PidFile=/var/run/zabbix/zabbix_agentd.pid
LogFile=/var/log/zabbix/zabbix_agentd.log
LogFileSize=0
Server=zabbix-proxy
ServerActive=zabbix-proxy:10051
ListenIP
Hostname=sysadminshelp
BufferSend=30
BufferSize=100
Include=/etc/zabbix/zabbix_agentd.d/*.conf


Note that the ServerActive given "zabbix-proxy" should be resolvable from the host, or even better you might want to put the IP of the Proxy if
you don't have at least a pseudo Hostname already configured inside /etc/hosts or actual DNS 'A' Active record configured inside a properly resolving
DNS server configured on the host via /etc/resolv.conf.


8. Create and Configure new proxy into the Zabbix-server host
 

Go to the zabbix server web interface URL into menus:

zabbix-administration-proxy-config
 

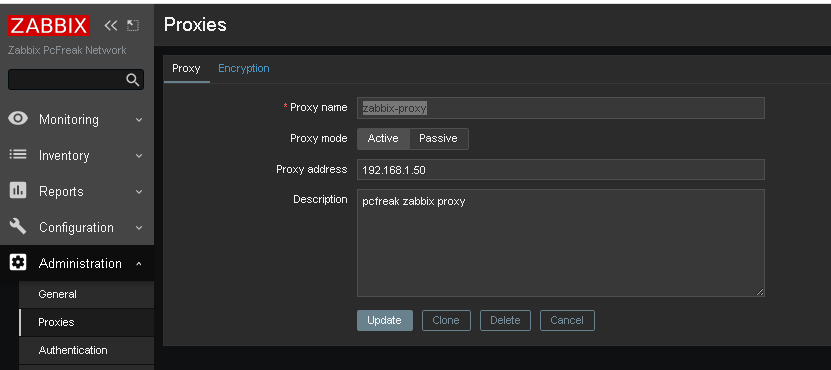
Administration -> Proxies (Proxy) 


Click on ;

Create Proxy button (uppper right corner)

*Proxy name: usually-your-host-pingable-fqdn
Proxy mode: Active
Proxy address: 192.168.1.50
Description: pcfreak zabbix proxy


Administration -> Proxies -> Encryption


From "Connection to proxy"

Untick "No encryption"

and

Tick "PSK"


zabbix-administration-proxy-config-encryption

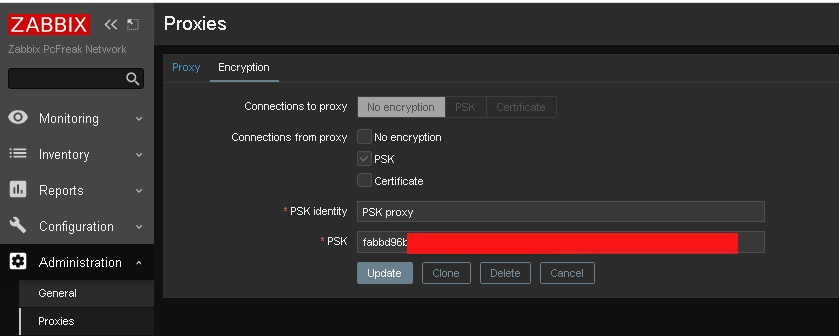
*PSK Identity: PSK proxy
*PSK: Put the key here (copy from /etc/zabbix/zabbix_proxy.psk generated steps earlier with openssl)

[root@sysadminshelp:/etc/zabbix]# cat zabbix_proxy.psk
faddbd96be00ac42c892fda5201634df25d51f3ndbbbf6cee9d354b2817092a28

Press the "Update" Button

zabbix-administration-proxy-config-encryption1

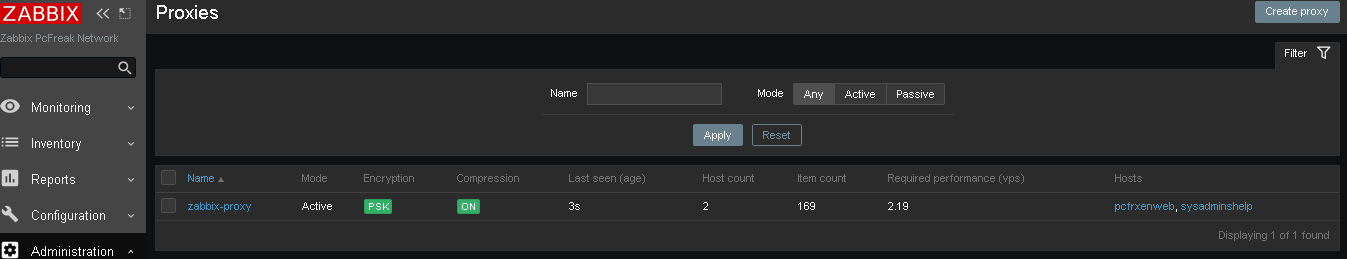
and go again to Proxies and check the zabbix-proxy is connected to the server and hosts configured to use the zabbix proxy reporting frequently.

To make sure that the configured new hosts to use the Zabbix Proxy instead of direct connection to Zabbix Server, go to Latest Data and check whether the configured Hostnames to connect to the Zabbix-Proxy continues to sent Data still.

9. Debugging problems with zabix-proxy and zabbix-agentd connectivity to proxy

In case of troubles check out what is going on inside the Zabbix Proxy / Agent and Server log files
 

[root@sysadminshelp:/etc/zabbix]# tail -n 50 /var/log/zabbix/zabbix_proxy.log

 6832:20230504:134032.281 Starting Zabbix Proxy (active) [zabbix-proxy]. Zabbix 5.0.31 (revision f
64a07aefca).
  6832:20230504:134032.281 **** Enabled features ****
  6832:20230504:134032.281 SNMP monitoring:       YES
  6832:20230504:134032.281 IPMI monitoring:       YES
  6832:20230504:134032.281 Web monitoring:        YES
  6832:20230504:134032.281 VMware monitoring:     YES
  6832:20230504:134032.281 ODBC:                  YES
  6832:20230504:134032.281 SSH support:           YES
  6832:20230504:134032.281 IPv6 support:          YES
  6832:20230504:134032.281 TLS support:           YES
  6832:20230504:134032.281 **************************
  6832:20230504:134032.281 using configuration file: /etc/zabbix/zabbix_proxy.conf
  6832:20230504:134032.291 current database version (mandatory/optional): 05000000/05000005
  6832:20230504:134032.291 required mandatory version: 05000000
  6832:20230504:134032.292 proxy #0 started [main process]
  6833:20230504:134032.292 proxy #1 started [configuration syncer #1]
  6833:20230504:134032.329 received configuration data from server at "192.168.1.28", datalen 40521
  6834:20230504:134032.392 proxy #2 started [trapper #1]
  6835:20230504:134032.401 proxy #3 started [trapper #2]
  6836:20230504:134032.402 proxy #4 started [trapper #3]
  6838:20230504:134032.405 proxy #6 started [trapper #5]
  6837:20230504:134032.409 proxy #5 started [trapper #4]
  6843:20230504:134032.409 proxy #11 started [heartbeat sender #1]
  6845:20230504:134032.412 proxy #13 started [housekeeper #1]
  6847:20230504:134032.412 proxy #15 started [discoverer #1]
  8526:20230504:145836.512 proxy #20 started [history syncer #3]
  8517:20230504:145836.512 proxy #11 started [heartbeat sender #1]
  8530:20230504:145836.515 proxy #24 started [java poller #3]
  8531:20230504:145836.517 proxy #25 started [java poller #4]
  8532:20230504:145836.520 proxy #26 started [java poller #5]
  8536:20230504:145836.522 proxy #30 started [poller #1]
  8527:20230504:145836.525 proxy #21 started [history syncer #4]
  8535:20230504:145836.525 proxy #29 started [task manager #1]
  8533:20230504:145836.528 proxy #27 started [snmp trapper #1]
  8539:20230504:145836.528 proxy #33 started [poller #4]
  8538:20230504:145836.529 proxy #32 started [poller #3]
  8534:20230504:145836.532 proxy #28 started [self-monitoring #1]
  8544:20230504:145836.532 proxy #38 started [icmp pinger #1]
  8543:20230504:145836.532 proxy #37 started [unreachable poller #3]
  8542:20230504:145836.535 proxy #36 started [unreachable poller #2]
  8541:20230504:145836.537 proxy #35 started [unreachable poller #1]
  8540:20230504:145836.540 proxy #34 started [poller #5]
  8507:20230504:150036.453 received configuration data from server at "192.168.1.28", datalen 40521
  8507:20230504:150236.503 received configuration data from server at "192.168.1.28", datalen 40521
  8507:20230504:150436.556 received configuration data from server at "192.168.1.28", datalen 40521
  8507:20230504:150636.608 received configuration data from server at "192.168.1.28", datalen 40521
  8507:20230504:150836.662 received configuration data from server at "192.168.1.28", datalen 40521


[root@sysadminshelp:/etc/zabbix]# tail -n 10  /var/log/zabbix-agent/zabbix_agentd.log
3096166:20230504:182840.461 agent #1 started [collector]
3096167:20230504:182840.462 agent #2 started [listener #1]
3096168:20230504:182840.463 agent #3 started [listener #2]
3096169:20230504:182840.464 agent #4 started [listener #3]
3096170:20230504:182840.464 agent #5 started [active checks #1]

If necessery to Debug further and track some strange errors, you might want to increase the DebugLevel to lets say DebugLevel=5

5 – extended debugging (produces even more information)

If checking both zabbix_agentd.log and zabbix_proxy.log cannot give you enough of a hint on what might be the issues you face with your userparameter scripts or missing Monitored data etc. and hopefully you have access to the zabbix-server machine, check out the zabbix server log as well

[root@zabbix:~]# tail -n 100 /var/log/zabbix/zabbix_server.log

3145027:20230504:182641.556 sending configuration data to proxy "zabbix-proxy" at "192.168.1.50", datalen 40521, bytes 6120 with compression ratio 6.6
3145029:20230504:182716.529 cannot send list of active checks to "192.168.1.30": host [pcfrxenweb] not found
3145028:20230504:182731.959 cannot send list of active checks to "192.168.1.30": host [pcfrxenweb] not found
3145029:20230504:182756.634 cannot send list of active checks to "192.168.1.30": host [pcfrxenweb] not found

Wrapping it up

In this article, we have learned how to install and configure a zabbix-proxy server and prepare a PSK encryption secret key for it.
We learned also  how to connect this server to the central zabbix monitoring host machine in Active mode, so both Zabbix proxy and server can communicate in a secure crypted form,
as well as how to set zabbix_agentd clients to connect to the zabbix proxy
which will from itself send its data to the Central Zabbix server host as well as how to Debug and hopefully solve issues with communication between Zabbix client -> Zabbix Proxy -> Zabbix server.

I know this article, does not say anything revolutionary and there is plenty of posts online talking about how to run yourself a zabbix proxy and make in your home or corporate network,
but I thought to write it down as by writting it and reading a bit more on the topic of Zabbix Server / Proxy / Agent, that give myself a better overview on how this technologies work and such an article will give myself an easier step by step guide to follow,
in future when I have to configure Zabbix Environments for personal hobby or professionally for customers.
Hope you enjoyed. Cheers ! 🙂

Monitor cluster heartbeat lines IP reahability via ping ICMP protocol with Zabbix

Wednesday, April 12th, 2023

https://pc-freak.net/images/zabbix-monitoring-icmp-ping-on-application-crm-clusters-with-userparameter-script-howto

Say you're having an haproxy load balancer cluster with two or more nodes and you are running the servers inside some complex organizational hybrid complex network that is a combination of a local DMZ lans, many switches, dedicated connectivity lines and every now and then it happens for the network to mysteriously go down. Usually simply setting monitoring on the network devices CISCO itself or the smart switches used is enough to give you an overview on what's going on but if haproxy is in the middle of the end application servers and in front of other Load balancers and network equipment sometimes it might happen that due to failure of a network equipment / routing issues or other strange unexpected reasons one of the 2 nodes connectivity might fail down via the configured dedicated additional Heartbeat lines that are usually configured in order to keep away the haproxy CRM Resource Manager cluster thus ending it up in a split brain scenarios.

Assuming that this is the case like it is with us you would definitely want to keep an eye on the connectivity of Connect Line1 and Connect Line2 inside some monitoring software like zabbix. As our company main monitoring software used to monitor our infrastructure is Zabbix in this little article, I'll briefly explain how to configre the network connectivity status change from haproxy node1 and haproxy node2 Load balancer cluster to be monitored via a simple ICMP ping echo checks.

Of course the easies way to configure an ICMP monitor via Zabbix is using EnableRemoteCommands=1 inside /etc/zabbix/zabbix-agentd.conf but if your infrastructure should be of High Security and PCI perhaps this options is prohibited to be used on the servers. This is why to achieve still the ICMP ping checks with EnableRemoteCommands=0 a separate simple bash user parameter script could be used. Read further to find out one way ICMP monitoring with a useparameter script can be achieved with Zabbix.


1. Create the userparameter check for heartbeat lines

root@haproxy1 zabbix_agentd.d]# cat userparameter_check_heartbeat_lines.conf
UserParameter=heartbeat.check,\
/etc/zabbix/scripts/check_heartbeat_lines.sh

root@haproxy2 zabbix_agentd.d]# cat userparameter_check_heartbeat_lines.conf
UserParameter=heartbeat.check,\
/etc/zabbix/scripts/check_heartbeat_lines.sh

2. Create check_heartbeat_lines.sh script which will be actually checking connectivity with simple ping

root@haproxy1 zabbix_agentd.d]# cat /etc/zabbix/scripts/check_heartbeat_lines.sh
#!/bin/bash
hb1=haproxy2-lb1
hb2=haproxy2-lb2
if ping -c 1 $hb1  &> /dev/null
then
  echo "$hb1 1"
else
  echo "$hb1 0"
fi
if ping -c 1 $hb2  &> /dev/null
then
  echo "$hb2 1"
else
  echo "$hb2 0"
fi

[root@haproxy1 zabbix_agentd.d]#

root@haproxy2 zabbix_agentd.d]# cat /etc/zabbix/scripts/check_heartbeat_lines.sh
#!/bin/bash
hb1=haproxy1-hb1
hb2=haproxy1-hb2
if ping -c 1 $hb1  &> /dev/null
then
  echo "$hb1 1"
else
  echo "$hb1 0"
fi
if ping -c 1 $hb2  &> /dev/null
then
  echo "$hb2 1"
else
  echo "$hb2 0"
fi

[root@haproxy2 zabbix_agentd.d]#


3. Test script heartbeat lines first time

Each of the nodes from the cluster are properly pingable via ICMP protocol

The script has to be run on both haproxy1 and haproxy2 Cluster (load) balancer nodes

[root@haproxy-hb1 zabbix_agentd.d]# /etc/zabbix/scripts/check_heartbeat_lines.sh
haproxy2-hb1 1
haproxy2-hb2 1

[root@haproxy-hb2 zabbix_agentd.d]# /etc/zabbix/scripts/check_heartbeat_lines.sh
haproxy1-hb1 1
haproxy1-hb2 1


The status of 1 returned by the script should be considered remote defined haproxy node is reachable / 0 means ping command does not return any ICMP status pings back.

4. Restart the zabbix-agent on both cluster node machines that will be conducting the ICMP ping check

[root@haproxy zabbix_agentd.d]# systemctl restart zabbix-agentd
[root@haproxy zabbix_agentd.d]# systemctl status zabbix-agentd

[root@haproxy zabbix_agentd.d]# tail -n 100 /var/log/zabbix_agentd.log


5. Create Item to process the userparam script

Create Item as follows:

6. Create the Dependent Item required
 

zabbix-heartbeat-check-screenshots/heartbeat-line1-preprocessing

For processing you need to put the following simple regular expression

Name: Regular Expression
Parameters: hb1(\s+)(\d+)
Custom on fail: \2

zabbix-heartbeat-check-screenshots/heartbeat-line2-preprocessing1

zabbix-heartbeat-check-screenshots/heartbeat-lines-triggers


7. Create triggers that will be generating the Alert

Create the required triggers as well

zabbix-heartbeat-check-screenshots/heartbeat2-line
Main thing to configure here in Zabbix is below expression

Expression: {FQDN:heartbeat2.last()}<1

triggers_heartbeat1

You can further configure Zabbix Alerts to mail yourself or send via Slack / MatterMost or Teams alarms in case of problems.

Enable PSK encryption on Zabbix Agent (client) sent encrypted monitored datas to Zabbix server

Friday, April 7th, 2023

zabbix-client-server-encryption-public-key-exchange

Those concerned of security and in use of their Zabbix monitored data who communicate Zabbix collected agent
data over internet or via some kind of untrusted network might definitely not enjoy the fact that zabbix-agent sents
its collected data to server in a plain text. Clear text data is allowing any network sniffer to possibly collect your
monitored server and hardware devices data and exposes all data sent over the network to same problems like in the past
the old uencrypted SMTP protocol.

To mitigate those great security hole for the paranoid sys admin it is rather easy to enable PSK (Pre Shared Key) based encryption.
To generate Pre Shared key you have to had to important values present

1. PSK Identity
2. PSK Secret

PSK secret should be minimum of 128 bit (16-byte PSK, entered as 32 hexadecimal digits), and supports up to
2048 bit (256-byte PSK, entered as 512 hexadecimal digits)

Usually something like 256 bit PSK secret on the machine should be strong enough and simply generated by running

# openssl rand -hex 32

1. Agent to zabbix server or proxy connection config

In /etc/zabbix/zabbix_agentd.conf for a Server Active (e.g. server to actively request the client to sent its collected data)
On machine running zabbix-agent should have a configuration similar to:

# cat /etc/zabbix/zabbix_agentd.conf

PidFile=/var/run/zabbix/zabbix_agentd.pid
LogFile=/var/log/zabbix/zabbix_agentd.log
LogFileSize=0

# IP of the machine
SourceIP=10.10.10.30
# turn it on if you need to execute to remote machine commands
EnableRemoteCommands=0

# IP of the server
servers=10.30.50.80
ListenPort=10080

# IP of the machine
ListenIP=10.30.30.31

# IP of the server
ServerActive=10.30.50.80

HostMetadataItem=system.uname
BufferSize=5400
MaxLinesPerSecond=5
Timeout=10
AllowRoot=0
StartAgents=5
LogRemoteCommands=0


# Machine hostname
Hostname=fqdn-of-zabbix-data-collect-server.com
Include=/etc/zabbix/zabbix_agentd.d/*.conf

# Encryption
TLSConnect=psk
TLSAccept=psk
TLSPSKIdentity=PSK to Zabbix Server5
TLSPSKFile=/etc/zabbix/zabbix_agentd.psk


! Important security note

!!! The TLSPSKIdentity value you decide will not be encrypted on transport, so don't use anything sensitive.

Once you include the TSL config

2 Generate / Create Zabbix Agent Key

Generate the key with pseudo-random bites inside /etc/zabbix/zabbix_agentd_key.psk

# cd /etc/zabbix
# openssl rand -hex 32 > zabbix_agentd_key.psk
# chown zabbix:zabbix zabbix_agentd_key.psk
# chmod 600 zabbix_agentd_key.psk

3. Configure PSK encryption in Zabbix Server Web User interface

Go to Zabbix Server User interface in browser and configure the PSK encryption options for the host.

Select the:

'Connections to host' = PSK

'Connections from host' = PSK

'PSK Identity' = [public-value-configured-in-Zabbix-agent-config]

'PSK' = [paste the long hex string generated from the OpenSSL command above]


In some seconds up to a minute or two the Zabbix Server and Agent will successfully communicate using PSK encryption.
Making the monitored data unreadable in plain text for malignant sniffers hanging in the middle equipment between the zabbix-agent and zabbix-server hosts.

4. PSK encryption behind a Proxy

Many companies, nowadays use zabbix proxy for improvement of network infrastrucutre. For example it is used to offload the zabbix-server when multiple zabbix-agents have to report various datas or to monitor servers and devices that are phyisically in separate networks or data centers (are passing through paranoic built firewalls) or monitor locations are having unreliable communications between each other.
 

To enable PSK for communications between your Zabbix Server and Zabbix Proxy.

1. Create a new secret, and add the PSK Identity and Secret to

Administration ⇾ Proxies ⇾ [Your proxy] ⇾ Encryption

2. Adjust the settings inside the zabbix proxies configuration file at /etc/zabbix/zabbix_proxy.conf


If setting up PSK encryption for agents behind a Zabbix proxy, ensure your have

Zabbix Server ⇽⇾ Proxy PSK enabled
first in Zabbix Server UI.

This is because, when you start the Proxy, or do some testing to send some key value to Zabbix server via the proxy with commands :

# zabbix_get -s 127.0.0.1 -k system.hostname
# zabbix_server -R config_cache_reload


config_cache_reload, the Proxy will download all its host settings from the server, and this also includes the servers copy of the secret.

The proxy needs to know the secret since it is now managing the communications on behalf of the server.

3. To add PSK encryption for any Agents behind a proxy, then you continue to set up the Agents as normal by creating a new secret, editing

Configuration ⇾ Hosts ⇾ [Your Host] ⇾ Encryption page

and also editing /etc/zabbix/zabbix_agentd.conf.

Remember that, since your Agents Host configuration in the Zabbix UI will be set as Monitored by Proxy, the PSK settings will be applicable for communications happening between the Zabbix Proxy and the Agent that it is monitoring, not between the Zabbix Server and the Agent behind the proxy.

You can also add PSK Encryption between your Zabbix Proxy and its own local Agent if you want.
You would set its PSK settings in the Proxy Agents host configuration at

Configuration ⇾ Hosts ⇾ [Your proxy] ⇾ Encryption

and modify the settings in the agents on configuration file at /etc/zabbix/zabbix_agentd.conf.
Keep in mind, this is only applicable to communications between the Zabbix Proxy, and its own Agent process.

When setting up PSK encryption for the Zabbix Server, Proxy and Agents, you may see an error in the Proxy logs,

cannot send proxy data to server at "zabbix.your-domain.tld": connection of type "TLS with PSK" is not allowed for proxy "your-proxy".

If you hit this, check that your

Zabbix Server ⇽⇾ Proxy PSK settings

are correct first.

Don't get confused between the Proxies own optional agent process, and its main Proxy process which is required.

Configure aide file integrity check server monitoring in Zabbix to track for file changes on servers

Tuesday, March 28th, 2023

zabbix-aide-log-monitoring-logo

Earlier I've written a small article on how to setup AIDE monitoring for Server File integrity check on Linux, which put the basics on how this handy software to improve your server overall Security software can be installed and setup without much hassle.

Once AIDE is setup and a preset custom configuration is prepared for AIDE it is pretty useful to configure AIDE to monitor its critical file changes for better server security by monitoring the AIDE log output for new record occurs with Zabbix. Usually if no files monitored by AIDE are modified on the machine, the log size will not grow, but if some file is modified once Advanced Linux Intrusion Detecting (aide) binary runs via the scheduled Cron job, the /var/log/app_aide.log file will grow zabbix-agentd will continuously check the file for size increases and will react.

Before setting up the Zabbix required Template, you will have to set few small scripts that will be reading a preconfigured list of binaries or application files etc. that aide will monitor lets say via /etc/aide-custom.conf
 

1. Configure aide to monitor files for changes


Before running aide, it is a good idea to prepare a file with custom defined directories and files that you plan to monitor for integrity checking e.g. future changes with aide, for example to capture bad intruders who breaks into server which runs aide and modifies critical files such as /etc/passwd /etc/shadow /etc/group or / /usr/local/etc/* or /var/* / /usr/* critical files that shouldn't be allowed to change without the admin to soon find out.

# cat /etc/aide-custom.conf

# Example configuration file for AIDE.
@@define DBDIR /var/lib/aide
@@define LOGDIR /var/log/aide
# The location of the database to be read.
database=file:@@{DBDIR}/app_custom.db.gz
database_out=file:@@{DBDIR}/app_aide.db.new.gz
gzip_dbout=yes
verbose=5

report_url=file:@@{LOGDIR}/app_custom.log
#report_url=syslog:LOG_LOCAL2
#report_url=stderr
#NOT IMPLEMENTED report_url=mailto:root@foo.com
#NOT IMPLEMENTED report_url=syslog:LOG_AUTH

# These are the default rules.
#
#p:      permissions
#i:      inode:
#n:      number of links
#u:      user
#g:      group
#s:      size
#b:      block count
#m:      mtime
#a:      atime
#c:      ctime
#S:      check for growing size
#acl:           Access Control Lists
#selinux        SELinux security context
#xattrs:        Extended file attributes
#md5:    md5 checksum
#sha1:   sha1 checksum
#sha256:        sha256 checksum
#sha512:        sha512 checksum
#rmd160: rmd160 checksum
#tiger:  tiger checksum

#haval:  haval checksum (MHASH only)
#gost:   gost checksum (MHASH only)
#crc32:  crc32 checksum (MHASH only)
#whirlpool:     whirlpool checksum (MHASH only)

FIPSR = p+i+n+u+g+s+m+c+acl+selinux+xattrs+sha256

#R:             p+i+n+u+g+s+m+c+acl+selinux+xattrs+md5
#L:             p+i+n+u+g+acl+selinux+xattrs
#E:             Empty group
#>:             Growing logfile p+u+g+i+n+S+acl+selinux+xattrs

# You can create custom rules like this.
# With MHASH…
# ALLXTRAHASHES = sha1+rmd160+sha256+sha512+whirlpool+tiger+haval+gost+crc32
ALLXTRAHASHES = sha1+rmd160+sha256+sha512+tiger
# Everything but access time (Ie. all changes)
EVERYTHING = R+ALLXTRAHASHES

# Sane, with multiple hashes
# NORMAL = R+rmd160+sha256+whirlpool
NORMAL = FIPSR+sha512

# For directories, don't bother doing hashes
DIR = p+i+n+u+g+acl+selinux+xattrs

# Access control only
PERMS = p+i+u+g+acl+selinux

# Logfile are special, in that they often change
LOG = >

# Just do sha256 and sha512 hashes
LSPP = FIPSR+sha512

# Some files get updated automatically, so the inode/ctime/mtime change
# but we want to know when the data inside them changes
DATAONLY =  p+n+u+g+s+acl+selinux+xattrs+sha256

##############TOUPDATE
#To delegate to app team create a file like /app/aide.conf
#and uncomment the following line
#@@include /app/aide.conf
#Then remove all the following lines
/etc/zabbix/scripts/check.sh FIPSR
/etc/zabbix/zabbix_agentd.conf FIPSR
/etc/sudoers FIPSR
/etc/hosts FIPSR
/etc/keepalived/keepalived.conf FIPSR
# monitor haproxy.cfg
/etc/haproxy/haproxy.cfg FIPSR
# monitor keepalived
/home/keepalived/.ssh/id_rsa FIPSR
/home/keepalived/.ssh/id_rsa.pub FIPSR
/home/keepalived/.ssh/authorized_keys FIPSR

/usr/local/bin/script_to_run.sh FIPSR
/usr/local/bin/another_script_to_monitor_for_changes FIPSR

#  cat /usr/local/bin/aide-config-check.sh
#!/bin/bash
/sbin/aide -c /etc/aide-custom.conf -D

# cat /usr/local/bin/aide-init.sh
#!/bin/bash
/sbin/aide -c /etc/custom-aide.conf -B database_out=file:/var/lib/aide/custom-aide.db.gz -i


# cat /usr/local/bin/aide-check.sh

#!/bin/bash
/sbin/aide -c /etc/custom-aide.conf -Breport_url=stdout -B database=file:/var/lib/aide/custom-aide.db.gz -C|/bin/tee -a /var/log/aide/custom-aide-check.log|/bin/logger -t custom-aide-check-report
/usr/local/bin/aide-init.sh


# cat /usr/local/bin/aide_app_cron_daily.txt

#!/bin/bash
#If first time, we need to init the DB
if [ ! -f /var/lib/aide/app_aide.db.gz ]
   then
    logger -p local2.info -t app-aide-check-report  "Generating NEW AIDE DATABASE for APPLICATION"
    nice -n 18 /sbin/aide –init -c /etc/aide_custom.conf
    mv /var/lib/aide/app_aide.db.new.gz /var/lib/aide/app_aide.db.gz
fi

nice -n 18 /sbin/aide –update -c /etc/aide_app.conf
#since the option for syslog seems not fully implemented we need to push logs via logger
/bin/logger -f /var/log/aide/app_aide.log -p local2.info -t app-aide-check-report
#Acknoledge the new database as the primary (every results are sended to syslog anyway)
mv /var/lib/aide/app_aide.db.new.gz /var/lib/aide/app_aide.db.gz

What above cron job does is pretty simple, as you can read it yourself. If the configuration predefined aide database store file /var/lib/aide/app_aide.db.gz, does not
exists aide will create its fresh empty database and generate a report for all predefined files with respective checksums to be stored as a comparison baseline for file changes. 

Next there is a line to write aide file changes via rsyslog through the logger and local2.info handler


2. Setup Zabbix Template with Items, Triggers and set Action

2.1 Create new Template and name it YourAppName APP-LB File integrity Check

aide-itengrity-check-zabbix_ Configuration of templates

Then setup the required Items, that will be using zabbix's Skip embedded function to scan file in a predefined period of file, this is done by the zabbix-agent that is
supposed to run on the server.

2.2 Configure Item like

aide-zabbix-triggers-screenshot
 

*Name: check aide log file

Type: zabbix (active)

log[/var/log/aide/app_aide.log,^File.*,,,skip]

Type of information: Log

Update Interval: 30s

Applications: File Integrity Check

Configure Trigger like

Enabled: Tick On

images/aide-zabbix-screenshots/check-aide-log-item


2.3 Create Triggers with the respective regular expressions, that would check the aide generated log file for file modifications


aide-zabbix-screenshot-minor-config

Configure Trigger like
 

Enabled: Tick On


*Name: Someone modified {{ITEM.VALUE}.regsub("(.*)", \1)}

*Expression: {PROD APP-LB File Integrity Check:log[/var/log/aide/app_aide.log,^File.*,,,skip].strlen()}>=1

Allow manual close: yes tick

*Description: Someone modified {{ITEM.VALUE}.regsub("(.*)", \1)} on {HOST.NAME}


2.4 Configure Action


aide-zabbix-file-monitoring-action-screensho

Now assuming the Zabbix server has  a properly set media for communication and you set Alerting rules zabbix-server can be easily set tosend mails to a Support email to get Notifications Alerts, everytime a monitored file by aide gets changed.

That's all folks ! Enjoy being notified on every file change on your servers  !
 

Enable zabbix agent to work with SeLinux enabled on CentOS 7 Linux

Wednesday, October 19th, 2022

If you have the task to install and use zabbix-agent or zabbix-proxy to report to zabbix-server on CentOS 7 with enabled SeLinux services for security reasons and you have no mean to disable the selinux which is a common step to take under this circumstances, you will have to add the zabbix services to be exluded as permissive in selinux. In below article I'll show you how this is done in few easy steps.

zabbix-agent-service-selinux-linux-real-time-operating-sytems


1. Check the system sestatus

[root@linux zabbix]# sestatus
SELinux status:                 enabled
SELinuxfs mount:                /sys/fs/selinux
SELinux root directory:         /etc/selinux
Loaded policy name:             targeted
Current mode:                   enforcing
Mode from config file:          enforcing

Policy MLS status:              enabled
Policy deny_unknown status:     allowed
Max kernel policy version:      28


2. Enable zabbix to be permissive in selinux

To be able to set zabbix to be in permissive mode as well as for further troubleshooting if you have to enable other  linux services inside selinux you have to install below RPM packs.

[root@linux zabbix]# yum install setroubleshoot.x86_64 setools.x86_64 setools-console.x86_64 policycoreutils-python.x86_64

Set the zabbix permissive exclude rule in SeLINUX

[root@linux zabbix]# semanage permissive –add zabbix_t

Re-run the zabbix proxy (if you have a local zabbix-proxy running and the zabbix-agent)

[root@linux zabbix]# systemctl start zabbix-proxy.service

[root@linux zabbix]# systemctl start zabbix-agent.service

[root@linux zabbix]# systemctl status zabbix-agent
● zabbix-agent.service – Zabbix Agent
   Loaded: loaded (/usr/lib/systemd/system/zabbix-agent.service; enabled; vendor preset: disabled)
   Active: active (running) since Tue 2022-10-18 09:30:16 CEST; 1 day 7h ago
 Main PID: 962952 (zabbix_agentd)
    Tasks: 6 (limit: 100884)
   Memory: 5.1M
   CGroup: /system.slice/zabbix-agent.service
           ├─962952 /usr/sbin/zabbix_agentd -c /etc/zabbix/zabbix_agentd.conf
           ├─962955 /usr/sbin/zabbix_agentd: collector [idle 1 sec]
           ├─962956 /usr/sbin/zabbix_agentd: listener #1 [waiting for connection]
           ├─962957 /usr/sbin/zabbix_agentd: listener #2 [waiting for connection]
           ├─962958 /usr/sbin/zabbix_agentd: listener #3 [waiting for connection]
           └─962959 /usr/sbin/zabbix_agentd: active checks #1 [idle 1 sec]

Oct 18 09:30:16 linux systemd[1]: Starting Zabbix Agent…
Oct 18 09:30:16 linux systemd[1]: Started Zabbix Agent.

3. Check inside audit logs all is OK

To make sure zabbix is really enabled to be omitted by selinux rules check audit.log

[root@linux zabbix]# grep zabbix_proxy /var/log/audit/audit.log

That's all folks, Enjoy ! 🙂

Zabbix: Monitor Linux rsyslog configured central log server is rechable with check_log_server_status.sh userparameter script

Wednesday, June 8th, 2022

zabbix-monitor-central-log-server-is-reachable-from-host-with-a-userparamater-script-zabbix-logo

On modern Linux OS servers on Redhat / CentOS / Fedora and Debian based distros log server service is usually running on the system  such as rsyslog (rsyslogd) to make sure the logging from services is properly logged in separate logs under /var/log.

A very common practice on critical server machines in terms of data security, where logs produced by rsyslog daermon needs to be copied over network via TCP or UDP protocol immediately is to copy over the /var/log produced logs to another configured central logging server. Then later every piece of bit generated by rsyslogd could be  overseen by a third party auditor person and useful for any investigation in case of logs integrity is required or at worse case if there is a suspicion that system in question is hacked by a malicious hax0r and logs have been "cleaned" up from any traces leading to the intruder (things usually done locally by hackers) or by any automated script exploit tools since yesr.

This doubled logging of system events to external log server  ipmentioned is very common practice by companies to protect their log data and quite useful for logs to be recovered easily later on from the central logging server machine that could be also setup for example to use rsyslogd to receive logs from other Linux machines in circumstances where some log disappears just like that (things i've seen happen) for any strange reason or gets destroyed by the admins mistake locally on machine / or by any other mean such as filesystem gets damaged. a very common practice by companies to protect their log data.  

Monitor remote logging server is reachable with userparameter script

Assuming that you already have setup a logging from the server hostname A towards the Central logging server log storepool and everything works as expected the next logical step is to have at least some basic way to monitor remote logging server configured is still reachable all the time and respectively rsyslog /var/log/*.* logs gets properly produced on remote side for example with something like a simple TCP remote server port check and reported in case of troubles in zabbix.

To solve that simple task for company where I'm employed, I've developed below check_log_server_status.sh:
 

#!/bin/bash
# @@ for TCP @ for UDP
# check_log_server_status.sh Script to check if configured TCP / UDP logging server in /etc/rsyslog.conf is rechable
# report to zabbix
DELIMITER='@@';
GREP_PORT='5145';
CONNECT_TIMEOUT=5;

PORT=$(grep -Ei "*.* $DELIMITER.*:$GREP_PORT" /etc/rsyslog.conf|awk -F : '{ print $2 }'|sort -rn |uniq);

#for i in $(grep -Ei "*.* $DELIMITER.*:$GREP_PORT" /etc/rsyslog.conf |grep -v '\#'|awk -F"$DELIMITER" '{ print $2 }' | awk -F ':' '{ print $1 }'|sort -rn); do
HOST=$(grep -Ei "*.* $DELIMITER.*:$GREP_PORT" /etc/rsyslog.conf |grep -v '\#'|awk -F"$DELIMITER" '{ print $2 }' | awk -F ':' '{ print $1 }'|sort -rn)

# echo $PORT

if [[ ! -z $PORT ]] && [[ ! -z $HOST ]]; then
SSH_RETURN=$(/bin/ssh $HOST -p $PORT -o ConnectTimeout=$CONNECT_TIMEOUT 2>&1);
else
echo "PROBLEM Port $GREP_PORT not defined in /etc/rsyslog.conf";
fi

##echo SSH_RETURN $SSH_RETURN;
#exit 1;
if [[ $(echo $SSH_RETURN |grep -i ‘Connection timed out during banner exchange’ | wc -l) -eq ‘1’ ]]; then
echo "rsyslogd $HOST:$PORT OK";
fi

if [[ $(echo $SSH_RETURN |grep -i ‘Connection refused’ | wc -l) -eq ‘1’ ]]; then
echo "rsyslogd $HOST:$PORT PROBLEM";
fi

#sleep 2;
#done


You can download a copy of the script check_log_server_status.sh here

Depending on the port the remote rsyslogd central logging server is using configure it in the script with respective port through the DELIMITER='@@', GREP_PORT='5145', CONNECT_TIMEOUT=5 values.

The delimiter is setup as usually in /etc/rsyslog.conf this the remote logging server for TCP IP is configured with @@ prefix to indicated TCP mode should be used.

Below is example from /etc/rsyslog.conf of how the rsyslogd server is configured:

[root@Server-hostA /root]# grep -i @@ /etc/rsyslogd.conf
# central remote Log server IP / port
*.* @@10.10.10.1:5145

To use the script on a machine, where you have a properly configured zabbix-agentd service host connected and reporting data to a zabbix-server monitoring server.

1. Set up the script under /usr/local/bin/check_log_server_status.sh

[root@Server-hostA /root ]# vim /usr/local/bin/check_log_server_status.sh

[root@Server-hostA /root ]# chmod +x /usr/local/bin/check_log_server_status.sh

2. Prepare userparameter_check_log_server.conf with log_server.check Item key

[root@Server-hostA zabbix_agentd.d]# cat userparameter_check_log_server.conf 
UserParameter=log_server.check, /usr/local/bin/check_log_server_status.sh

3. Set in Zabbix some Item such as on below screenshot


check-log-server-status-screenshot-linux-item-zabbix.png
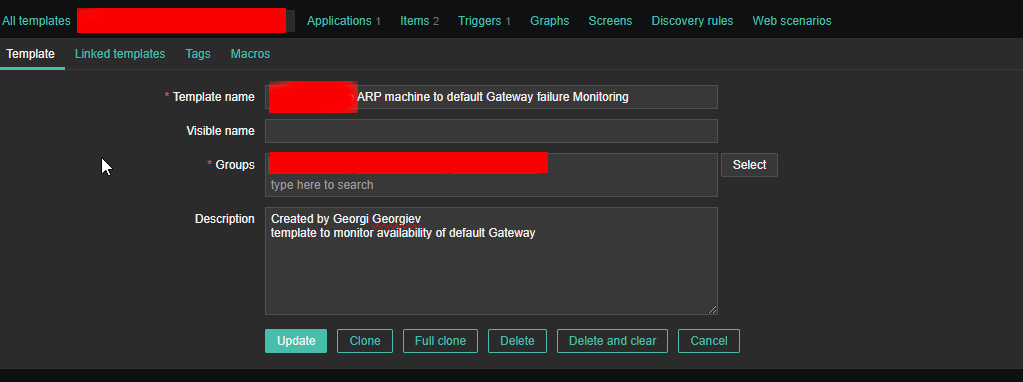
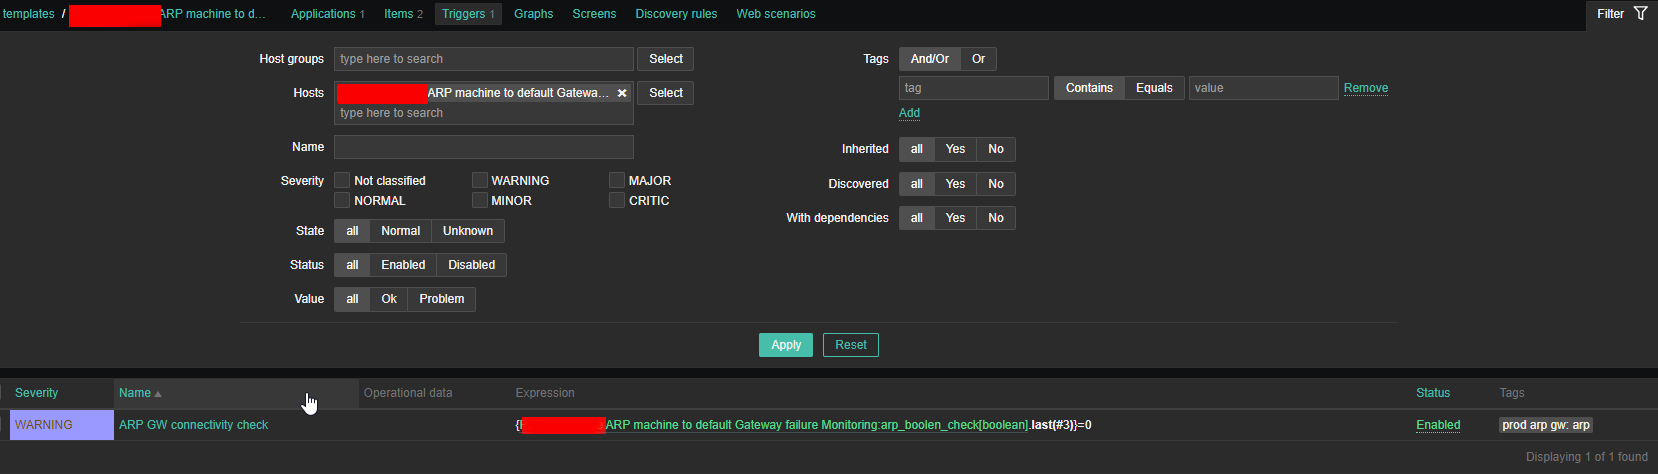
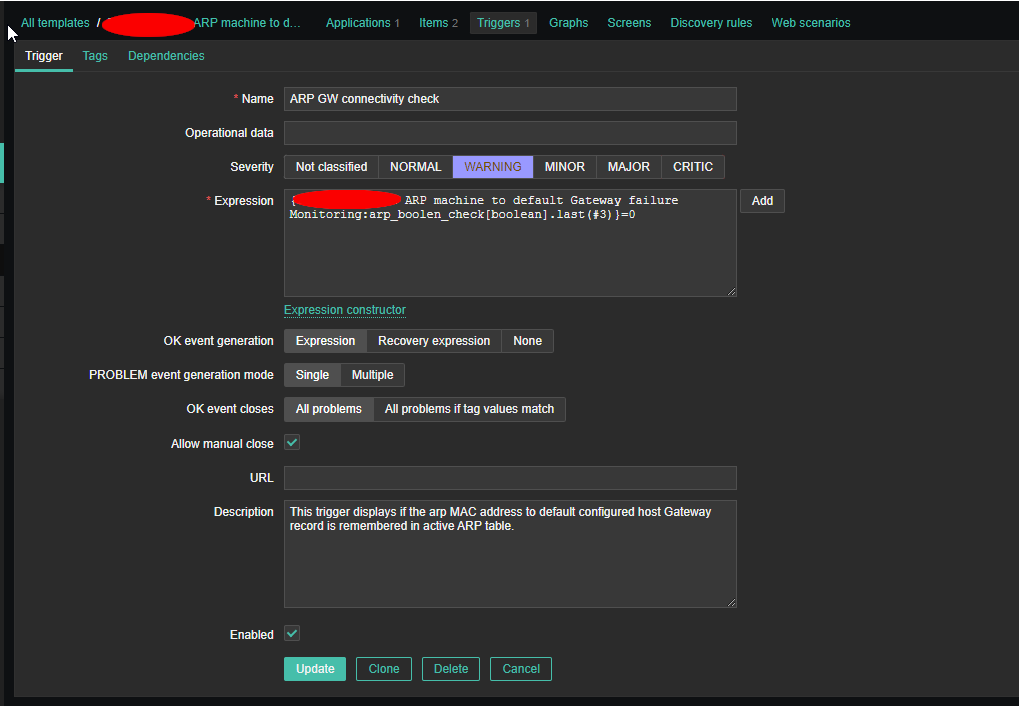
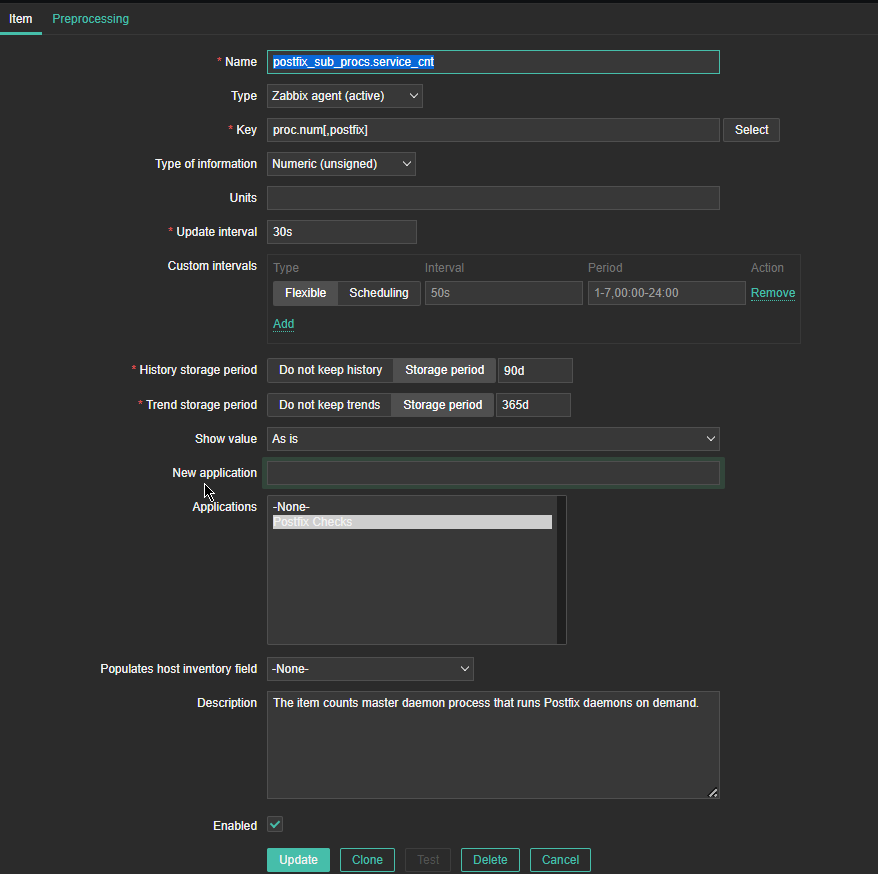
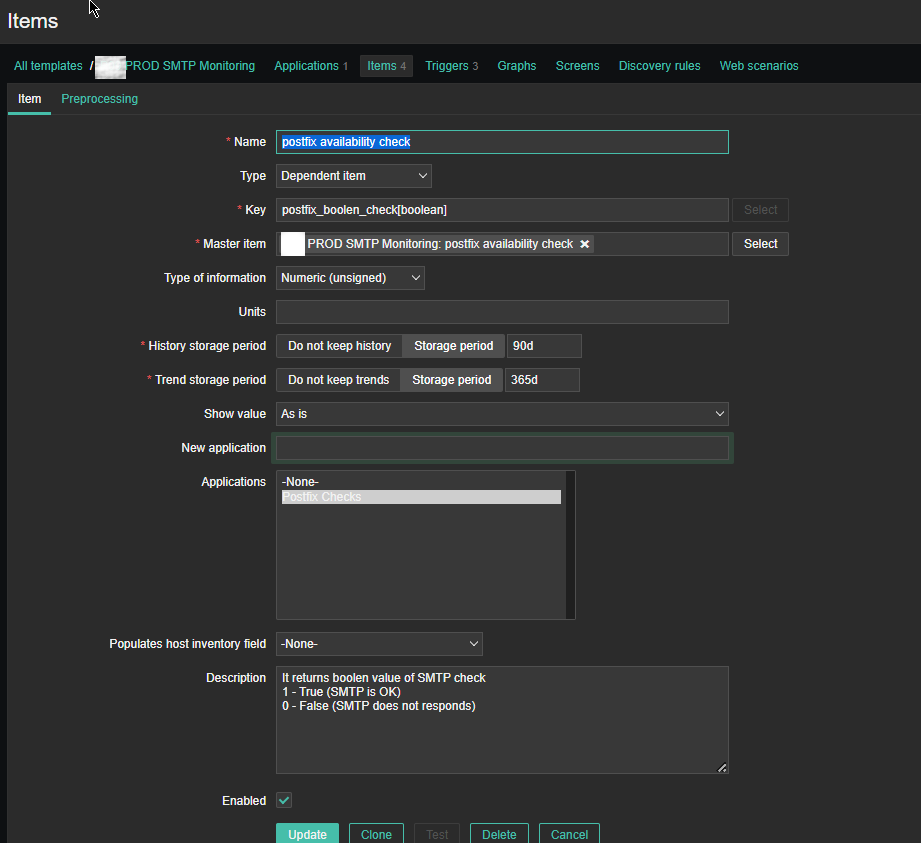
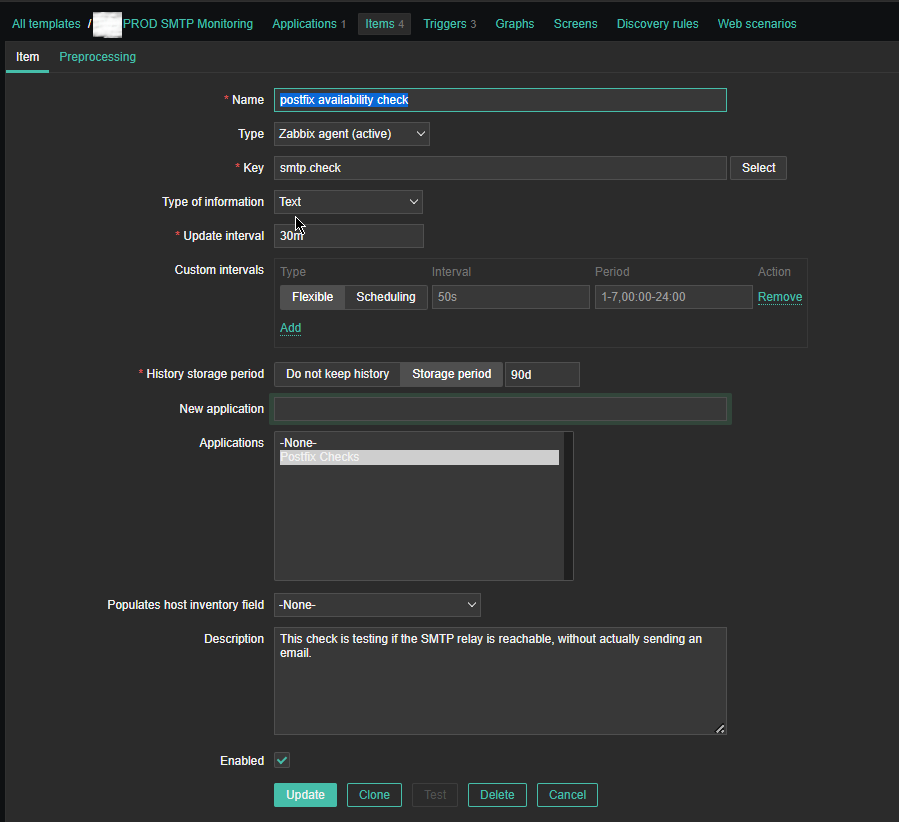
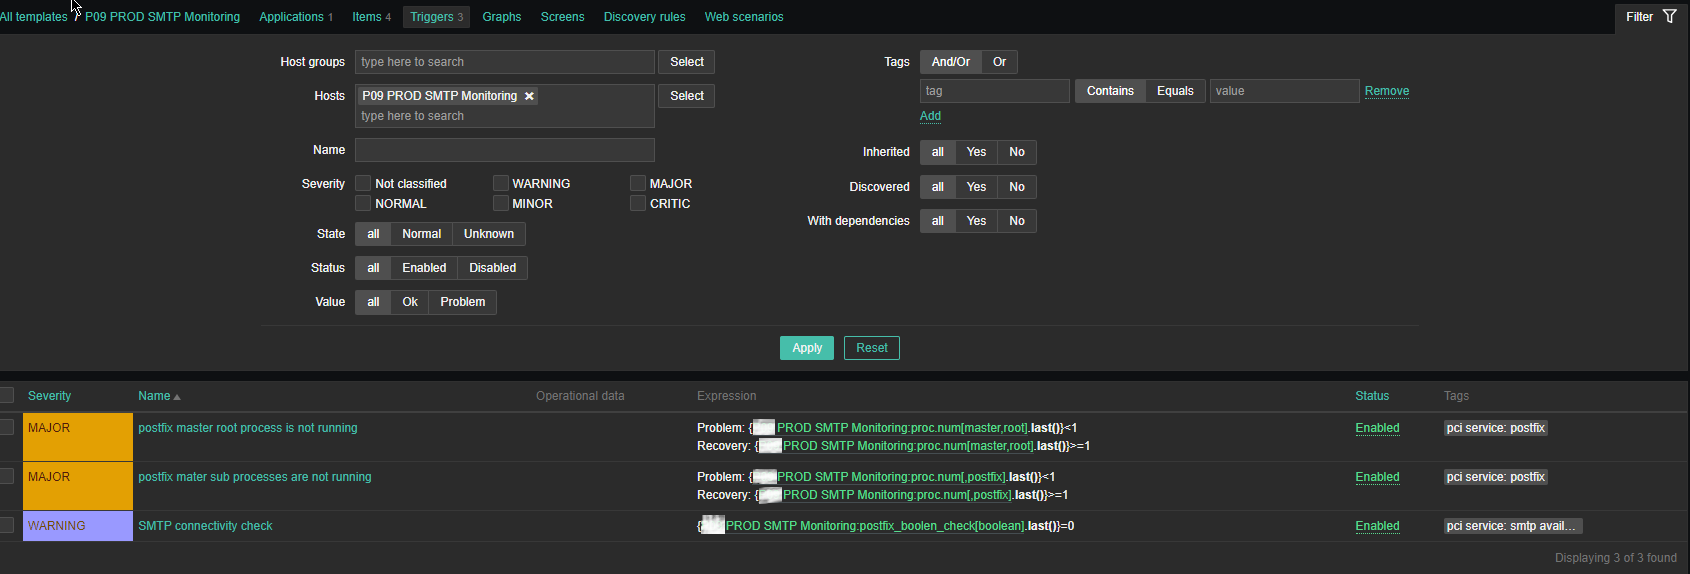
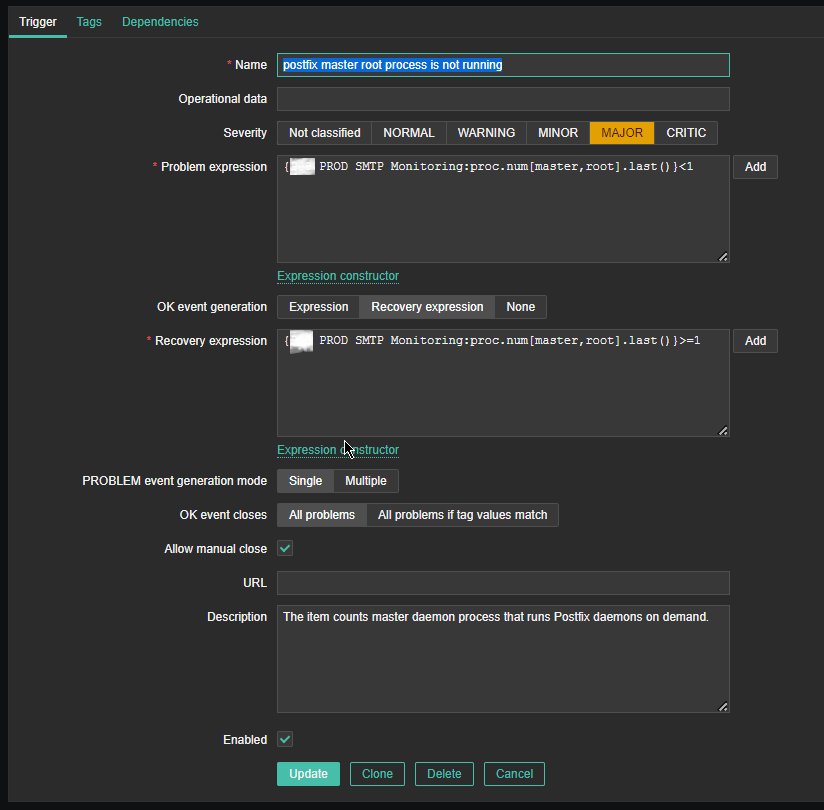
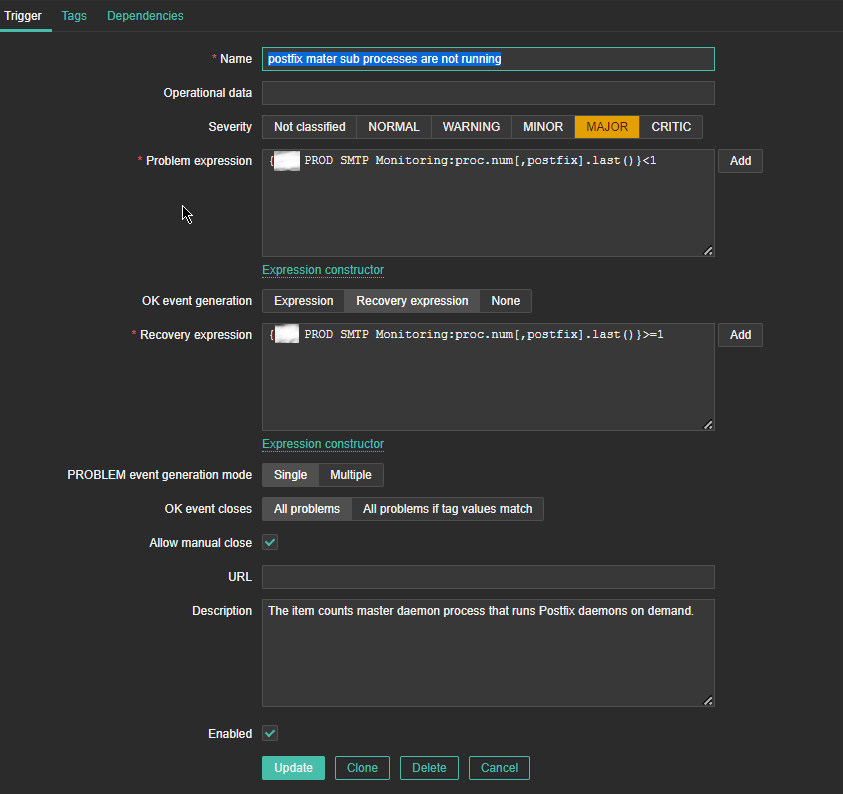
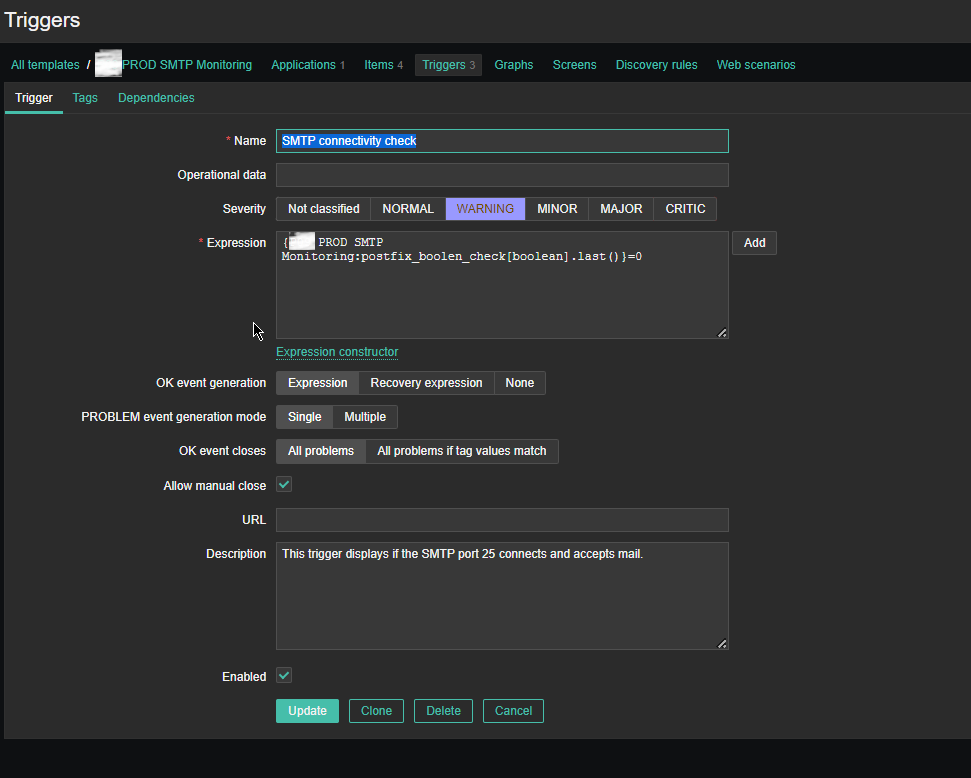
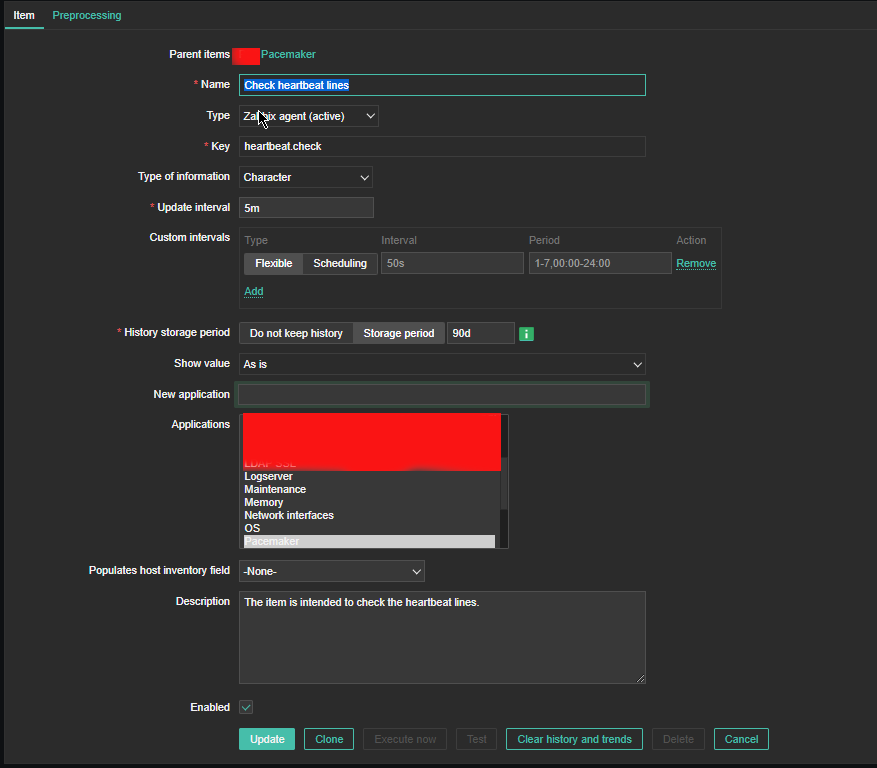
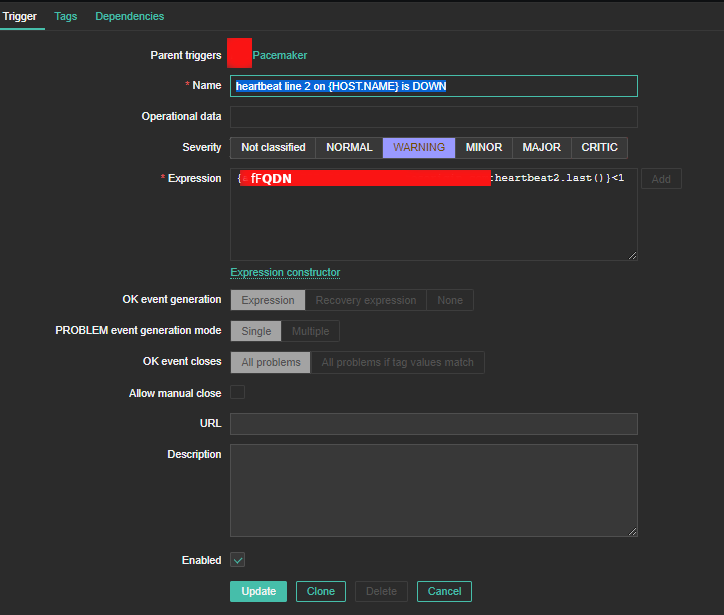
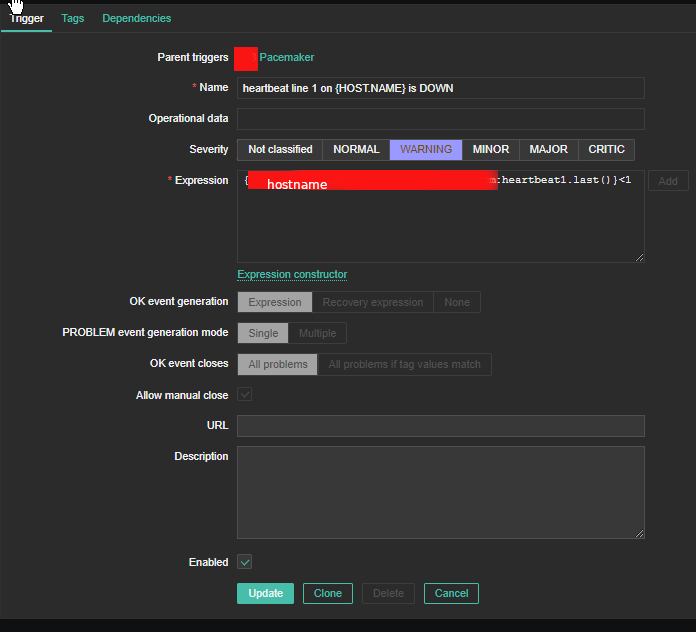
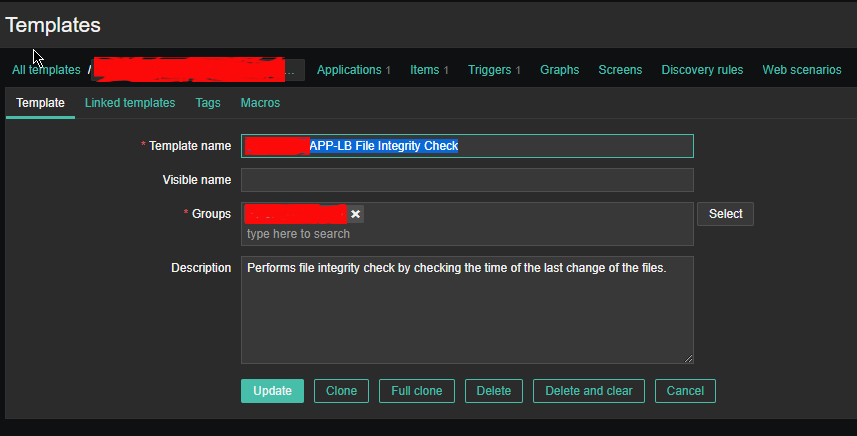
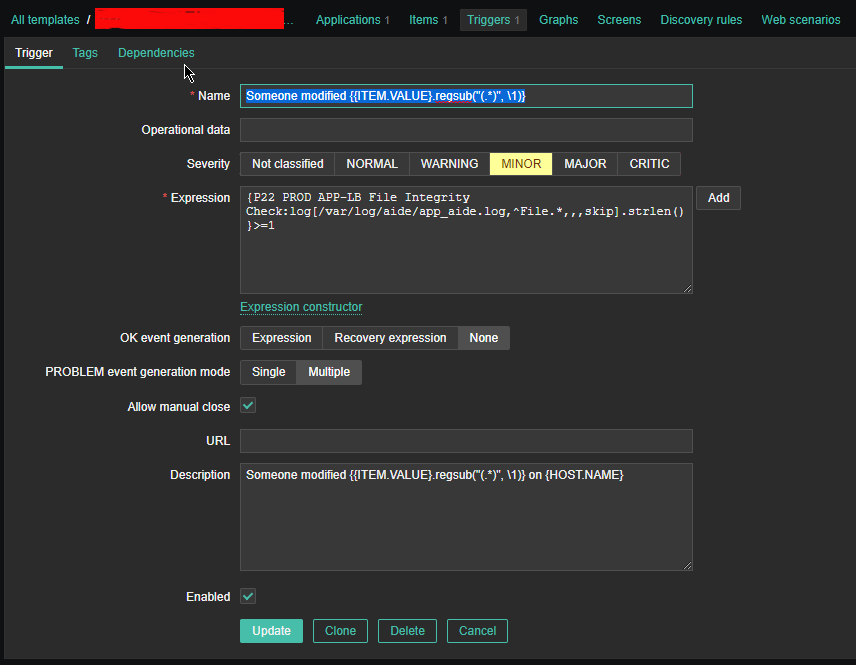
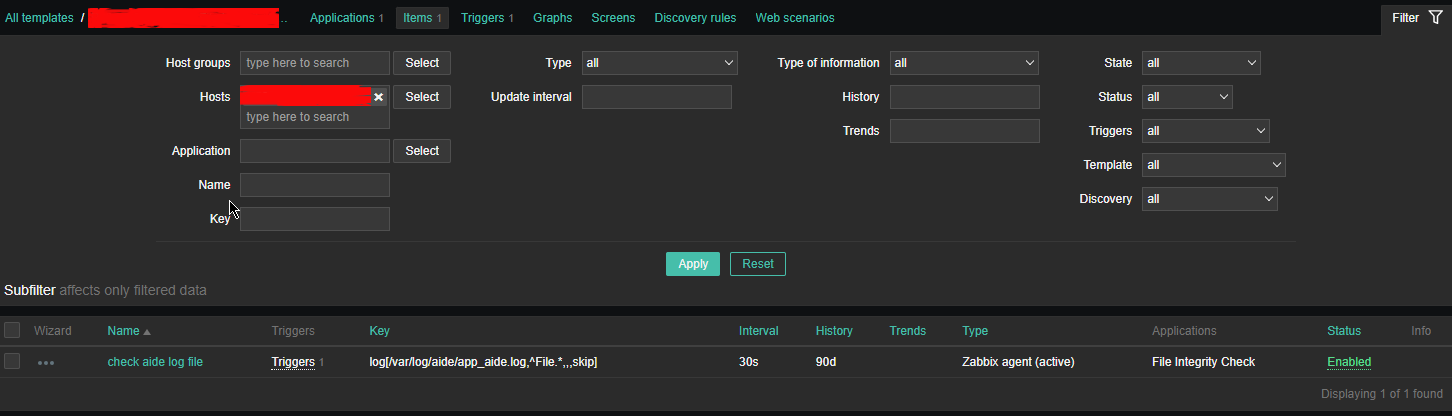
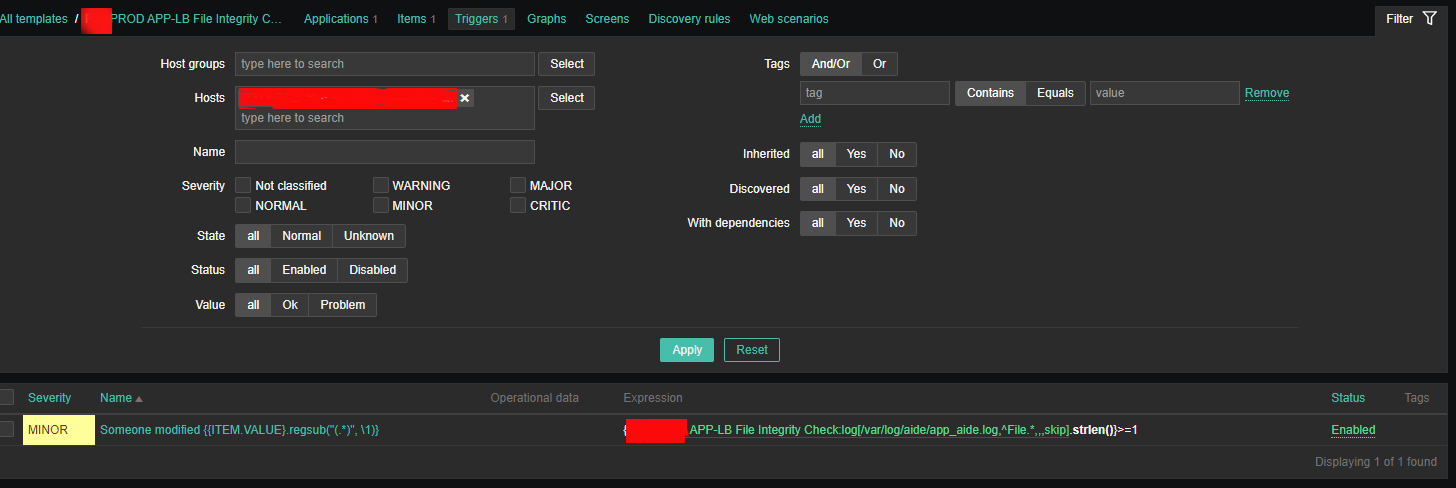
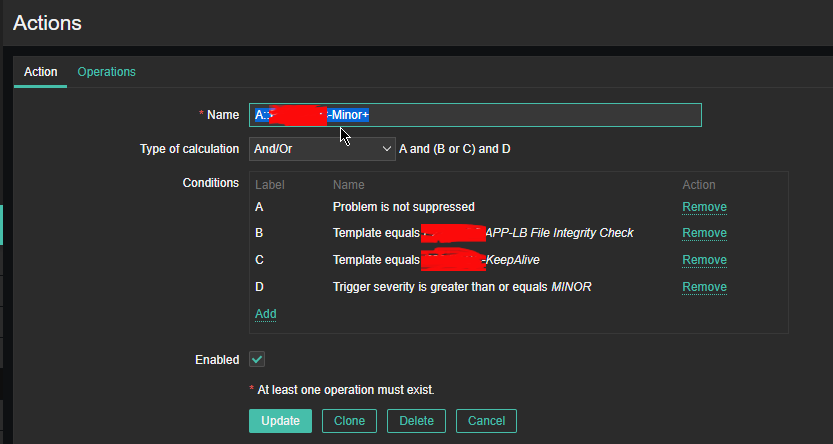
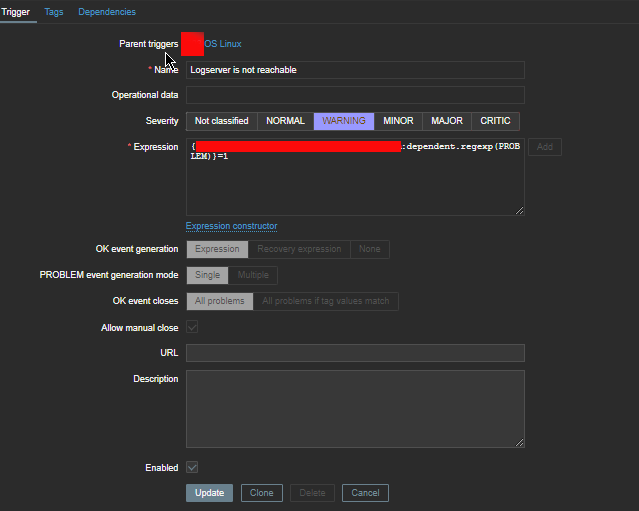
4. Create a Zabbix trigger 

check-log-server-status-trigger-logserver-is-unreachable-zabbix


The redded hided field in Expression field should be substituted with your actual hostname on which the monitor script will run.

How to monitor Haproxy Application server backends with Zabbix userparameter autodiscovery scripts

Friday, May 13th, 2022

zabbix-backend-monitoring-logo

Haproxy is doing quite a good job in High Availability tasks where traffic towards multiple backend servers has to be redirected based on the available one to sent data from the proxy to. 

Lets say haproxy is configured to proxy traffic for App backend machine1 and App backend machine2.

Usually in companies people configure a monitoring like with Icinga or Zabbix / Grafana to keep track on the Application server is always up and running. Sometimes however due to network problems (like burned Network Switch / router or firewall misconfiguration) or even an IP duplicate it might happen that Application server seems to be reporting reachable from some monotoring tool on it but unreachable from  Haproxy server -> App backend machine2 but reachable from App backend machine1. And even though haproxy will automatically switch on the traffic from backend machine2 to App machine1. It is a good idea to monitor and be aware that one of the backends is offline from the Haproxy host.
In this article I'll show you how this is possible by using 2 shell scripts and userparameter keys config through the autodiscovery zabbix legacy feature.
Assumably for the setup to work you will need to have as a minimum a Zabbix server installation of version 5.0 or higher.

1. Create the required  haproxy_discovery.sh  and haproxy_stats.sh scripts 

You will have to install the two scripts under some location for example we can put it for more clearness under /etc/zabbix/scripts

[root@haproxy-server1 ]# mkdir /etc/zabbix/scripts

[root@haproxy-server1 scripts]# vim haproxy_discovery.sh 
#!/bin/bash
#
# Get list of Frontends and Backends from HAPROXY
# Example: ./haproxy_discovery.sh [/var/lib/haproxy/stats] FRONTEND|BACKEND|SERVERS
# First argument is optional and should be used to set location of your HAPROXY socket
# Second argument is should be either FRONTEND, BACKEND or SERVERS, will default to FRONTEND if not set
#
# !! Make sure the user running this script has Read/Write permissions to that socket !!
#
## haproxy.cfg snippet
#  global
#  stats socket /var/lib/haproxy/stats  mode 666 level admin

HAPROXY_SOCK=""/var/run/haproxy/haproxy.sock
[ -n “$1” ] && echo $1 | grep -q ^/ && HAPROXY_SOCK="$(echo $1 | tr -d '\040\011\012\015')"

if [[ “$1” =~ (25[0-5]|2[0-4][0-9]|[01]?[0-9][0-9]?)\.(25[0-5]|2[0-4][0-9]|[01]?[0-9][0-9]?)\.(25[0-5]|2[0-4][0-9]|[01]?[0-9][0-9]?)\.(25[0-5]|2[0-4][0-9]|[01]?[0-9][0-9]?):[0-9]{1,5} ]];
then
    HAPROXY_STATS_IP="$1"
    QUERYING_METHOD="TCP"
fi

QUERYING_METHOD="${QUERYING_METHOD:-SOCKET}"

query_stats() {
    if [[ ${QUERYING_METHOD} == “SOCKET” ]]; then
        echo "show stat" | socat ${HAPROXY_SOCK} stdio 2>/dev/null
    elif [[ ${QUERYING_METHOD} == “TCP” ]]; then
        echo "show stat" | nc ${HAPROXY_STATS_IP//:/ } 2>/dev/null
    fi
}

get_stats() {
        echo "$(query_stats)" | grep -v "^#"
}

[ -n “$2” ] && shift 1
case $1 in
        B*) END="BACKEND" ;;
        F*) END="FRONTEND" ;;
        S*)
                for backend in $(get_stats | grep BACKEND | cut -d, -f1 | uniq); do
                        for server in $(get_stats | grep "^${backend}," | grep -v BACKEND | grep -v FRONTEND | cut -d, -f2); do
                                serverlist="$serverlist,\n"'\t\t{\n\t\t\t"{#BACKEND_NAME}":"'$backend'",\n\t\t\t"{#SERVER_NAME}":"'$server'"}'
                        done
                done
                echo -e '{\n\t"data":[\n’${serverlist#,}’]}'
                exit 0
        ;;
        *) END="FRONTEND" ;;
esac

for frontend in $(get_stats | grep "$END" | cut -d, -f1 | uniq); do
    felist="$felist,\n"'\t\t{\n\t\t\t"{#'${END}'_NAME}":"'$frontend'"}'
done
echo -e '{\n\t"data":[\n’${felist#,}’]}'


[root@haproxy-server1 scripts]# vim haproxy_stats.sh 
#!/bin/bash
set -o pipefail

if [[ “$1” = /* ]]
then
  HAPROXY_SOCKET="$1"
  shift 0
else
  if [[ “$1” =~ (25[0-5]|2[0-4][0-9]|[01]?[0-9][0-9]?)\.(25[0-5]|2[0-4][0-9]|[01]?[0-9][0-9]?)\.(25[0-5]|2[0-4][0-9]|[01]?[0-9][0-9]?)\.(25[0-5]|2[0-4][0-9]|[01]?[0-9][0-9]?):[0-9]{1,5} ]];
  then
    HAPROXY_STATS_IP="$1"
    QUERYING_METHOD="TCP"
    shift 1
  fi
fi

pxname="$1"
svname="$2"
stat="$3"

DEBUG=${DEBUG:-0}
HAPROXY_SOCKET="${HAPROXY_SOCKET:-/var/run/haproxy/haproxy.sock}"
QUERYING_METHOD="${QUERYING_METHOD:-SOCKET}"
CACHE_STATS_FILEPATH="${CACHE_STATS_FILEPATH:-/var/tmp/haproxy_stats.cache}"
CACHE_STATS_EXPIRATION="${CACHE_STATS_EXPIRATION:-1}" # in minutes
CACHE_INFO_FILEPATH="${CACHE_INFO_FILEPATH:-/var/tmp/haproxy_info.cache}" ## unused
CACHE_INFO_EXPIRATION="${CACHE_INFO_EXPIRATION:-1}" # in minutes ## unused
GET_STATS=${GET_STATS:-1} # when you update stats cache outsise of the script
SOCAT_BIN="$(which socat)"
NC_BIN="$(which nc)"
FLOCK_BIN="$(which flock)"
FLOCK_WAIT=15 # maximum number of seconds that "flock" waits for acquiring a lock
FLOCK_SUFFIX='.lock'
CUR_TIMESTAMP="$(date '+%s')"

debug() {
  [ “${DEBUG}” -eq 1 ] && echo "DEBUG: $@" >&2 || true
}

debug "SOCAT_BIN        => $SOCAT_BIN"
debug "NC_BIN           => $NC_BIN"
debug "FLOCK_BIN        => $FLOCK_BIN"
debug "FLOCK_WAIT       => $FLOCK_WAIT seconds"
debug "CACHE_FILEPATH   => $CACHE_FILEPATH"
debug "CACHE_EXPIRATION => $CACHE_EXPIRATION minutes"
debug "HAPROXY_SOCKET   => $HAPROXY_SOCKET"
debug "pxname   => $pxname"
debug "svname   => $svname"
debug "stat     => $stat"

# check if socat is available in path
if [ “$GET_STATS” -eq 1 ] && [[ $QUERYING_METHOD == “SOCKET” && -z “$SOCAT_BIN” ]] || [[ $QUERYING_METHOD == “TCP” &&  -z “$NC_BIN” ]]
then
  echo 'ERROR: cannot find socat binary'
  exit 126
fi

# if we are getting stats:
#   check if we can write to stats cache file, if it exists
#     or cache file path, if it does not exist
#   check if HAPROXY socket is writable
# if we are NOT getting stats:
#   check if we can read the stats cache file
if [ “$GET_STATS” -eq 1 ]
then
  if [ -e “$CACHE_FILEPATH” ] && [ ! -w “$CACHE_FILEPATH” ]
  then
    echo 'ERROR: stats cache file exists, but is not writable'
    exit 126
  elif [ ! -w ${CACHE_FILEPATH%/*} ]
  then
    echo 'ERROR: stats cache file path is not writable'
    exit 126
  fi
  if [[ $QUERYING_METHOD == “SOCKET” && ! -w $HAPROXY_SOCKET ]]
  then
    echo "ERROR: haproxy socket is not writable"
    exit 126
  fi
elif [ ! -r “$CACHE_FILEPATH” ]
then
  echo 'ERROR: cannot read stats cache file'
  exit 126
fi

# index:name:default
MAP="
1:pxname:@
2:svname:@
3:qcur:9999999999
4:qmax:0
5:scur:9999999999
6:smax:0
7:slim:0
8:stot:@
9:bin:9999999999
10:bout:9999999999
11:dreq:9999999999
12:dresp:9999999999
13:ereq:9999999999
14:econ:9999999999
15:eresp:9999999999
16:wretr:9999999999
17:wredis:9999999999
18:status:UNK
19:weight:9999999999
20:act:9999999999
21:bck:9999999999
22:chkfail:9999999999
23:chkdown:9999999999
24:lastchg:9999999999
25:downtime:0
26:qlimit:0
27:pid:@
28:iid:@
29:sid:@
30:throttle:9999999999
31:lbtot:9999999999
32:tracked:9999999999
33:type:9999999999
34:rate:9999999999
35:rate_lim:@
36:rate_max:@
37:check_status:@
38:check_code:@
39:check_duration:9999999999
40:hrsp_1xx:@
41:hrsp_2xx:@
42:hrsp_3xx:@
43:hrsp_4xx:@
44:hrsp_5xx:@
45:hrsp_other:@
46:hanafail:@
47:req_rate:9999999999
48:req_rate_max:@
49:req_tot:9999999999
50:cli_abrt:9999999999
51:srv_abrt:9999999999
52:comp_in:0
53:comp_out:0
54:comp_byp:0
55:comp_rsp:0
56:lastsess:9999999999
57:last_chk:@
58:last_agt:@
59:qtime:0
60:ctime:0
61:rtime:0
62:ttime:0
"

_STAT=$(echo -e "$MAP" | grep :${stat}:)
_INDEX=${_STAT%%:*}
_DEFAULT=${_STAT##*:}

debug "_STAT    => $_STAT"
debug "_INDEX   => $_INDEX"
debug "_DEFAULT => $_DEFAULT"

# check if requested stat is supported
if [ -z “${_STAT}” ]
then
  echo "ERROR: $stat is unsupported"
  exit 127
fi

# method to retrieve data from haproxy stats
# usage:
# query_stats "show stat"
query_stats() {
    if [[ ${QUERYING_METHOD} == “SOCKET” ]]; then
        echo $1 | socat ${HAPROXY_SOCKET} stdio 2>/dev/null
    elif [[ ${QUERYING_METHOD} == “TCP” ]]; then
        echo $1 | nc ${HAPROXY_STATS_IP//:/ } 2>/dev/null
    fi
}

# a generic cache management function, that relies on 'flock'
check_cache() {
  local cache_type="${1}"
  local cache_filepath="${2}"
  local cache_expiration="${3}"  
  local cache_filemtime
  cache_filemtime=$(stat -c '%Y' "${cache_filepath}" 2> /dev/null)
  if [ $((cache_filemtime+60*cache_expiration)) -ge ${CUR_TIMESTAMP} ]
  then
    debug "${cache_type} file found, results are at most ${cache_expiration} minutes stale.."
  elif "${FLOCK_BIN}" –exclusive –wait "${FLOCK_WAIT}" 200
  then
    cache_filemtime=$(stat -c '%Y' "${cache_filepath}" 2> /dev/null)
    if [ $((cache_filemtime+60*cache_expiration)) -ge ${CUR_TIMESTAMP} ]
    then
      debug "${cache_type} file found, results have just been updated by another process.."
    else
      debug "no ${cache_type} file found, querying haproxy"
      query_stats "show ${cache_type}" > "${cache_filepath}"
    fi
  fi 200> "${cache_filepath}${FLOCK_SUFFIX}"
}

# generate stats cache file if needed
get_stats() {
  check_cache 'stat' "${CACHE_STATS_FILEPATH}" ${CACHE_STATS_EXPIRATION}
}

# generate info cache file
## unused at the moment
get_info() {
  check_cache 'info' "${CACHE_INFO_FILEPATH}" ${CACHE_INFO_EXPIRATION}
}

# get requested stat from cache file using INDEX offset defined in MAP
# return default value if stat is ""
get() {
  # $1: pxname/svname
  local _res="$("${FLOCK_BIN}" –shared –wait "${FLOCK_WAIT}" "${CACHE_STATS_FILEPATH}${FLOCK_SUFFIX}" grep $1 "${CACHE_STATS_FILEPATH}")"
  if [ -z “${_res}” ]
  then
    echo "ERROR: bad $pxname/$svname"
    exit 127
  fi
  _res="$(echo $_res | cut -d, -f ${_INDEX})"
  if [ -z “${_res}” ] && [[ “${_DEFAULT}” != “@” ]]
  then
    echo "${_DEFAULT}"  
  else
    echo "${_res}"
  fi
}

# not sure why we'd need to split on backslash
# left commented out as an example to override default get() method
# status() {
#   get "^${pxname},${svnamem}," $stat | cut -d\  -f1
# }

# this allows for overriding default method of getting stats
# name a function by stat name for additional processing, custom returns, etc.
if type get_${stat} >/dev/null 2>&1
then
  debug "found custom query function"
  get_stats && get_${stat}
else
  debug "using default get() method"
  get_stats && get "^${pxname},${svname}," ${stat}
fi


! NB ! Substitute in the script /var/run/haproxy/haproxy.sock with your haproxy socket location

You can download the haproxy_stats.sh here and haproxy_discovery.sh here

2. Create the userparameter_haproxy_backend.conf

[root@haproxy-server1 zabbix_agentd.d]# cat userparameter_haproxy_backend.conf 
#
# Discovery Rule
#

# HAProxy Frontend, Backend and Server Discovery rules
UserParameter=haproxy.list.discovery[*],sudo /etc/zabbix/scripts/haproxy_discovery.sh SERVER
UserParameter=haproxy.stats[*],sudo /etc/zabbix/scripts/haproxy_stats.sh  $2 $3 $4

# support legacy way

UserParameter=haproxy.stat.downtime[*],sudo /etc/zabbix/scripts/haproxy_stats.sh  $2 $3 downtime

UserParameter=haproxy.stat.status[*],sudo /etc/zabbix/scripts/haproxy_stats.sh  $2 $3 status

UserParameter=haproxy.stat.last_chk[*],sudo /etc/zabbix/scripts/haproxy_stats.sh  $2 $3 last_chk


3. Create new simple template for the Application backend Monitoring and link it to monitored host

create-configuration-template-backend-monitoring

create-template-backend-monitoring-macros


Go to Configuration -> Hosts (find the host) and Link the template to it


4. Restart Zabbix-agent, in while check autodiscovery data is in Zabbix Server

[root@haproxy-server1 ]# systemctl restart zabbix-agent


Check in zabbix the userparameter data arrives, it should not be required to add any Items or Triggers as autodiscovery zabbix feature should automatically create in the server what is required for the data regarding backends to be in.

To view data arrives go to Zabbix config menus:

Configuration -> Hosts -> Hosts: (lookup for the haproxy-server1 hostname)

zabbix-discovery_rules-screenshot

The autodiscovery should have automatically created the following prototypes

zabbix-items-monitoring-prototypes
Now if you look inside Latest Data for the Host you should find some information like:

HAProxy Backend [backend1] (3 Items)
        
HAProxy Server [backend-name_APP/server1]: Connection Response
2022-05-13 14:15:04            History
        
HAProxy Server [backend-name/server2]: Downtime (hh:mm:ss)
2022-05-13 14:13:57    20:30:42        History
        
HAProxy Server [bk_name-APP/server1]: Status
2022-05-13 14:14:25    Up (1)        Graph
        ccnrlb01    HAProxy Backend [bk_CCNR_QA_ZVT] (3 Items)
        
HAProxy Server [bk_name-APP3/server1]: Connection Response
2022-05-13 14:15:05            History
        
HAProxy Server [bk_name-APP3/server1]: Downtime (hh:mm:ss)
2022-05-13 14:14:00    20:55:20        History
        
HAProxy Server [bk_name-APP3/server2]: Status
2022-05-13 14:15:08    Up (1)

To make alerting in case if a backend is down which usually you would like only left thing is to configure an Action to deliver alerts to some email address.