Archive for the ‘System Optimization’ Category

How to count number of ESTABLISHED state TCP connections to a Windows server

Wednesday, March 13th, 2024

count-netstat-established-connections-on-windows-server-howto-windows-logo-debug-network-issues-windows

Even if you have the background of a Linux system administrator, sooner or later you will have have to deal with some Windows hosts, thus i'll blog in this article shortly on how the established TCP if it happens you will have to administarte a Windows hosts or help a windows sysadmin noobie 🙂

In Linux it is pretty easy to check the number of established conenctions, because of the wonderful command wc (word count). with a simple command like:
 

$ netstat -etna |wc -l


Then you will get the number of active TCP connections to the machine and based on that you can get an idea on how busy the server is.

But what if you have to deal with lets say a Microsoft Windows 2012 /2019 / 2020 or 2022 Server, assuming you logged in as Administrator and you see the machine is quite loaded and runs multiple Native Windows Administrator common services such as IIS / Active directory Failover Clustering, Proxy server etc.
How can you identify the established number of connections via a simple command in cmd.exe?

1.Count ESTABLISHED TCP connections from Windows Command Line

Here is the answer, simply use netstat native windows command and combine it with find, like that and use the /i (ignores the case of characters when searching the string) /c (count lines containing the string) options

C:\Windows\system32>netstat -p TCP -n|  find /i "ESTABLISHED" /c
1268

Voila, here are number of established connections, only 1268 that is relatively low.
However if you manage Windows servers, and you get some kind of hang ups as part of the monitoring, it is a good idea to setup a script based on this simple command for at least Windows Task Scheduler (the equivallent of Linux's crond service) to log for Peaks in Established connections to see whether Server crashes are not related to High Rise in established connections.
Even better if company uses Zabbix / Nagios, OpenNMS or other  old legacy monitoring stuff like Joschyd even as of today 2024 used in some big of the TOP IT companies such as SAP (they were still using it about 4 years ago for their SAP HANA Cloud), you can set the script to run and do a Monitoring template or Alerting rules to draw you graphs and Trigger Alerts if your connections hits a peak, then you at least might know your Windows server is under a "Hackers" Denial of Service attack or there is something happening on the network, like Cisco Network Infrastructure Switch flappings or whatever.

Perhaps an example script you can use if you decide to implement the little nestat established connection checks Monitoring in Zabbix is the one i've writen about in the previous article "Calculate established connection from IP address with shell script and log to zabbix graphic".

2. Few Useful netstat options for the Windows system admin
 

C:\Windows\System32> netstat -bona


netstat-useful-arguments-for-the-windows-system-administrator

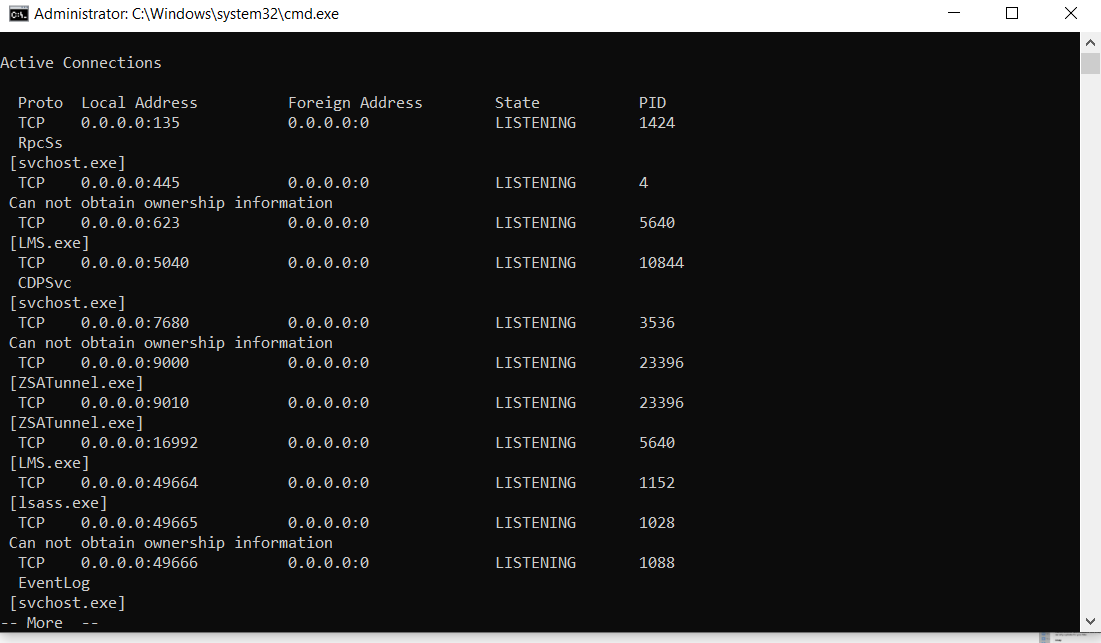
Cmd.exe will lists executable files, local and external IP addresses and ports, and the state in list form. You immediately see which programs have created connections or are listening so that you can find offenders quickly.

b – displays the executable involved in  creating the connection.
o – displays the owning process ID.
n – displays address and port numbers.
a – displays all connections and listening ports.

As you can see in the screenshot, by using netstat -bona you get which process has binded to which local address and the Process ID PID of it, that is pretty useful in debugging stuff.

3. Use a Third Party GUI tool to debug more interactively connection issues

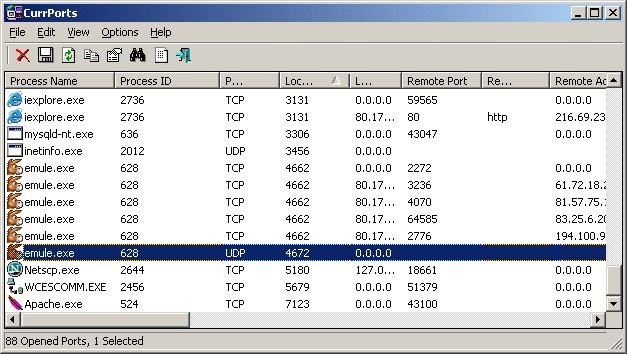
If you need to keep an eye in interactive mode, sometimes if there are issues CurrPorts tool can be of a great help

currports-windows-network-connections-diagnosis-cports

CurrPorts Tool own Description

CurrPorts is network monitoring software that displays the list of all currently opened TCP/IP and UDP ports on your local computer. For each port in the list, information about the process that opened the port is also displayed, including the process name, full path of the process, version information of the process (product name, file description, and so on), the time that the process was created, and the user that created it.
In addition, CurrPorts allows you to close unwanted TCP connections, kill the process that opened the ports, and save the TCP/UDP ports information to HTML file , XML file, or to tab-delimited text file.
CurrPorts also automatically mark with pink color suspicious TCP/UDP ports owned by unidentified applications (Applications without version information and icons).

Sum it up

What we learned is how to calculate number of established TCP connections from command line, useful for scripting, how you can use netstat to display the process ID and Process name that relates to a used Local / Remote TCP connections, and how eventually you can use this to connect it to some monitoring tool to periodically report High Peaks with TCP established connections (usually an indicator of servere system issues).
 

IPFilter firewall basics use for Adding / Removing and Cloning firewall rules

Thursday, June 1st, 2023

ipfilter-bsd-solaris-unix-firewall-short-review-ofLinux_firewalls-BSD_Firewall_logo

Linux users have most definitely used Netfilter (the older from us might remember and have used ipchains) and rest
should know well or at least partially tried iptables or if you have digged into Linux firewalls more professionally, might have tried nftables
and the newer firewalld (firewall-cmd) that is the standard nowadays in CentOS / Fedora and RHEL (again an abstraction over iptables.).
On Debian firewall is organized around custom shell scripts that deal with iptables chains, or if on Ubuntu perhaps you have tried UFW (The Uncomplicated Firewall)
frontend program for managing firewalls again with iptables. For the lazy ones UFW even has another GUI frontend called Gufw (intended to be easy, intuitive,
graphical user interface for managing Uncomlicated firewall.

Different Linux distributions do use a different set of firewall mechanisms preconfigure but there are other firewall solutions on other Unixes such as ipfilter.
That historically were heavily used that is worthy mentioning and if you happen to pop-up working as a network guy inside some large corporations you might face it.

IPFilter (commonly referred to as ipf) is an open-source software package that provides firewall services and network address translation (NAT) for many Unix-like operating systems.
The author and software maintainer is Darren Reed. IPFilter supports both IPv4 and IPv6 protocols, and is a stateful firewall.
IPFilter is delivered with FreeBSD, NetBSD, Solaris 10 & 11, illumos, OpenIndiana and HP-UX.
It used to be a part of OpenBSD, but it was removed by Theo de Raadt in May 2001 due to problems with its license.
It was subsequently replaced in OpenBSD by PF, which was developed by OpenBSD's own developers.
DragonFly BSD removed its support for IPFilter in May 2011.

IPFilter can be installed as a runtime-loadable kernel module or directly incorporated into the operating system kernel, depending on the specifics of each kernel and user preferences.
The software's documentation recommends the module approach, if possible.

Here are some commands for displaying, changing and distributing IP filters with ipfilter.
It will be mostly useful, if you happen to have some obsolete OS infrastructure or OpenBSD.

The commands given below are to add / remove and activate rules on machine with ipfilter:

# ipfilter –clone
# ipfilter –save
# ipfilter –activate
# ipfilter -addrule
# ipfilter -delrule
# help ipfilter

1. Check ipfilter current config

# ipfilter –show
Name: default_ipv4, Type: ipv4, State: active
Rule    Source IP                               Protocol   Dest Port   Action
1     any                                            tcp       22     permit
2     any                                            tcp       23     permit
3     any                                            tcp       80     permit
4     any                                            tcp      443     permit
5     any                                            udp      161     permit
6     any                                            udp      123     permit
7     any                                            tcp      600 – 1023     permit
8     any                                            udp      600 – 1023     permit
Name: default_ipv6, Type: ipv6, State: active
Rule    Source IP                               Protocol   Dest Port   Action
1     any                                            tcp       22     permit
2     any                                            tcp       23     permit
3     any                                            tcp       80     permit
4     any                                            tcp      443     permit
5     any                                            udp      161     permit
6     any                                            udp      123     permit
7     any                                            tcp      600 – 1023     permit
8     any                                            udp      600 – 1023     permit
Name: default_ipv4_new, Type: ipv4, State: defined
Rule    Source IP                               Protocol   Dest Port   Action
1     any                                            tcp       22     permit
2     any                                            tcp       23     permit
3     any                                            tcp       80     permit
4     any                                            tcp      443     permit
5     any                                            udp      161     permit
6     any                                            udp      123     permit
7     any                                            tcp      600 – 1023     permit
8     any                                            udp      600 – 1023     permit

2. Clone and activate ipfilter configuration

# ipfilter –clone default_ipv4_new -from default_ipv4
# ipfilter –activate default_ipv4_new
# ipfilter –show
Name: default_ipv4, Type: ipv4, State: defined
Rule    Source IP                               Protocol   Dest Port   Action
1     any                                            tcp       22     permit
2     any                                            tcp       23     permit
3     any                                            tcp       80     permit
4     any                                            tcp      443     permit
5     any                                            udp      161     permit
6     any                                            udp      123     permit
7     any                                            tcp      600 – 1023     permit
8     any                                            udp      600 – 1023     permit
Name: default_ipv6, Type: ipv6, State: active
Rule    Source IP                               Protocol   Dest Port   Action
1     any                                            tcp       22     permit
2     any                                            tcp       23     permit
3     any                                            tcp       80     permit
4     any                                            tcp      443     permit
5     any                                            udp      161     permit
6     any                                            udp      123     permit
7     any                                            tcp      600 – 1023     permit
8     any                                            udp      600 – 1023     permit
Name: default_ipv4_neu, Type: ipv4, State: active
Rule    Source IP                               Protocol   Dest Port   Action
1     any                                            tcp       22     permit
2     any                                            tcp       23     permit
3     any                                            tcp       80     permit
4     any                                            tcp      443     permit
5     any                                            udp      161     permit
6     any                                            udp      123     permit
7     any                                            tcp      600 – 1023     permit
8     any                                            udp      600 – 1023     permit

3. Modify cloned configuration

Lets say we would like to delete the telnet port accept traffic rule  (port 23)

# ipfilter –delrule default_ipv4_new -rule 2

To permit the rule agian

# ipfilter –addrule default_ipv4_new -rule 2 -sip any -dp 23 -proto tcp -act permit

To save the rule

# ipfilter –save default_ipv4_new                          

How to log every Linux executed command by every running system program to separte log via rsyslog for better server Security and audit trails

Wednesday, March 15th, 2023

snoopy-log-all-commands-on-linux-server-tux-logo

To keep a good eye on installed Debian Linux server security if you have to be PCI compliant (e.g. follow a high security) standards or you work in a company, where system security is crucial and any kind of security breach is untorrelated and in case of unexpected security holes exploited on running system processess listening on network peripherals (that malicious crackers) does to be able to easily identify what really happened e.g. do a Security RCA (Root Cause Analysis) for how this hack happened in order to mitigate it for future if possible capture the crackers and close the security hole the better, some kind of paranoid running program logging is required.

For such higher security systems, Linux / BSD / UNIX sysadmins can benefit from;

Snoopy command logger – a small library that logs all program executions on your Linux/BSD system.

Embedding snoopy into a running uptodate system is relatively easy, you either have to download the respective distribution package (in this particular article that would be Debian GNU / Linux) or for Linux distributions, that doesn't have the package integrated into the existing package repositories or externally available package repos, the code can be easily git cloned and installed from github snoopy program page following the README.md


However consider that snoopy run and logging the executed commands, make sure that if you use it you have rsyslogd configured to log to external logging server to make sure (someone did not manipulate the running system to avoid their actions being logged by snoopy, this is pointed by snoopy security disclaimer on the FAQ of official github snoopy project page, the page reads as so:

Security disclaimer
WARNING: Snoopy is not a reliable auditing solution.
Rogue users can easily manipulate environment to avoid their actions being logged by Snoopy. Consult this FAQ entry for more information.                


Most likely this warning is pointed out by the tool authors, in order to set the logging Tool creators free for any liability in case if someone uses the snoopy tool for some unauthorized logging
and sniffing of systems etc.

Before we proceed with the tool, install first for some clarity it is a good idea to know on what kind of Debian Linux you're about to install Snoopy command logger.

root@linux:~ # cat /etc/os-release
PRETTY_NAME="Debian GNU/Linux 11 (bullseye)"
NAME="Debian GNU/Linux"
VERSION_ID="11"
VERSION="11 (bullseye)"
VERSION_CODENAME=bullseye
ID=debian
HOME_URL="https://www.debian.org/"
SUPPORT_URL="https://www.debian.org/support"
BUG_REPORT_URL="https://bugs.debian.org/"


1. Prepare separate log file for snoopy that will keep log of every system command run by running processes visible by (ps -ef)

Next check the permissions user / group and read / write / executable flags with which the default generated rsyslog will be writting and set snoopy to whatever you would like it to write with

root@linux:~ # cat /etc/rsyslog.conf | grep "^\$File\|\$Umask"~
$FileOwner root
$FileGroup adm
$FileCreateMode 0640


Create Rsyslog configuration for snoopy.log

root@linux:~ # cat << EOF | sudo tee /etc/rsyslog.d/01-snoopy.conf
# Send snoopy messages to a dedicated logfile
if (\$programname startswith "snoopy") then {
  action(type="omfile" fileOwner="root" fileGroup="root" fileCreateMode="0600" file="/var/log/snoopy.log")
  stop
}

EOF


To make sure that snoopy library will be preloaded after installation on next boot:

root@linux:~ # cat << EOF | sudo debconf-set-selections
snoopy snoopy/install-ld-preload boolean true
EOF


root@linux:~ # systemctl restart rsyslog


root@linux:~ # systemctl status rsyslog
● rsyslog.service – System Logging Service
     Loaded: loaded (/lib/systemd/system/rsyslog.service; enabled; vendor preset: enabled)
     Active: active (running) since Tue 2023-03-14 12:59:05 EET; 59min ago
TriggeredBy: ● syslog.socket
       Docs: man:rsyslogd(8)
             man:rsyslog.conf(5)
             https://www.rsyslog.com/doc/
   Main PID: 713745 (rsyslogd)
      Tasks: 6 (limit: 4654)
     Memory: 1.1M
        CPU: 548ms
     CGroup: /system.slice/rsyslog.service
             └─713745 /usr/sbin/rsyslogd -n -iNONE

мар 14 12:59:05 haproxy2 systemd[1]: Started System Logging Service.
мар 14 12:59:05 haproxy2 rsyslogd[713745]: warning: ~ action is deprecated, consider using the 'stop' statement instead [v8.210>
мар 14 12:59:05 haproxy2 rsyslogd[713745]: [198B blob data]
мар 14 12:59:05 haproxy2 rsyslogd[713745]: imuxsock: Acquired UNIX socket '/run/systemd/journal/syslog' (fd 3) from systemd.  [>
мар 14 12:59:05 haproxy2 rsyslogd[713745]: [origin software="rsyslogd" swVersion="8.2102.0" x-pid="713745" x-info="https://www.>
мар 14 13:19:05 haproxy2 rsyslogd[713745]: — MARK —
мар 14 13:39:05 haproxy2 rsyslogd[713745]: — MARK —


2. Install snoopy deb package and configure it

root@linux:~ # apt install snoopy
Четене на списъците с пакети… Готово
Изграждане на дървото със зависимости… Готово
Четене на информацията за състоянието… Готово
Следните пакети са били инсталирани автоматично и вече не са необходими:
  bsdmainutils cpp-8 geoip-database libasan5 libbind9-161 libcroco3 libdns1104 libdns1110 libevent-core-2.1-6
  libevent-pthreads-2.1-6 libgdk-pixbuf-xlib-2.0-0 libgdk-pixbuf2.0-0 libgeoip1 libicu63 libisc1100 libisc1105 libisccc161
  libisccfg163 libisl19 liblwres161 libmpdec2 libmpx2 libperl5.28 libpython2-stdlib libpython2.7-minimal libpython2.7-stdlib
  libpython3.7-minimal libpython3.7-stdlib libreadline7 netcat-traditional node-ansi-align node-arrify node-bluebird
  node-boxen node-builtin-modules node-call-limit node-camelcase node-cli-boxes node-cliui node-co node-concat-stream
  node-config-chain node-cross-spawn node-cyclist node-decamelize node-decompress-response node-deep-extend node-detect-indent
  node-detect-newline node-duplexer3 node-duplexify node-editor node-end-of-stream node-errno node-execa node-find-up
  node-flush-write-stream node-from2 node-fs-vacuum node-get-caller-file node-get-stream node-got node-has-symbol-support-x
  node-has-to-string-tag-x node-import-lazy node-invert-kv node-is-buffer node-is-builtin-module node-is-npm node-is-object
  node-is-plain-obj node-is-retry-allowed node-is-stream node-isurl node-json-buffer node-kind-of node-latest-version
  node-lazy-property node-lcid node-libnpx node-locate-path node-lowercase-keys node-mem node-merge-stream node-mimic-fn
  node-mimic-response node-minimist node-mississippi node-node-uuid node-npm-run-path node-os-locale node-p-cancelable
  node-p-finally node-p-limit node-p-locate node-p-timeout node-package-json node-parallel-transform node-path-exists
  node-path-is-inside node-prepend-http node-proto-list node-prr node-pump node-pumpify node-qw node-rc
  node-registry-auth-token node-registry-url node-require-directory node-require-main-filename node-semver-diff node-sha
  node-shebang-command node-shebang-regex node-slide node-sorted-object node-stream-each node-stream-iterate node-stream-shift
  node-strip-eof node-strip-json-comments node-term-size node-through2 node-timed-out node-typedarray node-uid-number
  node-unpipe node-url-parse-lax node-url-to-options node-which-module node-widest-line node-wrap-ansi node-xdg-basedir
  node-xtend node-y18n node-yargs node-yargs-parser perl-modules-5.28 python-pkg-resources python2 python2-minimal python2.7
  python2.7-minimal python3.7-minimal

Използвайте „apt autoremove“ за да ги премахнете.
Следните НОВИ пакети ще бъдат инсталирани:
  snoopy
0 актуализирани, 1 нови инсталирани, 0 за премахване и 1 без промяна.
Необходимо е да се изтеглят 46,0 kB архиви.
След тази операция ще бъде използвано 124 kB допълнително дисково пространство.
Изт:1 http://deb.debian.org/debian bullseye/main amd64 snoopy amd64 2.4.12-1 [46,0 kB]
Изтеглени 46,0 kB за 0с (93,2 kB/сек)
Предварително настройване на пакети …


Selecting previously unselected package snoopy.
(Reading database … 56067 files and directories currently installed.)
Preparing to unpack …/snoopy_2.4.12-1_amd64.deb ...
Unpacking snoopy (2.4.12-1) …
Setting up snoopy (2.4.12-1) …
Processing triggers for libc-bin (2.31-13+deb11u5) …

root@linux:/etc# ls -al /var/log/snoopy.log
-rw——- 1 root root 14472 14 мар 13:40 /var/log/snoopy.log

Any specific configuration for snoopy can be tuned through /etc/snoopy.ini

Now you will find all the commands executed by all monitored running processes in /var/log/snoopy.

root@linux:/etc# tail -30 /var/log/snoopy.log
Mar 14 12:59:32 haproxy2 snoopy[713804]: [login:root ssh:(192.168.0.1 62796 192.168.0.210 22) sid:713792 tty:/dev/pts/2 (0/root) uid:root(0)/root(0) cwd:/]: ldconfig
Mar 14 12:59:32 haproxy2 snoopy[713806]: [login:zabbix ssh:((undefined)) sid:682168 tty:(none) ((none)/(none)) uid:zabbix(108)/zabbix(108) cwd:/]: who
Mar 14 12:59:32 haproxy2 snoopy[713807]: [login:zabbix ssh:((undefined)) sid:682168 tty:(none) ((none)/(none)) uid:zabbix(108)/zabbix(108) cwd:/]: wc -l
Mar 14 13:00:07 haproxy2 snoopy[713815]: [login:root ssh:((undefined)) sid:713815 tty:(none) ((none)/(none)) uid:root(0)/root(0) cwd:/usr/lib/sysstat]: /usr/lib/sysstat/sadc -F -L -S DISK 1 1 /var/log/sysstat
Mar 14 13:00:32 haproxy2 snoopy[713823]: [login:zabbix ssh:((undefined)) sid:682168 tty:(none) ((none)/(none)) uid:zabbix(108)/zabbix(108) cwd:/]: who
Mar 14 13:00:32 haproxy2 snoopy[713824]: [login:zabbix ssh:((undefined)) sid:682168 tty:(none) ((none)/(none)) uid:zabbix(108)/zabbix(108) cwd:/]: wc -l
Mar 14 13:01:32 haproxy2 snoopy[713834]: [login:zabbix ssh:((undefined)) sid:682168 tty:(none) ((none)/(none)) uid:zabbix(108)/zabbix(108) cwd:/]: who
Mar 14 13:01:32 haproxy2 snoopy[713835]: [login:zabbix ssh:((undefined)) sid:682168 tty:(none) ((none)/(none)) uid:zabbix(108)/zabbix(108) cwd:/]: wc -l
Mar 14 13:02:32 haproxy2 snoopy[713843]: [login:zabbix ssh:((undefined)) sid:682168 tty:(none) ((none)/(none)) uid:zabbix(108)/zabbix(108) cwd:/]: who
Mar 14 13:02:32 haproxy2 snoopy[713844]: [login:zabbix ssh:((undefined)) sid:682168 tty:(none) ((none)/(none)) uid:zabbix(108)/zabbix(108) cwd:/]: wc -l
Mar 14 13:03:32 haproxy2 snoopy[713855]: [login:zabbix ssh:((undefined)) sid:682168 tty:(none) ((none)/(none)) uid:zabbix(108)/zabbix(108) cwd:/]: who
Mar 14 13:03:32 haproxy2 snoopy[713856]: [login:zabbix ssh:((undefined)) sid:682168 tty:(none) ((none)/(none)) uid:zabbix(108)/zabbix(108) cwd:/]: wc -l
Mar 14 13:04:32 haproxy2 snoopy[713868]: [login:zabbix ssh:((undefined)) sid:682168 tty:(none) ((none)/(none)) uid:zabbix(108)/zabbix(108) cwd:/]: who


3. Set up logrotation (archiving) for snoopy logs

root@linux:/etc# vim /etc/logrotate.d/snoopy    


/var/log/snoopy.log {
        daily
        rotate 30
        compress
        delaycompress
        notifempty
        create 640 root adm

}
 

If you want to test logrotation without actually rotating the file:               

root@linux:/etc# logrotate –debug –force /etc/logrotate.d/snoopy   
  log needs rotating
rotating log /var/log/snoopy.log, log->rotateCount is 30
dateext suffix '-20230314'
glob pattern '-[0-9][0-9][0-9][0-9][0-9][0-9][0-9][0-9]'
previous log /var/log/snoopy.log.1 does not exist
renaming /var/log/snoopy.log.30.gz to /var/log/snoopy.log.31.gz (rotatecount 30, logstart 1, i 30),


renaming /var/log/snoopy.log.1.gz to /var/log/snoopy.log.2.gz (rotatecount 30, logstart 1, i 1),
renaming /var/log/snoopy.log.0.gz to /var/log/snoopy.log.1.gz (rotatecount 30, logstart 1, i 0),
log /var/log/snoopy.log.31.gz doesn't exist — won't try to dispose of it
renaming /var/log/snoopy.log to /var/log/snoopy.log.1
creating new /var/log/snoopy.log mode = 0640 uid = 0 gid = 4


4. Monitoring only selected applications  executed commands with snoopy                                                                             

By default snoopy after installed will set itself to monitor all kind of running processes on the system is done by preloading the ldconfig's (libcld.so.preload

root@haproxy2:/etc# cat /etc/ld.so.preload
/lib/x86_64-linux-gnu/libsnoopy.so

If you want to monitor a concrete application and not log everything from the running processes in process list, comment this out this line run ldconfig command

Then to any concrete application you would like to monitor with snoopy add to its init script either /etc/init.d/app_init_script or to systemctl's start script before the application binary program run:

export LD_PRELOAD=/lib/snoopy.so


  As per the README states


 Snoopy is placed in /etc/ld.so.preload to trap all occurrences of exec, if 
 you wish to monitor only certain applications you can do so through the    
 LD_PRELOAD environment variable.
Simply set it to /lib/snoopy.so before  loading the application.

For example

 # export LD_PRELOAD=/lib/snoopy.so                                           
 # lynx http://example.com/                           


Linux extending life time for a damaged hard drive server tricks on a live server. Force fcsk on next reboot.Read-only file system error solutions

Friday, February 17th, 2023

linux-extending-life-time-for-a-damaged-hard-drive-server-tricks-can-not-read-superblock-linux-force-fsck-on-next-reboot

In our daily work as system administrators we have some very old Legacy systems running Clustered High Availability proxies using CRM (Cluster Resource Manager) and some legacy systems still using Heartbeat to manage the cluster instead of the newer and modern Corosync variant.

The HA cluster is only 2 nodes Linux machine and running the obscure already long time unsupported version of Redhat 5.11 (Ootpa) who was officially became stable distant year 1998 (yeath the years were good) and whose EOL (End of Life) has been reached long time ago and the OS is no longer supported, however for about 14 years the machines has been running perfectly fine until one of the Cluster nodes managed by ocf::heartbeat:IPAddr2 , that is  /etc/ha.d/resource.d/IPAddr2 shell script. Yeah for the newbies Heartbeat Application Cluster in Linux does work like that it uses a number of extendable pair of shell scripts written for different kind of Network / Web / Mail / SQL or whatever services HA management.

The first node configured however, started failing due to some errors like:
 

EXT3-fs error (device dm-1): ext3_journal_start_sb: Detected aborted journal
sd 0:2:0:0: rejecting I/O to offline device
Aborting journal on device sda1.
sd 0:2:0:0: rejecting I/O to offline device
printk: 159 messages suppressed.
Buffer I/O error on device sda1, logical block 526
lost page write due to I/O error on sda1
sd 0:2:0:0: rejecting I/O to offline device
ext3_abort called.
EXT3-fs error (device sda1): ext3_journal_start_sb: Detected aborted journal
Remounting filesystem read-only
sd 0:2:0:0: rejecting I/O to offline device
megaraid_sas: FW was restarted successfully, initiating next stage…
megaraid_sas: HBA recovery state machine, state 2 starting…
megasas: Waiting for FW to come to ready state
megasas: FW in FAULT state!!
FW state [-268435456] hasn't changed in 180 secs
megaraid_sas: out: controller is not in ready state
megasas: waiting_for_outstanding: after issue OCR. 
megasas: waiting_for_outstanding: before issue OCR. FW state = f0000000
megaraid_sas: pending commands remain even after reset handling. megasas[0]: Dumping Frame Phys Address of all pending cmds in FW
megasas[0]: Total OS Pending cmds : 0 megasas[0]: 64 bit SGLs were sent to FW
megasas[0]: Pending OS cmds in FW :

The result out of that was a frequently the filesystem of the machine got re-mounted as Read Only and of course that is
quite bad if you have a running processess of haproxy that should be able to be living their and take up some Web traffic
for high availability and you run all the traffic only on the 2nd pair of machine.

This of course was a clear sign for a failing disks or some hit bad blocks regions or as the messages indicates, some
problem with system hardware or Raid SAS Array.

The physical raid on the system, just like rest of the hardware is very old stuff as well.

[root@haproxy_lb_node1 ~]# lspci |grep -i RAI
01:00.0 RAID bus controller: LSI Logic / Symbios Logic MegaRAID SAS 2108 [Liberator] (rev 05)

The produced errors not only made the machine to auto-mount its root / filesystem in Read-Only mode but besides has most
likely made the machine to automatically reboot every few days or few times every day in a raw.

The second Load Balancer node2 did operated perfectly, and we thought that we might just keep the broken machine in that half running
and inconsistent state for few weeks until we have built the new machines with Pre-Installed new haproxy cluster with modern
RedHat Linux 8.6 distribution, but since we have to follow SLAs (Service Line Agreements) with Customers and the end services behind the
High Availability (HA) Haproxy cluster were at danger … 

We as sysadmins had the task to make our best to try to stabilize the unstable node with disk errors for the system to servive
and be able to normally serve traffic (if node2 that is in a separate Data center fails due to a hardware or electricity issues etc.)
.

Here is few steps we took, that has hopefully improved the situation.

1. Make backups of most important files of high importance

Always before doing anything with a broken system, prepare backup of the most important files, if that is a cluster that should be a backup of the cluster configurations (if you don't have already ones) backup of /etc/hosts / backup of any important services configs /etc/haproxy/haproxy.cfg /etc/postfix/postfix.cfg (like it was my case), preferrably backup of whole /etc/  any important files from /root/ or /home/users* directories backup of at leasts latest logs from /var/log etc.
 

2. Clear up all unnecessery services scripts from the server

Any additional Softwares / Services and integrity checking tools (daemons) / scripts and cron jobs, were immediately stopped and wheter unused removed.

E.g. we had moved through /etc/cron* to check what's there,

# ls -ld /etc/cron.*
drwx—— 2 root root 4096 Feb  7 18:13 /etc/cron.d
drwxr-xr-x 2 root root 4096 Feb  7 17:59 /etc/cron.daily
-rw-r–r– 1 root root    0 Jul 20  2010 /etc/cron.deny
drwxr-xr-x 2 root root 4096 Jan  9  2013 /etc/cron.hourly
drwxr-xr-x 2 root root 4096 Jan  9  2013 /etc/cron.monthly
drwxr-xr-x 2 root root 4096 Aug 26  2015 /etc/cron.weekly


And like well professional butchers removed everything unnecessery that could trigger any extra unnecessery disk read / writes to HDD.

E.g. just create

# mkdir -p /root/etc_old/{/etc/cron.d,\
/etc/cron.daily,/etc/cron.hourly,/etc/cron.monthly\
,/etc/cron.weekly}


And moved all unnecessery cron job scripts like:

1. nmon (old school network / memory / hard disk console tool for monitoring and tuning server parameters)
2. clamscan / freshclam crons
3. mlocate (the script that is taking care for periodic run of updatedb command to keep the locate command to easily search
for files inside the DB to put less read operations on disk in case if you need to find file (e.g. prevent yourself to everytime
run cmd like: find / . -iname '*whatever_you_look_for*'
4. cups cron jobs
5. logwatch cron
6. rkhunter stuff
7. logrotate (yes we stopped even logrotation trigger job as we found the server was crashing sometimes at the same time when
the lograte job to rotate logs inside /var/log/* was running perhaps leading to a hit of the I/O read error (bad blocks).


Also inspected the Administrator user root cron job for any unwated scripts and stopped two report bash scripts that were part of the PCI tightened Security procedures.
Therein found script responsible to periodically report the list of installed packages and if they have not changed, as well a script to periodically report via email the list of
/etc/{passwd,/etc/shadow} created users, used to historically keep an eye on the list of users and easily see if someone
has created new users on the machine. Those were enabled via /var/spool/cron/root cron jobs, in other cases, on other machines if it happens for you
it is a good idea to check out all the existing user cron jobs and stop anything that might be putting Read / Write extra heat pressure on machine attached the Hard drives.

# ls -al /var/spool/cron/
total 20
drwx——  2 root root 4096 Nov 13  2015 .
drwxr-xr-x 12 root root 4096 May 11  2011 ..
-rw——-  1 root root  133 Nov 13  2015 root


3. Clear up old log files and any files unnecessery

Under /var/log and /home /var/tmp /var/spool/tmp immediately try to clear up the old log files.
From my past experience this has many times made the FS file inodes that are storing on a unbroken part (good blocks) of the hard drive and
ready to be reused by newly written rsyslog / syslogd services spitted files.

!!! Note that during the removal of some files you might hit a files stored on a bad blocks that might lead to a unexpected system reboot.

But that's okay, don't worry most likely after a hard reset by a technician in the Datacenter the machine will boot again and you can enjoy
removing remaining still files to send them to the heaven for old files.


4. Trigger an automatic system file system check with fsck on next boot

The standard way to force a Linux to aumatically recheck its Root filesystem is to simply create the /forcefsck to root partition or any other secondary disk partition you would like to check.

# touch /forcefsck

# reboot


However at some occasions you might be unable to do it because, the / (root fs) has been remounted in ReadOnly mode, yackes …

Luckily old Linux distibutions like this RHEL 5.1, has a way to force a filesystem check after reboot fsck and identify any
unknown bad-blocks and hopefully succceed in isolating them, so you don't hit into the same auto-reboots if the hard drive or Software / Hardware RAID
is not in terrible state
, you can use an option built in in /sbin/shutdown command the '-F'

   -F     Force fsck on reboot.


Hence to make the machine reboot and trigger immediately fsck:

# shutdown -rF now


Just In case you wonder why to reboot before check the Filesystem. Well simply because you need to have them unmounted before you check.

In that specific case this produced so far a good result and the machine booted just fine and we crossed the fingers and prayed that the machine would work flawlessly in the coming few weeks, before we finalize the configuration of the substitute machines, where this old infrastructure will be migrated to a new built cluster with new Haproxy and Corosync / Pacemaker Cluster on a brand new RHEL.

NB! On newer machines this won't work however as shutdown command has been stripped off this option because no SystemV (SystemInit) or Upstart and not on SystemD newer services architecture.
 

5. Hints on checking the hard drives with fsck

If you happen to be able to have physical access to the remote Hardare machine via a TTY[1-9] Console, that's even better and is the standard way to do it but with this specific case we had no easy way to get access to the Physical server console.

It is even better to go there and via either via connected Monitor (Display) or KVM Switch (Those who hear KVM switch first time this is a great device in server rooms to connect multiple monitors to same Monitor Display), it is better to use a some of the multitude of options to choose from for USB Distro Linux recovery OS versions or a CDROM / DVD on older machines like this with the Redhat's recovery mode rolled on.
After mounting the partition simply check each of the disks
e.g. :

# fsck -y /dev/sdb
# fsck -y /dev/sdc

Or if you want to not waste time and look for each hard drive but directly check all the ones that are attached and known by Linux distro via /etc/fstab definition run:

# fsck -AR

If necessery and you have a mixture of filesystems for example EXT3 , EXT4 , REISERFS you can tell it to omit some filesystem, for example ext3, like that:

# fsck -AR -t noext3 -y


To skip fsck on mounted partitions with fsck:

# fsck -M /dev/sdb


One remark to make here on fsck is usually fsck to complete its job on various filesystem it uses other external component binaries usually stored in /sbin/fsck*

ls -al /sbin/fsck*
-rwxr-xr-x 1 root root  55576 20 яну 2022 /sbin/fsck*
-rwxr-xr-x 1 root root  43272 20 яну 2022 /sbin/fsck.cramfs*
lrwxrwxrwx 1 root root      9  4 юли 2020 /sbin/fsck.exfat -> exfatfsck*
lrwxrwxrwx 1 root root      6  7 юни 2021 /sbin/fsck.ext2 -> e2fsck*
lrwxrwxrwx 1 root root      6  7 юни 2021 /sbin/fsck.ext3 -> e2fsck*
lrwxrwxrwx 1 root root      6  7 юни 2021 /sbin/fsck.ext4 -> e2fsck*
-rwxr-xr-x 1 root root  84208  8 фев 2021 /sbin/fsck.fat*
-rwxr-xr-x 2 root root 393040 30 ное 2009 /sbin/fsck.jfs*
-rwxr-xr-x 1 root root 125184 20 яну 2022 /sbin/fsck.minix*
lrwxrwxrwx 1 root root      8  8 фев 2021 /sbin/fsck.msdos -> fsck.fat*
-rwxr-xr-x 1 root root    333 16 дек 2021 /sbin/fsck.nfs*
lrwxrwxrwx 1 root root      8  8 фев 2021 /sbin/fsck.vfat -> fsck.fat*


6. Using tune2fs to  adjust tunable filesystem parameters on ext2/ext3/ext4 filesystems (few examples)

a) To check whether really the filesystem was checked on boot time or check a random filesystem on the server for its last check up date with fsck:

#  tune2fs -l /dev/sda1 | grep checked
Last checked:             Wed Apr 17 11:04:44 2019

On some distributions like old Debian and Ubuntu, it is even possible to enable fsck to log its operations during check on reboot via changing the verbosity from NO to YES:

# sed -i "s/#VERBOSE=no/VERBOSE=yes/" /etc/default/rcS


If you're having the issues on old Debian Linuxes  and not on RHEL  it is possible to;

b) Enable all fsck repairs automatic on boot

by running via:
 

# sed -i "s/FSCKFIX=no/FSCKFIX=yes/" /etc/default/rcS


c) Forcing fcsk check on for server attached Hard Drive Partitions with tune2fs

# tune2fs -c 1 /dev/sdXY

Note that:
tune2fs can force a fsck on each reboot for EXT4, EXT3 and EXT2 filesystems only.

tune2fs can trigger a forced fsck on every reboot using the -c (max-mount-counts) option.
This option sets the number of mounts after which the filesystem will be checked, so setting it to 1 will run fsck each time the computer boots.
Setting it to -1 or 0 resets this (the number of times the filesystem is mounted will be disregarded by e2fsck and the kernel).


 For example you could:

d) Set fsck to run a filesystem check every 30 boots, by using -c 30 
 

# tune2fs -c 30 /dev/sdXY


e) Checking whether a Hard Drive has been really checked on the boot


#  tune2fs -l /dev/sda1 | grep checked
Last checked:             Wed Apr 17 11:04:44 2019


e) Check when was the last time the file system /dev/sdX was checked:
 

# tune2fs -l /dev/sdX | grep Last\ c
Last checked:             Thu Jan 12 20:28:34 2017


f) Check how many times our /dev/sdX filesystem was mounted

# tune2fs -l /dev/sdX | grep Mount
Mount count:              157

g) Check how many mounts are allowed to pass before filesystem check is forced
 

# tune2fs -l /dev/sdX | grep Max
Maximum mount count:      -1


7. Repairing disk / partitions via GRUB fsck.mode and fsck.repair kernel module options

It is also possible to force a fsck.repair on boot via GRUB, but that usually is not an option someone would like as the machine might fail too boot if it hards to repair hardly, however in difficult situations with failing disks temporary enabling it is good idea.

This can be done by including for grub initial config

GRUB_CMDLINE_LINUX_DEFAULT="quiet splash fsck.mode=force fsck.repair=yes"

fsck.mode=force – will force a fsck each time a system boot and keeping that value enabled for a long time inside GRUB is stupid for servers as

sometimes booting could be severely prolonged because of the checks especially with servers with many or slow old hard drives.

fsck.repair=yes – will make the fsck try to repair if it finds bad blocks when checking (be absolutely sure you know, what you're doing if passing this options)

The options can be also set via editing the GRUB boot screen, if you have physical access to the server and don't want to reload the grub loader and possibly make the machine unbootable on next boot.
 

8. Few more details on how /etc/fstab disk fsck check parameters values for Systemd Linux machines works

The "proper" way on systemd (if we can talk about proper way on Linux) to runs fsck for each filesystem that has a fsck is to pass number greater than 0 set in
/etc/fstab (last column in /etc/fstab), so make sure you edit your /etc/fstab if that's not the case.

The root partition should be set to 1 (first to be checked), while other partitions you want to be checked should be set to 2.

Example /etc/fstab:
 

# /etc/fstab: static file system information.

/dev/sda1  /      ext4  errors=remount-ro  0  1
/dev/sda5  /home  ext4  defaults           0  2

The values you can put here as a second number meaning is as follows:
0 – disabled, that is do not check filesystem
1 – partition with this PASS value has a higher priority and is checked first. This value is usually set to the root / partition
2 – partitions with this PASS value will be checked last

a) Check the produced log out of fsck

Unfortunately on the older versions of Linux distros with SystemV fsck log output might be not generated except on the physical console so if you have a kind of duplicator device physical tty on the display port of the server, you might capture some bad block reports or fixed errors messages, but if you don't you might just cross the fingers and hope that anything found FS irregularities was recovered.

On systemd Linux machines the fsck log should be produced either in /run/initramfs/fsck.log or some other location depending on the Linux distro and you should be able to see something from fsck inside /var/log/* logs:

# grep -rli fsck /var/log/*


Close it up

Having a system with failing disk is a really one of the worst sysadmin nightmares to get. The good news is that most of the cases we're prepared with some working backup or some work around stuff like the few steps explained to mitigate the amount of Read / Writes to hard disks on the failing machine HDDs. If the failing disk is a primary Linux filesystem all becomes even worse as every next reboot, you have no guarantee, whether the kernel / initrd or some of the other system components required to run the Core Linux system won't break up the normal boot. Thus one side changes on the hard drives is a risky business on ther other side, if you're in a situation where you have a mirror system or the failing system is just a Linux server installed without a Cluster pair, then this is not a big deal as you can guarantee at least one of the nodes still up, unning and serving. Still doing too much of operations with HDD is always a danger so the steps described, though in most cases leading to improvement on how the system behaves, the system should be considered totally unreliable and closely monitored not only by some monitoring stuff like Zabbix / Prometheus whatever but regularly check the systems state via normal SSH logins. It is important if you have some important datas or logs on the system that are not synchronized to a system node to copy them before doing any of the described operations. After all minimal is backuped, proceed to clear up everything that might be cleared up and still the machine to continue providing most of its functionalities, trigger fsck automatic HDD check on next reboot, reboot, check what is going on and monitor the machine from there on.

Hopefully the few described steps, has helped some sysadmin. There is plenty of things which I've described that might go wrong, even following the described steps, might not help if the machines Storage Drives / SAS / SSD has too much of a damage. But as said in most cases following this few steps would improve the machine state.

Wish you the best of luck!


How to monitor Haproxy Application server backends with Zabbix userparameter autodiscovery scripts

Friday, May 13th, 2022

zabbix-backend-monitoring-logo

Haproxy is doing quite a good job in High Availability tasks where traffic towards multiple backend servers has to be redirected based on the available one to sent data from the proxy to. 

Lets say haproxy is configured to proxy traffic for App backend machine1 and App backend machine2.

Usually in companies people configure a monitoring like with Icinga or Zabbix / Grafana to keep track on the Application server is always up and running. Sometimes however due to network problems (like burned Network Switch / router or firewall misconfiguration) or even an IP duplicate it might happen that Application server seems to be reporting reachable from some monotoring tool on it but unreachable from  Haproxy server -> App backend machine2 but reachable from App backend machine1. And even though haproxy will automatically switch on the traffic from backend machine2 to App machine1. It is a good idea to monitor and be aware that one of the backends is offline from the Haproxy host.
In this article I'll show you how this is possible by using 2 shell scripts and userparameter keys config through the autodiscovery zabbix legacy feature.
Assumably for the setup to work you will need to have as a minimum a Zabbix server installation of version 5.0 or higher.

1. Create the required  haproxy_discovery.sh  and haproxy_stats.sh scripts 

You will have to install the two scripts under some location for example we can put it for more clearness under /etc/zabbix/scripts

[root@haproxy-server1 ]# mkdir /etc/zabbix/scripts

[root@haproxy-server1 scripts]# vim haproxy_discovery.sh 
#!/bin/bash
#
# Get list of Frontends and Backends from HAPROXY
# Example: ./haproxy_discovery.sh [/var/lib/haproxy/stats] FRONTEND|BACKEND|SERVERS
# First argument is optional and should be used to set location of your HAPROXY socket
# Second argument is should be either FRONTEND, BACKEND or SERVERS, will default to FRONTEND if not set
#
# !! Make sure the user running this script has Read/Write permissions to that socket !!
#
## haproxy.cfg snippet
#  global
#  stats socket /var/lib/haproxy/stats  mode 666 level admin

HAPROXY_SOCK=""/var/run/haproxy/haproxy.sock
[ -n “$1” ] && echo $1 | grep -q ^/ && HAPROXY_SOCK="$(echo $1 | tr -d '\040\011\012\015')"

if [[ “$1” =~ (25[0-5]|2[0-4][0-9]|[01]?[0-9][0-9]?)\.(25[0-5]|2[0-4][0-9]|[01]?[0-9][0-9]?)\.(25[0-5]|2[0-4][0-9]|[01]?[0-9][0-9]?)\.(25[0-5]|2[0-4][0-9]|[01]?[0-9][0-9]?):[0-9]{1,5} ]];
then
    HAPROXY_STATS_IP="$1"
    QUERYING_METHOD="TCP"
fi

QUERYING_METHOD="${QUERYING_METHOD:-SOCKET}"

query_stats() {
    if [[ ${QUERYING_METHOD} == “SOCKET” ]]; then
        echo "show stat" | socat ${HAPROXY_SOCK} stdio 2>/dev/null
    elif [[ ${QUERYING_METHOD} == “TCP” ]]; then
        echo "show stat" | nc ${HAPROXY_STATS_IP//:/ } 2>/dev/null
    fi
}

get_stats() {
        echo "$(query_stats)" | grep -v "^#"
}

[ -n “$2” ] && shift 1
case $1 in
        B*) END="BACKEND" ;;
        F*) END="FRONTEND" ;;
        S*)
                for backend in $(get_stats | grep BACKEND | cut -d, -f1 | uniq); do
                        for server in $(get_stats | grep "^${backend}," | grep -v BACKEND | grep -v FRONTEND | cut -d, -f2); do
                                serverlist="$serverlist,\n"'\t\t{\n\t\t\t"{#BACKEND_NAME}":"'$backend'",\n\t\t\t"{#SERVER_NAME}":"'$server'"}'
                        done
                done
                echo -e '{\n\t"data":[\n’${serverlist#,}’]}'
                exit 0
        ;;
        *) END="FRONTEND" ;;
esac

for frontend in $(get_stats | grep "$END" | cut -d, -f1 | uniq); do
    felist="$felist,\n"'\t\t{\n\t\t\t"{#'${END}'_NAME}":"'$frontend'"}'
done
echo -e '{\n\t"data":[\n’${felist#,}’]}'


[root@haproxy-server1 scripts]# vim haproxy_stats.sh 
#!/bin/bash
set -o pipefail

if [[ “$1” = /* ]]
then
  HAPROXY_SOCKET="$1"
  shift 0
else
  if [[ “$1” =~ (25[0-5]|2[0-4][0-9]|[01]?[0-9][0-9]?)\.(25[0-5]|2[0-4][0-9]|[01]?[0-9][0-9]?)\.(25[0-5]|2[0-4][0-9]|[01]?[0-9][0-9]?)\.(25[0-5]|2[0-4][0-9]|[01]?[0-9][0-9]?):[0-9]{1,5} ]];
  then
    HAPROXY_STATS_IP="$1"
    QUERYING_METHOD="TCP"
    shift 1
  fi
fi

pxname="$1"
svname="$2"
stat="$3"

DEBUG=${DEBUG:-0}
HAPROXY_SOCKET="${HAPROXY_SOCKET:-/var/run/haproxy/haproxy.sock}"
QUERYING_METHOD="${QUERYING_METHOD:-SOCKET}"
CACHE_STATS_FILEPATH="${CACHE_STATS_FILEPATH:-/var/tmp/haproxy_stats.cache}"
CACHE_STATS_EXPIRATION="${CACHE_STATS_EXPIRATION:-1}" # in minutes
CACHE_INFO_FILEPATH="${CACHE_INFO_FILEPATH:-/var/tmp/haproxy_info.cache}" ## unused
CACHE_INFO_EXPIRATION="${CACHE_INFO_EXPIRATION:-1}" # in minutes ## unused
GET_STATS=${GET_STATS:-1} # when you update stats cache outsise of the script
SOCAT_BIN="$(which socat)"
NC_BIN="$(which nc)"
FLOCK_BIN="$(which flock)"
FLOCK_WAIT=15 # maximum number of seconds that "flock" waits for acquiring a lock
FLOCK_SUFFIX='.lock'
CUR_TIMESTAMP="$(date '+%s')"

debug() {
  [ “${DEBUG}” -eq 1 ] && echo "DEBUG: $@" >&2 || true
}

debug "SOCAT_BIN        => $SOCAT_BIN"
debug "NC_BIN           => $NC_BIN"
debug "FLOCK_BIN        => $FLOCK_BIN"
debug "FLOCK_WAIT       => $FLOCK_WAIT seconds"
debug "CACHE_FILEPATH   => $CACHE_FILEPATH"
debug "CACHE_EXPIRATION => $CACHE_EXPIRATION minutes"
debug "HAPROXY_SOCKET   => $HAPROXY_SOCKET"
debug "pxname   => $pxname"
debug "svname   => $svname"
debug "stat     => $stat"

# check if socat is available in path
if [ “$GET_STATS” -eq 1 ] && [[ $QUERYING_METHOD == “SOCKET” && -z “$SOCAT_BIN” ]] || [[ $QUERYING_METHOD == “TCP” &&  -z “$NC_BIN” ]]
then
  echo 'ERROR: cannot find socat binary'
  exit 126
fi

# if we are getting stats:
#   check if we can write to stats cache file, if it exists
#     or cache file path, if it does not exist
#   check if HAPROXY socket is writable
# if we are NOT getting stats:
#   check if we can read the stats cache file
if [ “$GET_STATS” -eq 1 ]
then
  if [ -e “$CACHE_FILEPATH” ] && [ ! -w “$CACHE_FILEPATH” ]
  then
    echo 'ERROR: stats cache file exists, but is not writable'
    exit 126
  elif [ ! -w ${CACHE_FILEPATH%/*} ]
  then
    echo 'ERROR: stats cache file path is not writable'
    exit 126
  fi
  if [[ $QUERYING_METHOD == “SOCKET” && ! -w $HAPROXY_SOCKET ]]
  then
    echo "ERROR: haproxy socket is not writable"
    exit 126
  fi
elif [ ! -r “$CACHE_FILEPATH” ]
then
  echo 'ERROR: cannot read stats cache file'
  exit 126
fi

# index:name:default
MAP="
1:pxname:@
2:svname:@
3:qcur:9999999999
4:qmax:0
5:scur:9999999999
6:smax:0
7:slim:0
8:stot:@
9:bin:9999999999
10:bout:9999999999
11:dreq:9999999999
12:dresp:9999999999
13:ereq:9999999999
14:econ:9999999999
15:eresp:9999999999
16:wretr:9999999999
17:wredis:9999999999
18:status:UNK
19:weight:9999999999
20:act:9999999999
21:bck:9999999999
22:chkfail:9999999999
23:chkdown:9999999999
24:lastchg:9999999999
25:downtime:0
26:qlimit:0
27:pid:@
28:iid:@
29:sid:@
30:throttle:9999999999
31:lbtot:9999999999
32:tracked:9999999999
33:type:9999999999
34:rate:9999999999
35:rate_lim:@
36:rate_max:@
37:check_status:@
38:check_code:@
39:check_duration:9999999999
40:hrsp_1xx:@
41:hrsp_2xx:@
42:hrsp_3xx:@
43:hrsp_4xx:@
44:hrsp_5xx:@
45:hrsp_other:@
46:hanafail:@
47:req_rate:9999999999
48:req_rate_max:@
49:req_tot:9999999999
50:cli_abrt:9999999999
51:srv_abrt:9999999999
52:comp_in:0
53:comp_out:0
54:comp_byp:0
55:comp_rsp:0
56:lastsess:9999999999
57:last_chk:@
58:last_agt:@
59:qtime:0
60:ctime:0
61:rtime:0
62:ttime:0
"

_STAT=$(echo -e "$MAP" | grep :${stat}:)
_INDEX=${_STAT%%:*}
_DEFAULT=${_STAT##*:}

debug "_STAT    => $_STAT"
debug "_INDEX   => $_INDEX"
debug "_DEFAULT => $_DEFAULT"

# check if requested stat is supported
if [ -z “${_STAT}” ]
then
  echo "ERROR: $stat is unsupported"
  exit 127
fi

# method to retrieve data from haproxy stats
# usage:
# query_stats "show stat"
query_stats() {
    if [[ ${QUERYING_METHOD} == “SOCKET” ]]; then
        echo $1 | socat ${HAPROXY_SOCKET} stdio 2>/dev/null
    elif [[ ${QUERYING_METHOD} == “TCP” ]]; then
        echo $1 | nc ${HAPROXY_STATS_IP//:/ } 2>/dev/null
    fi
}

# a generic cache management function, that relies on 'flock'
check_cache() {
  local cache_type="${1}"
  local cache_filepath="${2}"
  local cache_expiration="${3}"  
  local cache_filemtime
  cache_filemtime=$(stat -c '%Y' "${cache_filepath}" 2> /dev/null)
  if [ $((cache_filemtime+60*cache_expiration)) -ge ${CUR_TIMESTAMP} ]
  then
    debug "${cache_type} file found, results are at most ${cache_expiration} minutes stale.."
  elif "${FLOCK_BIN}" –exclusive –wait "${FLOCK_WAIT}" 200
  then
    cache_filemtime=$(stat -c '%Y' "${cache_filepath}" 2> /dev/null)
    if [ $((cache_filemtime+60*cache_expiration)) -ge ${CUR_TIMESTAMP} ]
    then
      debug "${cache_type} file found, results have just been updated by another process.."
    else
      debug "no ${cache_type} file found, querying haproxy"
      query_stats "show ${cache_type}" > "${cache_filepath}"
    fi
  fi 200> "${cache_filepath}${FLOCK_SUFFIX}"
}

# generate stats cache file if needed
get_stats() {
  check_cache 'stat' "${CACHE_STATS_FILEPATH}" ${CACHE_STATS_EXPIRATION}
}

# generate info cache file
## unused at the moment
get_info() {
  check_cache 'info' "${CACHE_INFO_FILEPATH}" ${CACHE_INFO_EXPIRATION}
}

# get requested stat from cache file using INDEX offset defined in MAP
# return default value if stat is ""
get() {
  # $1: pxname/svname
  local _res="$("${FLOCK_BIN}" –shared –wait "${FLOCK_WAIT}" "${CACHE_STATS_FILEPATH}${FLOCK_SUFFIX}" grep $1 "${CACHE_STATS_FILEPATH}")"
  if [ -z “${_res}” ]
  then
    echo "ERROR: bad $pxname/$svname"
    exit 127
  fi
  _res="$(echo $_res | cut -d, -f ${_INDEX})"
  if [ -z “${_res}” ] && [[ “${_DEFAULT}” != “@” ]]
  then
    echo "${_DEFAULT}"  
  else
    echo "${_res}"
  fi
}

# not sure why we'd need to split on backslash
# left commented out as an example to override default get() method
# status() {
#   get "^${pxname},${svnamem}," $stat | cut -d\  -f1
# }

# this allows for overriding default method of getting stats
# name a function by stat name for additional processing, custom returns, etc.
if type get_${stat} >/dev/null 2>&1
then
  debug "found custom query function"
  get_stats && get_${stat}
else
  debug "using default get() method"
  get_stats && get "^${pxname},${svname}," ${stat}
fi


! NB ! Substitute in the script /var/run/haproxy/haproxy.sock with your haproxy socket location

You can download the haproxy_stats.sh here and haproxy_discovery.sh here

2. Create the userparameter_haproxy_backend.conf

[root@haproxy-server1 zabbix_agentd.d]# cat userparameter_haproxy_backend.conf 
#
# Discovery Rule
#

# HAProxy Frontend, Backend and Server Discovery rules
UserParameter=haproxy.list.discovery[*],sudo /etc/zabbix/scripts/haproxy_discovery.sh SERVER
UserParameter=haproxy.stats[*],sudo /etc/zabbix/scripts/haproxy_stats.sh  $2 $3 $4

# support legacy way

UserParameter=haproxy.stat.downtime[*],sudo /etc/zabbix/scripts/haproxy_stats.sh  $2 $3 downtime

UserParameter=haproxy.stat.status[*],sudo /etc/zabbix/scripts/haproxy_stats.sh  $2 $3 status

UserParameter=haproxy.stat.last_chk[*],sudo /etc/zabbix/scripts/haproxy_stats.sh  $2 $3 last_chk


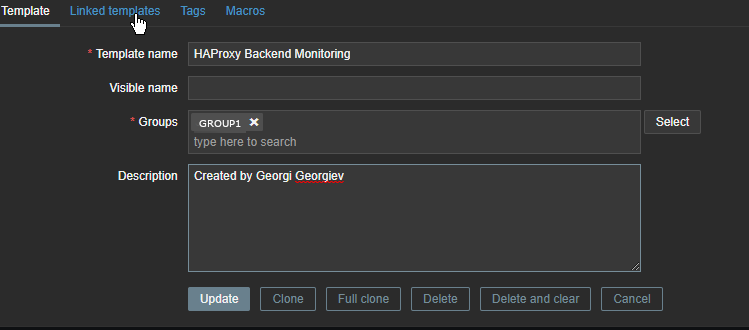
3. Create new simple template for the Application backend Monitoring and link it to monitored host

create-configuration-template-backend-monitoring

create-template-backend-monitoring-macros


Go to Configuration -> Hosts (find the host) and Link the template to it


4. Restart Zabbix-agent, in while check autodiscovery data is in Zabbix Server

[root@haproxy-server1 ]# systemctl restart zabbix-agent


Check in zabbix the userparameter data arrives, it should not be required to add any Items or Triggers as autodiscovery zabbix feature should automatically create in the server what is required for the data regarding backends to be in.

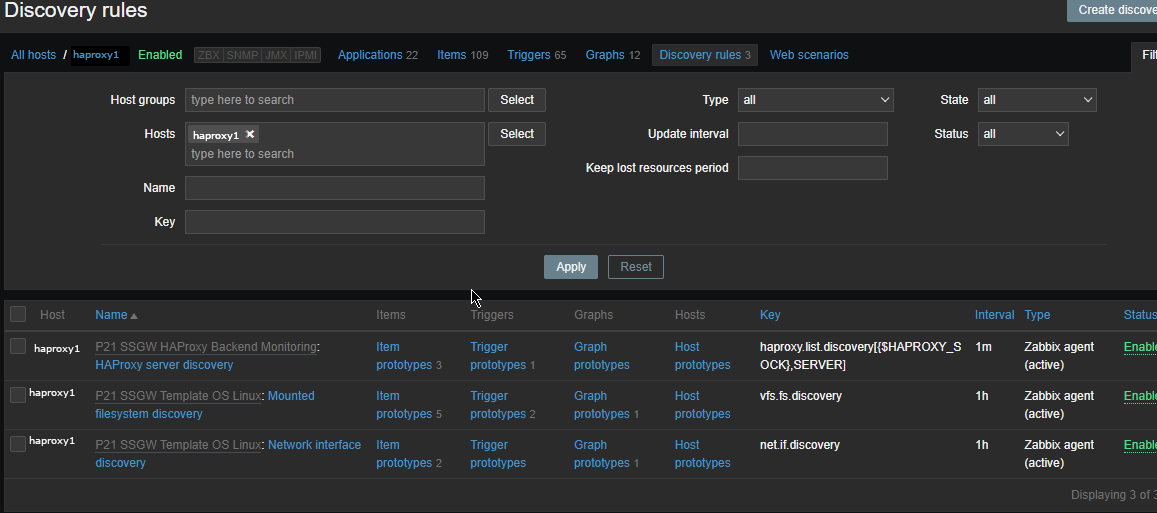
To view data arrives go to Zabbix config menus:

Configuration -> Hosts -> Hosts: (lookup for the haproxy-server1 hostname)

zabbix-discovery_rules-screenshot

The autodiscovery should have automatically created the following prototypes

zabbix-items-monitoring-prototypes
Now if you look inside Latest Data for the Host you should find some information like:

HAProxy Backend [backend1] (3 Items)
        
HAProxy Server [backend-name_APP/server1]: Connection Response
2022-05-13 14:15:04            History
        
HAProxy Server [backend-name/server2]: Downtime (hh:mm:ss)
2022-05-13 14:13:57    20:30:42        History
        
HAProxy Server [bk_name-APP/server1]: Status
2022-05-13 14:14:25    Up (1)        Graph
        ccnrlb01    HAProxy Backend [bk_CCNR_QA_ZVT] (3 Items)
        
HAProxy Server [bk_name-APP3/server1]: Connection Response
2022-05-13 14:15:05            History
        
HAProxy Server [bk_name-APP3/server1]: Downtime (hh:mm:ss)
2022-05-13 14:14:00    20:55:20        History
        
HAProxy Server [bk_name-APP3/server2]: Status
2022-05-13 14:15:08    Up (1)

To make alerting in case if a backend is down which usually you would like only left thing is to configure an Action to deliver alerts to some email address.