For system administrators having a Network issue is among the Hell-ish stuff that can happen every now and then. That is especially true in Heterogenous / Hybrid and complicated Network topologies (with missing well crafted documentation), that were build without an initial overview "on the fly".
Such a networking connectivity or routing issues are faced by every novice, mid or even expert system administrators as the Company's Network IT environments are becoming more and more complicated day by day.
When the "Disaster" of being unable to connect two servers or at times home laptops / PCs to see each other even though on the Physical layer / Transport Layer (Hardware such as external Switches / Routers / Repeaters / Cabling etc.) is Present machines are connected and everything on the 1 Physical Layer from OSI layears is present happens, then it is time to Debug it with some software tools and methods.
To each operating system the tools and methods to test networking connection and routings is a bit different but generally speaking most concepts are pretty much the same across different types of operating systems (Linux ditros / OpenBSD / FreeBSD / Mac OS / Android / iOS / HP-UX / IBM AIX / DOS / Windows etc.).
Debugging network issues across separate operating systems has its variations but in this specific (ideas) are much close to this article. As the goal at that guide will be to point out how to debug network issues on Linux, in future if I have the time or need to debug other OS-es from Linux, I'll try to put an article on how to debug Network issues on Windows when have some time to do it.
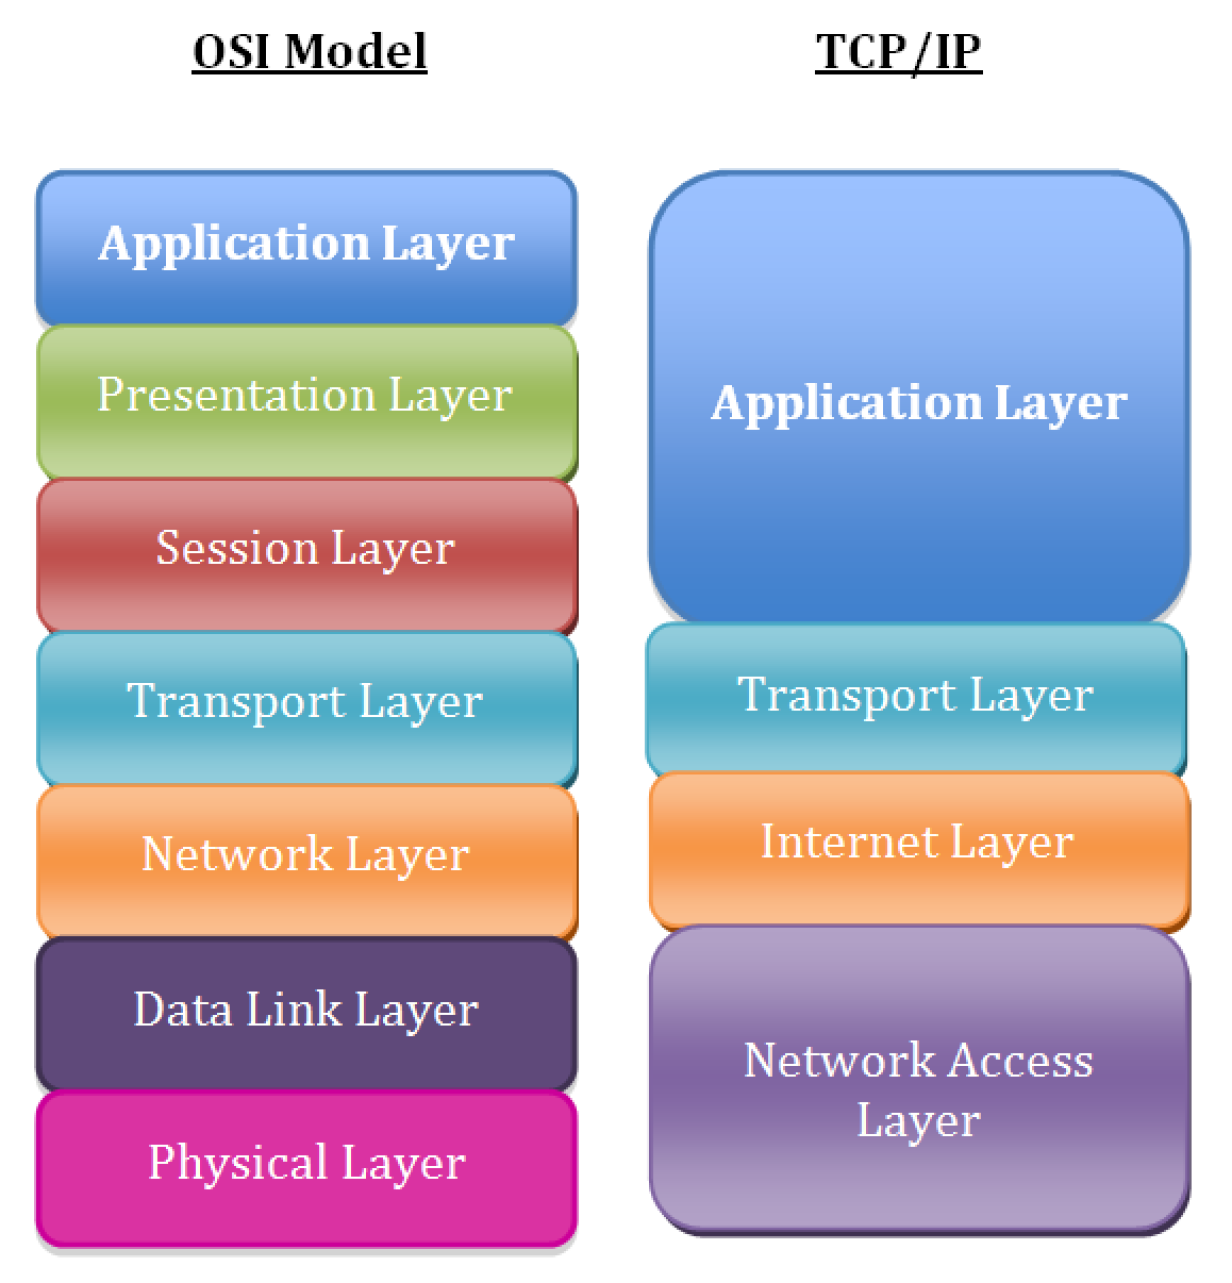
Consider to look for the issue following the basic TCP / IP OSI Level model, every system administrator should have idea about it already, it is part of most basic networking courses such as Cisco's CCNA
1. Check what is the Link status of the Interface with ethtool
root@freak:~# ethtool eno1
Settings for eno1:
Supported ports: [ TP ]
Supported link modes: 10baseT/Half 10baseT/Full
100baseT/Half 100baseT/Full
1000baseT/Full
Supported pause frame use: Symmetric
Supports auto-negotiation: Yes
Supported FEC modes: Not reported
Advertised link modes: 10baseT/Half 10baseT/Full
100baseT/Half 100baseT/Full
1000baseT/Full
Advertised pause frame use: Symmetric
Advertised auto-negotiation: Yes
Advertised FEC modes: Not reported
Speed: 100Mb/s
Duplex: Full
Auto-negotiation: on
Port: Twisted Pair
PHYAD: 1
Transceiver: internal
MDI-X: on (auto)
Supports Wake-on: pumbg
Wake-on: g
Current message level: 0x00000007 (7)
drv probe link
Link detected: yes
root@freak:~# ethtool eno2
Settings for eno2:
Supported ports: [ TP ]
Supported link modes: 10baseT/Half 10baseT/Full
100baseT/Half 100baseT/Full
1000baseT/Full
Supported pause frame use: Symmetric
Supports auto-negotiation: Yes
Supported FEC modes: Not reported
Advertised link modes: 10baseT/Half 10baseT/Full
100baseT/Half 100baseT/Full
1000baseT/Full
Advertised pause frame use: Symmetric
Advertised auto-negotiation: Yes
Advertised FEC modes: Not reported
Speed: 1000Mb/s
Duplex: Full
Auto-negotiation: on
Port: Twisted Pair
PHYAD: 1
Transceiver: internal
MDI-X: on (auto)
Supports Wake-on: pumbg
Wake-on: g
Current message level: 0x00000007 (7)
drv probe link
Link detected: yes
For example lets check only if Cable of Network card is plugged in and detected to have a network connection to remote node or switch and show the connection speed on which the 'autoneg on' (autonegiation option) of the LAN card has detected the network exat maximum speed:
root@pcfreak:~# ethtool eth0|grep -i 'link detected'; ethtool eth0 |grep 'Speed: '
Link detected: yes
Speed: 100Mb/s
1. Check ip command network configuration output
root@freak:~# ip addr show
1: lo: <LOOPBACK,UP,LOWER_UP> mtu 65536 qdisc noqueue state UNKNOWN group default qlen 1000
link/loopback 00:00:00:00:00:00 brd 00:00:00:00:00:00
inet 127.0.0.1/8 scope host lo
valid_lft forever preferred_lft forever
2: eno1: <BROADCAST,MULTICAST,UP,LOWER_UP> mtu 1500 qdisc mq master xenbr0 state UP group default qlen 1000
link/ether 70:e2:84:13:44:15 brd ff:ff:ff:ff:ff:ff
altname enp7s0
3: eno2: <BROADCAST,MULTICAST,UP,LOWER_UP> mtu 1500 qdisc mq master xenbr1 state UP group default qlen 1000
link/ether 70:e2:84:13:44:17 brd ff:ff:ff:ff:ff:ff
altname enp8s0
4: xenbr0: <BROADCAST,MULTICAST,UP,LOWER_UP> mtu 1500 qdisc noqueue state UP group default qlen 1000
link/ether 70:e2:84:13:44:13 brd ff:ff:ff:ff:ff:ff
inet 192.168.1.7/24 brd 192.168.1.255 scope global dynamic xenbr0
valid_lft 7361188sec preferred_lft 7361188sec
5: xenbr1: <BROADCAST,MULTICAST,UP,LOWER_UP> mtu 1500 qdisc noqueue state UP group default qlen 1000
link/ether 70:e2:84:13:44:15 brd ff:ff:ff:ff:ff:ff
inet 192.168.0.5/24 brd 192.168.0.255 scope global dynamic xenbr1
valid_lft 536138sec preferred_lft 536138sec
10: vif2.0: <BROADCAST,MULTICAST,UP,LOWER_UP> mtu 1500 qdisc mq master xenbr0 state UP group default qlen 2000
link/ether fe:ff:ff:ff:ff:ff brd ff:ff:ff:ff:ff:ff
11: vif2.1: <BROADCAST,MULTICAST,UP,LOWER_UP> mtu 1500 qdisc mq master xenbr1 state UP group default qlen 2000
link/ether fe:ff:ff:ff:ff:ff brd ff:ff:ff:ff:ff:ff
12: vif3.0: <BROADCAST,MULTICAST,UP,LOWER_UP> mtu 1500 qdisc mq master xenbr0 state UP group default qlen 2000
link/ether fe:ff:ff:ff:ff:ff brd ff:ff:ff:ff:ff:ff
13: vif3.1: <BROADCAST,MULTICAST,UP,LOWER_UP> mtu 1500 qdisc mq master xenbr1 state UP group default qlen 2000
link/ether fe:ff:ff:ff:ff:ff brd ff:ff:ff:ff:ff:ff
14: vif4.0: <BROADCAST,MULTICAST,UP,LOWER_UP> mtu 1500 qdisc mq master xenbr0 state UP group default qlen 2000
link/ether fe:ff:ff:ff:ff:ff brd ff:ff:ff:ff:ff:ff
15: vif4.1: <BROADCAST,MULTICAST,UP,LOWER_UP> mtu 1500 qdisc mq master xenbr1 state UP group default qlen 2000
link/ether fe:ff:ff:ff:ff:ff brd ff:ff:ff:ff:ff:ff
16: vif5.0: <BROADCAST,MULTICAST,UP,LOWER_UP> mtu 1500 qdisc mq master xenbr0 state UP group default qlen 2000
link/ether fe:ff:ff:ff:ff:ff brd ff:ff:ff:ff:ff:ff
17: vif5.1: <BROADCAST,MULTICAST,UP,LOWER_UP> mtu 1500 qdisc mq master xenbr1 state UP group default qlen 2000
link/ether fe:ff:ff:ff:ff:ff brd ff:ff:ff:ff:ff:ff
18: vif6.0: <BROADCAST,MULTICAST,UP,LOWER_UP> mtu 1500 qdisc mq master xenbr0 state UP group default qlen 2000
link/ether fe:ff:ff:ff:ff:ff brd ff:ff:ff:ff:ff:ff
19: vif6.1: <BROADCAST,MULTICAST,UP,LOWER_UP> mtu 1500 qdisc mq master xenbr0 state UP group default qlen 2000
link/ether fe:ff:ff:ff:ff:ff brd ff:ff:ff:ff:ff:ff
30: vif17.0: <BROADCAST,MULTICAST,UP,LOWER_UP> mtu 1500 qdisc mq master xenbr0 state UP group default qlen 2000
link/ether fe:ff:ff:ff:ff:ff brd ff:ff:ff:ff:ff:ff
31: vif17.1: <BROADCAST,MULTICAST,UP,LOWER_UP> mtu 1500 qdisc mq master xenbr1 state UP group default qlen 2000
link/ether fe:ff:ff:ff:ff:ff brd ff:ff:ff:ff:ff:ff
34: vif21.0: <BROADCAST,MULTICAST,UP,LOWER_UP> mtu 1500 qdisc mq master xenbr0 state UP group default qlen 2000
link/ether fe:ff:ff:ff:ff:ff brd ff:ff:ff:ff:ff:ff
35: vif21.1: <BROADCAST,MULTICAST,UP,LOWER_UP> mtu 1500 qdisc mq master xenbr1 state UP group default qlen 2000
link/ether fe:ff:ff:ff:ff:ff brd ff:ff:ff:ff:ff:ff
48: vif25.0-emu: <BROADCAST,MULTICAST,UP,LOWER_UP> mtu 1500 qdisc pfifo_fast master xenbr0 state UNKNOWN group default qlen 1000
link/ether fe:ff:ff:ff:ff:ff brd ff:ff:ff:ff:ff:ff
49: vif25.1-emu: <BROADCAST,MULTICAST,UP,LOWER_UP> mtu 1500 qdisc pfifo_fast master xenbr1 state UNKNOWN group default qlen 1000
link/ether fe:ff:ff:ff:ff:ff brd ff:ff:ff:ff:ff:ff
50: vif25.0: <NO-CARRIER,BROADCAST,MULTICAST,UP> mtu 1500 qdisc mq master xenbr0 state DOWN group default qlen 2000
link/ether fe:ff:ff:ff:ff:ff brd ff:ff:ff:ff:ff:ff
51: vif25.1: <NO-CARRIER,BROADCAST,MULTICAST,UP> mtu 1500 qdisc mq master xenbr1 state DOWN group default qlen 2000
link/ether fe:ff:ff:ff:ff:ff brd ff:ff:ff:ff:ff:ff
118: vif47.0-emu: <BROADCAST,MULTICAST,UP,LOWER_UP> mtu 1500 qdisc pfifo_fast master xenbr0 state UNKNOWN group default qlen 1000
link/ether fe:ff:ff:ff:ff:ff brd ff:ff:ff:ff:ff:ff
119: vif47.1-emu: <BROADCAST,MULTICAST,UP,LOWER_UP> mtu 1500 qdisc pfifo_fast master xenbr1 state UNKNOWN group default qlen 1000
link/ether fe:ff:ff:ff:ff:ff brd ff:ff:ff:ff:ff:ff
120: vif47.0: <NO-CARRIER,BROADCAST,MULTICAST,UP> mtu 1500 qdisc mq master xenbr0 state DOWN group default qlen 2000
link/ether fe:ff:ff:ff:ff:ff brd ff:ff:ff:ff:ff:ff
121: vif47.1: <NO-CARRIER,BROADCAST,MULTICAST,UP> mtu 1500 qdisc mq master xenbr1 state DOWN group default qlen 2000
link/ether fe:ff:ff:ff:ff:ff brd ff:ff:ff:ff:ff:ff
root@freak:~#
ip a s (is a also a shortcut command alias) you can enjoy if you have to deal with ip command frequently.
2. Check the status of the interfaces
Old fashioned way is to just do:
/sbin/ifconfig
root@freak:~# ifconfig
eno1: flags=4163<UP,BROADCAST,RUNNING,MULTICAST> mtu 1500
ether 70:e2:84:13:44:15 txqueuelen 1000 (Ethernet)
RX packets 52366502 bytes 10622469320 (9.8 GiB)
RX errors 0 dropped 0 overruns 0 frame 0
TX packets 242622195 bytes 274688121244 (255.8 GiB)
TX errors 0 dropped 0 overruns 0 carrier 0 collisions 0
device memory 0xfb200000-fb27ffff
eno2: flags=4163<UP,BROADCAST,RUNNING,MULTICAST> mtu 1500
ether 70:e2:84:13:44:17 txqueuelen 1000 (Ethernet)
RX packets 220995454 bytes 269698276095 (251.1 GiB)
RX errors 0 dropped 7 overruns 0 frame 0
TX packets 192319925 bytes 166233773782 (154.8 GiB)
TX errors 0 dropped 0 overruns 0 carrier 0 collisions 0
device memory 0xfb100000-fb17ffff
lo: flags=73<UP,LOOPBACK,RUNNING> mtu 65536
inet 127.0.0.1 netmask 255.0.0.0
loop txqueuelen 1000 (Local Loopback)
RX packets 2553 bytes 147410 (143.9 KiB)
RX errors 0 dropped 0 overruns 0 frame 0
TX packets 2553 bytes 147410 (143.9 KiB)
TX errors 0 dropped 0 overruns 0 carrier 0 collisions 0
vif17.0: flags=4163<UP,BROADCAST,RUNNING,MULTICAST> mtu 1500
ether fe:ff:ff:ff:ff:ff txqueuelen 2000 (Ethernet)
RX packets 14517375 bytes 133226551792 (124.0 GiB)
RX errors 0 dropped 0 overruns 0 frame 0
TX packets 139688950 bytes 145111993017 (135.1 GiB)
TX errors 0 dropped 0 overruns 0 carrier 0 collisions 0
vif17.1: flags=4163<UP,BROADCAST,RUNNING,MULTICAST> mtu 1500
ether fe:ff:ff:ff:ff:ff txqueuelen 2000 (Ethernet)
RX packets 86113294 bytes 156944058681 (146.1 GiB)
RX errors 0 dropped 0 overruns 0 frame 0
TX packets 181513904 bytes 267892940821 (249.4 GiB)
TX errors 0 dropped 0 overruns 0 carrier 0 collisions 0
vif2.0: flags=4163<UP,BROADCAST,RUNNING,MULTICAST> mtu 1500
ether fe:ff:ff:ff:ff:ff txqueuelen 2000 (Ethernet)
RX packets 1521875 bytes 88282472 (84.1 MiB)
RX errors 0 dropped 0 overruns 0 frame 0
TX packets 152691174 bytes 278372314505 (259.2 GiB)
TX errors 0 dropped 3 overruns 0 carrier 0 collisions 0
vif2.1: flags=4163<UP,BROADCAST,RUNNING,MULTICAST> mtu 1500
ether fe:ff:ff:ff:ff:ff txqueuelen 2000 (Ethernet)
RX packets 454915 bytes 81069760 (77.3 MiB)
RX errors 0 dropped 0 overruns 0 frame 0
TX packets 266953989 bytes 425692364876 (396.4 GiB)
TX errors 0 dropped 26 overruns 0 carrier 0 collisions 0
vif21.0: flags=4163<UP,BROADCAST,RUNNING,MULTICAST> mtu 1500
ether fe:ff:ff:ff:ff:ff txqueuelen 2000 (Ethernet)
RX packets 20043711 bytes 1283926794 (1.1 GiB)
RX errors 0 dropped 0 overruns 0 frame 0
TX packets 141580485 bytes 277396881113 (258.3 GiB)
TX errors 0 dropped 3 overruns 0 carrier 0 collisions 0
vif21.1: flags=4163<UP,BROADCAST,RUNNING,MULTICAST> mtu 1500
ether fe:ff:ff:ff:ff:ff txqueuelen 2000 (Ethernet)
RX packets 73004 bytes 3802174 (3.6 MiB)
RX errors 0 dropped 0 overruns 0 frame 0
TX packets 267151006 bytes 425621892663 (396.3 GiB)
TX errors 0 dropped 14 overruns 0 carrier 0 collisions 0
vif25.0: flags=4099<UP,BROADCAST,MULTICAST> mtu 1500
ether fe:ff:ff:ff:ff:ff txqueuelen 2000 (Ethernet)
RX packets 0 bytes 0 (0.0 B)
RX errors 0 dropped 0 overruns 0 frame 0
TX packets 0 bytes 0 (0.0 B)
TX errors 0 dropped 0 overruns 0 carrier 0 collisions 0
vif25.1: flags=4099<UP,BROADCAST,MULTICAST> mtu 1500
ether fe:ff:ff:ff:ff:ff txqueuelen 2000 (Ethernet)
RX packets 0 bytes 0 (0.0 B)
RX errors 0 dropped 0 overruns 0 frame 0
TX packets 0 bytes 0 (0.0 B)
TX errors 0 dropped 0 overruns 0 carrier 0 collisions 0
vif25.0-emu: flags=4163<UP,BROADCAST,RUNNING,MULTICAST> mtu 1500
ether fe:ff:ff:ff:ff:ff txqueuelen 1000 (Ethernet)
RX packets 2736348 bytes 295661367 (281.9 MiB)
RX errors 0 dropped 0 overruns 0 frame 0
TX packets 260385509 bytes 265751226663 (247.5 GiB)
TX errors 0 dropped 200 overruns 0 carrier 0 collisions 0
vif25.1-emu: flags=4163<UP,BROADCAST,RUNNING,MULTICAST> mtu 1500
ether fe:ff:ff:ff:ff:ff txqueuelen 1000 (Ethernet)
RX packets 145387 bytes 36011655 (34.3 MiB)
RX errors 0 dropped 0 overruns 0 frame 0
TX packets 370314760 bytes 394725961081 (367.6 GiB)
TX errors 0 dropped 0 overruns 0 carrier 0 collisions 0
vif3.0: flags=4163<UP,BROADCAST,RUNNING,MULTICAST> mtu 1500
ether fe:ff:ff:ff:ff:ff txqueuelen 2000 (Ethernet)
RX packets 55382861 bytes 130042280927 (121.1 GiB)
RX errors 0 dropped 0 overruns 0 frame 0
TX packets 99040097 bytes 147929196318 (137.7 GiB)
TX errors 0 dropped 1 overruns 0 carrier 0 collisions 0
vif3.1: flags=4163<UP,BROADCAST,RUNNING,MULTICAST> mtu 1500
ether fe:ff:ff:ff:ff:ff txqueuelen 2000 (Ethernet)
RX packets 5132631 bytes 295493762 (281.8 MiB)
RX errors 0 dropped 0 overruns 0 frame 0
TX packets 262314199 bytes 425416945203 (396.2 GiB)
TX errors 0 dropped 16 overruns 0 carrier 0 collisions 0
vif4.0: flags=4163<UP,BROADCAST,RUNNING,MULTICAST> mtu 1500
ether fe:ff:ff:ff:ff:ff txqueuelen 2000 (Ethernet)
RX packets 4902015 bytes 615387539 (586.8 MiB)
RX errors 0 dropped 0 overruns 0 frame 0
TX packets 149342891 bytes 277802504143 (258.7 GiB)
TX errors 0 dropped 1 overruns 0 carrier 0 collisions 0
vif4.1: flags=4163<UP,BROADCAST,RUNNING,MULTICAST> mtu 1500
ether fe:ff:ff:ff:ff:ff txqueuelen 2000 (Ethernet)
RX packets 276927 bytes 30720101 (29.2 MiB)
RX errors 0 dropped 0 overruns 0 frame 0
TX packets 267132395 bytes 425745668273 (396.5 GiB)
TX errors 0 dropped 14 overruns 0 carrier 0 collisions 0
vif47.0: flags=4099<UP,BROADCAST,MULTICAST> mtu 1500
ether fe:ff:ff:ff:ff:ff txqueuelen 2000 (Ethernet)
RX packets 0 bytes 0 (0.0 B)
RX errors 0 dropped 0 overruns 0 frame 0
TX packets 0 bytes 0 (0.0 B)
TX errors 0 dropped 0 overruns 0 carrier 0 collisions 0
vif47.1: flags=4099<UP,BROADCAST,MULTICAST> mtu 1500
ether fe:ff:ff:ff:ff:ff txqueuelen 2000 (Ethernet)
RX packets 0 bytes 0 (0.0 B)
RX errors 0 dropped 0 overruns 0 frame 0
TX packets 0 bytes 0 (0.0 B)
TX errors 0 dropped 0 overruns 0 carrier 0 collisions 0
vif47.0-emu: flags=4163<UP,BROADCAST,RUNNING,MULTICAST> mtu 1500
ether fe:ff:ff:ff:ff:ff txqueuelen 1000 (Ethernet)
RX packets 208745 bytes 20096596 (19.1 MiB)
RX errors 0 dropped 0 overruns 0 frame 0
TX packets 110905731 bytes 110723486135 (103.1 GiB)
TX errors 0 dropped 0 overruns 0 carrier 0 collisions 0
vif47.1-emu: flags=4163<UP,BROADCAST,RUNNING,MULTICAST> mtu 1500
ether fe:ff:ff:ff:ff:ff txqueuelen 1000 (Ethernet)
RX packets 140517 bytes 14596061 (13.9 MiB)
RX errors 0 dropped 0 overruns 0 frame 0
TX packets 150831959 bytes 162931572456 (151.7 GiB)
TX errors 0 dropped 0 overruns 0 carrier 0 collisions 0
vif5.0: flags=4163<UP,BROADCAST,RUNNING,MULTICAST> mtu 1500
ether fe:ff:ff:ff:ff:ff txqueuelen 2000 (Ethernet)
RX packets 2030528 bytes 363988589 (347.1 MiB)
RX errors 0 dropped 0 overruns 0 frame 0
TX packets 152264264 bytes 278131541781 (259.0 GiB)
TX errors 0 dropped 1 overruns 0 carrier 0 collisions 0
vif5.1: flags=4163<UP,BROADCAST,RUNNING,MULTICAST> mtu 1500
ether fe:ff:ff:ff:ff:ff txqueuelen 2000 (Ethernet)
RX packets 4169244 bytes 1045889687 (997.4 MiB)
RX errors 0 dropped 0 overruns 0 frame 0
TX packets 263561100 bytes 424894400987 (395.7 GiB)
TX errors 0 dropped 7 overruns 0 carrier 0 collisions 0
vif6.0: flags=4163<UP,BROADCAST,RUNNING,MULTICAST> mtu 1500
ether fe:ff:ff:ff:ff:ff txqueuelen 2000 (Ethernet)
RX packets 300242 bytes 16210963 (15.4 MiB)
RX errors 0 dropped 0 overruns 0 frame 0
TX packets 153909576 bytes 278461295620 (259.3 GiB)
TX errors 0 dropped 2 overruns 0 carrier 0 collisions 0
vif6.1: flags=4163<UP,BROADCAST,RUNNING,MULTICAST> mtu 1500
ether fe:ff:ff:ff:ff:ff txqueuelen 2000 (Ethernet)
RX packets 43 bytes 1932 (1.8 KiB)
RX errors 0 dropped 0 overruns 0 frame 0
TX packets 154205631 bytes 278481298141 (259.3 GiB)
TX errors 0 dropped 2 overruns 0 carrier 0 collisions 0
xenbr0: flags=4163<UP,BROADCAST,RUNNING,MULTICAST> mtu 1500
inet 192.168.1.8 netmask 255.255.255.0 broadcast 192.168.1.255
ether 70:e2:84:13:44:11 txqueuelen 1000 (Ethernet)
RX packets 13689902 bytes 923464162 (880.6 MiB)
RX errors 0 dropped 0 overruns 0 frame 0
TX packets 12072932 bytes 1307055530 (1.2 GiB)
TX errors 0 dropped 0 overruns 0 carrier 0 collisions 0
xenbr1: flags=4163<UP,BROADCAST,RUNNING,MULTICAST> mtu 1500
inet 192.168.0.3 netmask 255.255.255.0 broadcast 192.168.0.255
ether 70:e2:84:13:44:12 txqueuelen 1000 (Ethernet)
RX packets 626995 bytes 180026901 (171.6 MiB)
RX errors 0 dropped 0 overruns 0 frame 0
TX packets 12815 bytes 942092 (920.0 KiB)
TX errors 0 dropped 0 overruns 0 carrier 0 collisions 0
root@freak:~# ifconfig
eno1: flags=4163<UP,BROADCAST,RUNNING,MULTICAST> mtu 1500
ether 70:e2:84:13:44:11 txqueuelen 1000 (Ethernet)
RX packets 52373358 bytes 10623034427 (9.8 GiB)
RX errors 0 dropped 0 overruns 0 frame 0
TX packets 242660000 bytes 274734018669 (255.8 GiB)
TX errors 0 dropped 0 overruns 0 carrier 0 collisions 0
device memory 0xfb200000-fb27ffff
eno2: flags=4163<UP,BROADCAST,RUNNING,MULTICAST> mtu 1500
ether 70:e2:84:13:44:12 txqueuelen 1000 (Ethernet)
RX packets 221197892 bytes 269978137472 (251.4 GiB)
RX errors 0 dropped 7 overruns 0 frame 0
TX packets 192573206 bytes 166491370299 (155.0 GiB)
TX errors 0 dropped 0 overruns 0 carrier 0 collisions 0
device memory 0xfb100000-fb17ffff
lo: flags=73<UP,LOOPBACK,RUNNING> mtu 65536
inet 127.0.0.1 netmask 255.0.0.0
loop txqueuelen 1000 (Local Loopback)
RX packets 2553 bytes 147410 (143.9 KiB)
RX errors 0 dropped 0 overruns 0 frame 0
TX packets 2553 bytes 147410 (143.9 KiB)
TX errors 0 dropped 0 overruns 0 carrier 0 collisions 0
vif17.0: flags=4163<UP,BROADCAST,RUNNING,MULTICAST> mtu 1500
ether fe:ff:ff:ff:ff:ff txqueuelen 2000 (Ethernet)
RX packets 14519247 bytes 133248290251 (124.0 GiB)
RX errors 0 dropped 0 overruns 0 frame 0
TX packets 139708738 bytes 145135168676 (135.1 GiB)
TX errors 0 dropped 0 overruns 0 carrier 0 collisions 0
vif17.1: flags=4163<UP,BROADCAST,RUNNING,MULTICAST> mtu 1500
ether fe:ff:ff:ff:ff:ff txqueuelen 2000 (Ethernet)
RX packets 86206104 bytes 157189755115 (146.3 GiB)
RX errors 0 dropped 0 overruns 0 frame 0
TX packets 181685983 bytes 268170806613 (249.7 GiB)
TX errors 0 dropped 0 overruns 0 carrier 0 collisions 0
vif2.0: flags=4163<UP,BROADCAST,RUNNING,MULTICAST> mtu 1500
ether fe:ff:ff:ff:ff:ff txqueuelen 2000 (Ethernet)
RX packets 1522072 bytes 88293701 (84.2 MiB)
RX errors 0 dropped 0 overruns 0 frame 0
TX packets 152712638 bytes 278417240910 (259.2 GiB)
TX errors 0 dropped 3 overruns 0 carrier 0 collisions 0
vif2.1: flags=4163<UP,BROADCAST,RUNNING,MULTICAST> mtu 1500
ether fe:ff:ff:ff:ff:ff txqueuelen 2000 (Ethernet)
RX packets 454933 bytes 81071616 (77.3 MiB)
RX errors 0 dropped 0 overruns 0 frame 0
TX packets 267218860 bytes 426217224334 (396.9 GiB)
TX errors 0 dropped 26 overruns 0 carrier 0 collisions 0
vif21.0: flags=4163<UP,BROADCAST,RUNNING,MULTICAST> mtu 1500
ether fe:ff:ff:ff:ff:ff txqueuelen 2000 (Ethernet)
RX packets 20045530 bytes 1284038375 (1.1 GiB)
RX errors 0 dropped 0 overruns 0 frame 0
TX packets 141601066 bytes 277441739746 (258.3 GiB)
TX errors 0 dropped 3 overruns 0 carrier 0 collisions 0
vif21.1: flags=4163<UP,BROADCAST,RUNNING,MULTICAST> mtu 1500
ether fe:ff:ff:ff:ff:ff txqueuelen 2000 (Ethernet)
RX packets 73010 bytes 3802474 (3.6 MiB)
RX errors 0 dropped 0 overruns 0 frame 0
TX packets 267415889 bytes 426146753845 (396.8 GiB)
TX errors 0 dropped 14 overruns 0 carrier 0 collisions 0
vif25.0: flags=4099<UP,BROADCAST,MULTICAST> mtu 1500
ether fe:ff:ff:ff:ff:ff txqueuelen 2000 (Ethernet)
RX packets 0 bytes 0 (0.0 B)
RX errors 0 dropped 0 overruns 0 frame 0
TX packets 0 bytes 0 (0.0 B)
TX errors 0 dropped 0 overruns 0 carrier 0 collisions 0
vif25.1: flags=4099<UP,BROADCAST,MULTICAST> mtu 1500
ether fe:ff:ff:ff:ff:ff txqueuelen 2000 (Ethernet)
RX packets 0 bytes 0 (0.0 B)
RX errors 0 dropped 0 overruns 0 frame 0
TX packets 0 bytes 0 (0.0 B)
TX errors 0 dropped 0 overruns 0 carrier 0 collisions 0
vif25.0-emu: flags=4163<UP,BROADCAST,RUNNING,MULTICAST> mtu 1500
ether fe:ff:ff:ff:ff:ff txqueuelen 1000 (Ethernet)
RX packets 2736576 bytes 295678097 (281.9 MiB)
RX errors 0 dropped 0 overruns 0 frame 0
TX packets 260429831 bytes 265797660906 (247.5 GiB)
TX errors 0 dropped 200 overruns 0 carrier 0 collisions 0
vif25.1-emu: flags=4163<UP,BROADCAST,RUNNING,MULTICAST> mtu 1500
ether fe:ff:ff:ff:ff:ff txqueuelen 1000 (Ethernet)
RX packets 145425 bytes 36018716 (34.3 MiB)
RX errors 0 dropped 0 overruns 0 frame 0
TX packets 370770440 bytes 395263409640 (368.1 GiB)
TX errors 0 dropped 0 overruns 0 carrier 0 collisions 0
vif3.0: flags=4163<UP,BROADCAST,RUNNING,MULTICAST> mtu 1500
ether fe:ff:ff:ff:ff:ff txqueuelen 2000 (Ethernet)
RX packets 55392503 bytes 130064444520 (121.1 GiB)
RX errors 0 dropped 0 overruns 0 frame 0
TX packets 99052116 bytes 147951838129 (137.7 GiB)
TX errors 0 dropped 1 overruns 0 carrier 0 collisions 0
vif3.1: flags=4163<UP,BROADCAST,RUNNING,MULTICAST> mtu 1500
ether fe:ff:ff:ff:ff:ff txqueuelen 2000 (Ethernet)
RX packets 5133054 bytes 295517366 (281.8 MiB)
RX errors 0 dropped 0 overruns 0 frame 0
TX packets 262578665 bytes 425941777243 (396.6 GiB)
TX errors 0 dropped 16 overruns 0 carrier 0 collisions 0
vif4.0: flags=4163<UP,BROADCAST,RUNNING,MULTICAST> mtu 1500
ether fe:ff:ff:ff:ff:ff txqueuelen 2000 (Ethernet)
RX packets 4902949 bytes 615496460 (586.9 MiB)
RX errors 0 dropped 0 overruns 0 frame 0
TX packets 149363618 bytes 277847322538 (258.7 GiB)
TX errors 0 dropped 1 overruns 0 carrier 0 collisions 0
vif4.1: flags=4163<UP,BROADCAST,RUNNING,MULTICAST> mtu 1500
ether fe:ff:ff:ff:ff:ff txqueuelen 2000 (Ethernet)
RX packets 276943 bytes 30721141 (29.2 MiB)
RX errors 0 dropped 0 overruns 0 frame 0
TX packets 267397268 bytes 426270528575 (396.9 GiB)
TX errors 0 dropped 14 overruns 0 carrier 0 collisions 0
vif47.0: flags=4099<UP,BROADCAST,MULTICAST> mtu 1500
ether fe:ff:ff:ff:ff:ff txqueuelen 2000 (Ethernet)
RX packets 0 bytes 0 (0.0 B)
RX errors 0 dropped 0 overruns 0 frame 0
TX packets 0 bytes 0 (0.0 B)
TX errors 0 dropped 0 overruns 0 carrier 0 collisions 0
vif47.1: flags=4099<UP,BROADCAST,MULTICAST> mtu 1500
ether fe:ff:ff:ff:ff:ff txqueuelen 2000 (Ethernet)
RX packets 0 bytes 0 (0.0 B)
RX errors 0 dropped 0 overruns 0 frame 0
TX packets 0 bytes 0 (0.0 B)
TX errors 0 dropped 0 overruns 0 carrier 0 collisions 0
vif47.0-emu: flags=4163<UP,BROADCAST,RUNNING,MULTICAST> mtu 1500
ether fe:ff:ff:ff:ff:ff txqueuelen 1000 (Ethernet)
RX packets 208790 bytes 20100733 (19.1 MiB)
RX errors 0 dropped 0 overruns 0 frame 0
TX packets 110950236 bytes 110769932971 (103.1 GiB)
TX errors 0 dropped 0 overruns 0 carrier 0 collisions 0
vif47.1-emu: flags=4163<UP,BROADCAST,RUNNING,MULTICAST> mtu 1500
ether fe:ff:ff:ff:ff:ff txqueuelen 1000 (Ethernet)
RX packets 140551 bytes 14599509 (13.9 MiB)
RX errors 0 dropped 0 overruns 0 frame 0
TX packets 151287643 bytes 163469024604 (152.2 GiB)
TX errors 0 dropped 0 overruns 0 carrier 0 collisions 0
vif5.0: flags=4163<UP,BROADCAST,RUNNING,MULTICAST> mtu 1500
ether fe:ff:ff:ff:ff:ff txqueuelen 2000 (Ethernet)
RX packets 2030676 bytes 363997181 (347.1 MiB)
RX errors 0 dropped 0 overruns 0 frame 0
TX packets 152285777 bytes 278176471509 (259.0 GiB)
TX errors 0 dropped 1 overruns 0 carrier 0 collisions 0
vif5.1: flags=4163<UP,BROADCAST,RUNNING,MULTICAST> mtu 1500
ether fe:ff:ff:ff:ff:ff txqueuelen 2000 (Ethernet)
RX packets 4169387 bytes 1045898303 (997.4 MiB)
RX errors 0 dropped 0 overruns 0 frame 0
TX packets 263825846 bytes 425419251935 (396.2 GiB)
TX errors 0 dropped 7 overruns 0 carrier 0 collisions 0
vif6.0: flags=4163<UP,BROADCAST,RUNNING,MULTICAST> mtu 1500
ether fe:ff:ff:ff:ff:ff txqueuelen 2000 (Ethernet)
RX packets 300266 bytes 16212271 (15.4 MiB)
RX errors 0 dropped 0 overruns 0 frame 0
TX packets 153931212 bytes 278506234302 (259.3 GiB)
TX errors 0 dropped 2 overruns 0 carrier 0 collisions 0
vif6.1: flags=4163<UP,BROADCAST,RUNNING,MULTICAST> mtu 1500
ether fe:ff:ff:ff:ff:ff txqueuelen 2000 (Ethernet)
RX packets 43 bytes 1932 (1.8 KiB)
RX errors 0 dropped 0 overruns 0 frame 0
TX packets 154227291 bytes 278526238467 (259.3 GiB)
TX errors 0 dropped 2 overruns 0 carrier 0 collisions 0
xenbr0: flags=4163<UP,BROADCAST,RUNNING,MULTICAST> mtu 1500
inet 192.168.1.8 netmask 255.255.255.0 broadcast 192.168.1.255
ether 70:e2:84:13:44:11 txqueuelen 1000 (Ethernet)
RX packets 13690768 bytes 923520126 (880.7 MiB)
RX errors 0 dropped 0 overruns 0 frame 0
TX packets 12073667 bytes 1307127765 (1.2 GiB)
TX errors 0 dropped 0 overruns 0 carrier 0 collisions 0
xenbr1: flags=4163<UP,BROADCAST,RUNNING,MULTICAST> mtu 1500
inet 192.168.0.3 netmask 255.255.255.0 broadcast 192.168.0.255
ether 70:e2:84:13:44:12 txqueuelen 1000 (Ethernet)
RX packets 627010 bytes 180028847 (171.6 MiB)
RX errors 0 dropped 0 overruns 0 frame 0
TX packets 12815 bytes 942092 (920.0 KiB)
TX errors 0 dropped 0 overruns 0 carrier 0 collisions 0
To see ethernet interfaces that seem up and then do a ifconfig -a to check whether some interfaces are down (e.g. not shown in the simple ifconfig list).
/sbin/ifconfig -a
! Please note that some virtual IP configurations might not appear and noly be visible in an (ip addr show) command.
3. Check iproute2 for special rt_tables (Routing Tables) rules
By default Linux distributions does not have any additional rules in /etc/iproute2/rt_tables however some Linux router machines, needs to have a multiple Gateways. Perhaps the most elegant way to do multiple routings with Linux is to use iproute2's routing tables rt_tables.
Here is example of an OpenXEN system that has 2 Internet providers attached and routes different traffic via
root@freak:~# cat /etc/iproute2/rt_tables
#
# reserved values
#
255 local
254 main
253 default
100 INET1
200 INET2
0 unspec
#
# local
#
#1 inr.ruhep
root@freak:~# ip rule list
0: from all lookup local
32762: from all to 192.168.1.8 lookup INET2
32763: from 192.168.1.8 lookup INET2
32764: from all to 192.168.0.3 lookup INET1
32765: from 192.168.0.3 lookup INET1
32766: from all lookup main
32767: from all lookup default
root@freak:~#
4. Using ip route get to find out traffic route (path)
root@freak:~# ip route get 192.168.0.1
192.168.0.1 via 192.168.0.1 dev xenbr1 src 192.168.0.3 uid 0
cache
root@freak:~# /sbin/route -n
Kernel IP routing table
Destination Gateway Genmask Flags Metric Ref Use Iface
0.0.0.0 192.168.1.1 0.0.0.0 UG 0 0 0 xenbr0
192.168.0.0 192.168.0.1 255.255.255.0 UG 0 0 0 xenbr1
192.168.0.0 0.0.0.0 255.255.255.0 U 0 0 0 xenbr1
192.168.1.0 0.0.0.0 255.255.255.0 U 0 0 0 xenbr0
root@freak:~#
root@freak:~# ip route show
default via 192.168.1.1 dev xenbr0
192.168.0.0/24 via 192.168.0.1 dev xenbr1
192.168.0.0/24 dev xenbr1 proto kernel scope link src 192.168.0.3
192.168.1.0/24 dev xenbr0 proto kernel scope link src 192.168.1.8
If you find that gateway is missing you might want to add it with:
root@freak:~# ip route add default via 192.168.5.1
If you need to add a speicic network IP range via separate gateways, you can use commands like:
To add routing for 192.168.0.1/24 / 192.168.1.1/24 via 192.168.0.1 and 192.168.1.1
# /sbin/route add -net 192.168.1.0 netmask 255.255.255.0 gw 192.168.1.1 dev eth1
# /sbin/route add -net 192.168.0.0 netmask 255.255.255.0 gw 192.168.0.1 dev eth1
If you need to delete a configured wrong route with ip command
# ip route del 192.168.1.0/24 via 0.0.0.0 dev eth1
# ip route del 192.168.0.0/24 via 0.0.0.0 dev eth1
5. Use ping (ICMP protocol) the Destionation IP
root@freak:~# ping -c 3 192.168.0.1
PING 192.168.0.1 (192.168.0.1) 56(84) bytes of data.
64 bytes from 192.168.0.1: icmp_seq=1 ttl=64 time=0.219 ms
64 bytes from 192.168.0.1: icmp_seq=2 ttl=64 time=0.295 ms
64 bytes from 192.168.0.1: icmp_seq=3 ttl=64 time=0.270 ms
— 192.168.0.1 ping statistics —
3 packets transmitted, 3 received, 0% packet loss, time 2048ms
rtt min/avg/max/mdev = 0.219/0.261/0.295/0.031 ms
root@freak:~# ping -c 3 192.168.0.39
PING 192.168.0.39 (192.168.0.39) 56(84) bytes of data.
From 192.168.1.80: icmp_seq=2 Redirect Host(New nexthop: 192.168.0.39)
From 192.168.1.80: icmp_seq=3 Redirect Host(New nexthop: 192.168.0.39)
From 192.168.1.80 icmp_seq=1 Destination Host Unreachable
— 192.168.0.39 ping statistics —
3 packets transmitted, 0 received, +1 errors, 100% packet loss, time 2039ms
pipe 3
Note that sometimes you might get 100% traffic loss but still have connection to the destionation in case if the ICMP protocol is filtered for security.
However if you get something like Network is unreachable that is usually an indicator of some routing problem or wrongly configured network netmask.
root@freak:~# ping 192.168.0.5
ping: connect: Network is unreachable
Test network with different packet size. To send 8972 bytes of payload in a Ethernet frame without fragmentation, the following command can be used:
root@pcfreak:~# ping -s 8972 -M do -c 4 freak
PING xen (192.168.1.8) 8972(9000) bytes of data.
ping: local error: message too long, mtu=1500
ping: local error: message too long, mtu=1500
ping: local error: message too long, mtu=1500
^C
— xen ping statistics —
3 packets transmitted, 0 received, +3 errors, 100% packet loss, time 2037ms
root@pcfreak:~#
-M pmtudisc_opt
Select Path MTU Discovery strategy. pmtudisc_option may be either do (prohibit fragmentation, even local one), want (do PMTU discovery, fragment locally when packet size is
large), or dont (do not set DF flag).
root@pcfreak:~# ping -s 8972 -M want -c 4 freak
PING xen (192.168.1.8) 8972(9000) bytes of data.
8980 bytes from xen (192.168.1.5): icmp_seq=1 ttl=64 time=2.18 ms
8980 bytes from xen (192.168.1.5): icmp_seq=2 ttl=64 time=1.90 ms
8980 bytes from xen (192.168.1.5): icmp_seq=3 ttl=64 time=2.10 ms
^C
— xen ping statistics —
3 packets transmitted, 3 received, 0% packet loss, time 2002ms
rtt min/avg/max/mdev = 1.901/2.059/2.178/0.116 ms
root@pcfreak:~#
- -M do: prohibit fragmentation
- -s 8972 8972 bytes of data
- ICMP header: 8 bytes
- IP header: 20 bytes (usually, it can be higher)
- 8980 bytes of bytes is the IP payload
These commands can be used to capture for MTU (maximum transmition units) related issues between hosts that are preventing for hosts to properly send traffic between themselves.
A common issue for Linux hosts to be unable to see each other on the same network is caused by Jumbo Frames (MTU 9000) packets enabled on one of the sides and MTU of 1500 on the other side.
Thus it is always a good idea to thoroughully look up all configured MTUs for all LAN Devices on each server.
6. Check traceroute path to host
If there is no PING but ip route get shows routing is properly configured and the routes existing in the Linux machine routing tables, next step is to check the output of traceroute / tracepath / mtr
raceroute to 192.168.0.1 (192.168.0.1), 30 hops max, 60 byte packets
1 pcfreak (192.168.0.1) 0.263 ms 0.166 ms 0.119 ms
root@freak:~# tracepath 192.168.1.1
1?: [LOCALHOST] pmtu 1500
1: vivacom-gigabit-router 0.925ms reached
1: vivacom-gigabit-router 0.835ms reached
Resume: pmtu 1500 hops 1 back 1
It might be useful to get a frequent output of the command (especially on Linux hosts) where mtr command is not installed with:
root@freak:~# watch -n 0.1 traceroute 192.168.0.1
root@freak:~# traceroute -4 google.com
traceroute to google.com (172.217.17.110), 30 hops max, 60 byte packets
1 vivacom-gigabit-router (192.168.1.1) 0.657 ms 1.280 ms 1.647 ms
2 213.91.190.130 (213.91.190.130) 7.983 ms 8.168 ms 8.097 ms
3 * * *
4 * * *
5 212-39-66-222.ip.btc-net.bg (212.39.66.222) 16.613 ms 16.336 ms 17.151 ms
6 * * *
7 142.251.92.65 (142.251.92.65) 18.808 ms 13.246 ms 209.85.254.242 (209.85.254.242) 15.541 ms
8 142.251.92.3 (142.251.92.3) 14.223 ms 142.251.227.251 (142.251.227.251) 14.507 ms 142.251.92.3 (142.251.92.3) 15.328 ms
9 ams15s29-in-f14.1e100.net (172.217.17.110) 14.097 ms 14.909 ms 142.251.242.230 (142.251.242.230) 13.481 ms
root@freak:~#
If you have MTR then you can get plenty of useful additional information such as the Network HOP name or the Country location of the HOP.
To get HOP name:
root@freak:~# mtr -z google.com
To get info on where (which Country) exactly network HOP is located physically:
root@freak:~# mtr -y 2 google.com
7. Check iptables INPUT / FORWARD / OUTPUT rules are messing with something
# iptables -L -n
…
# iptables -t nat -L -n
…
Ideally you would not have any firewall
# iptables -L -n
Chain INPUT (policy ACCEPT)
target prot opt source destination
Chain FORWARD (policy ACCEPT)
target prot opt source destination
Chain OUTPUT (policy ACCEPT)
target prot opt source destination
# iptables -t nat -L -n
Chain PREROUTING (policy ACCEPT)
target prot opt source destination
Chain INPUT (policy ACCEPT)
target prot opt source destination
Chain OUTPUT (policy ACCEPT)
target prot opt source destination
Chain POSTROUTING (policy ACCEPT)
target prot opt source destination
In case if something like firewalld is enabled as a default serviceto provide some modern Linux firewall as Ubuntu and Redhat / CentOS / Fedoras has it often turned on as a service stop and disable the service
# systemctl stop firewalld
# systemctl disable firewalld
8. Debug for any possible MAC address duplicates
root@pcfrxen:~# arp -an
? (192.168.1.33) at 00:16:3e:59:96:9e [ether] on eth0
? (192.168.1.1) at 18:45:93:c6:d8:00 [ether] on eth1
? (192.168.0.1) at 8c:89:a5:f2:e8:d9 [ether] on eth1
? (192.168.1.1) at 18:45:93:c6:d8:00 [ether] on eth0
? (192.168.1.11) at 7c:0a:3f:89:b6:fa [ether] on eth1
? (192.168.1.17) at <incomplete> on eth0
? (192.168.1.37) at 00:16:3e:ea:05:ce [ether] on eth0
? (192.168.1.80) at 8c:89:a5:f2:e7:d8 [ether] on eth0
? (192.168.1.11) at 7c:0a:3f:89:a5:fa [ether] on eth0
? (192.168.1.30) at 00:16:3e:bb:46:45 [ether] on eth1
? (192.168.0.210) at 00:16:3e:68:d9:55 [ether] on eth1
? (192.168.1.30) at 00:16:3e:bb:46:45 [ether] on eth0
? (192.168.1.18) at 00:16:3e:0d:40:05 [ether] on eth1
? (192.168.0.211) at 00:16:3e:4d:41:05 [ether] on eth1
? (192.168.1.35) at 00:16:3e:d1:8f:77 [ether] on eth0
? (192.168.1.18) at 00:16:3e:0d:43:05 [ether] on eth0
? (192.168.1.28) at 00:16:3e:04:12:1c [ether] on eth1
? (192.168.0.3) at 70:e2:84:13:43:12 [ether] on eth1
? (192.168.0.208) at 00:16:3e:51:de:9c [ether] on eth1
? (192.168.0.241) at 00:16:3e:0d:48:06 [ether] on eth1
? (192.168.1.28) at 00:16:3e:04:12:1c [ether] on eth0
? (192.168.1.33) at 00:16:3e:59:97:8e [ether] on eth1
? (192.168.0.241) at 00:16:3e:0d:45:06 [ether] on eth0
? (192.168.0.209) at 00:16:3e:5c:df:96 [ether] on eth1
root@pcfrxen:~# ip neigh show
192.168.1.33 dev eth0 lladdr 00:16:3e:59:96:9e REACHABLE
192.168.1.1 dev eth1 lladdr 18:45:93:c6:d8:00 STALE
192.168.0.1 dev eth1 lladdr 8c:89:a5:f2:e8:d9 REACHABLE
192.168.1.1 dev eth0 lladdr 18:45:93:c6:d9:01 REACHABLE
192.168.1.11 dev eth1 lladdr 7c:0a:3f:89:a6:fb STALE
192.168.1.17 dev eth0 FAILED
192.168.1.37 dev eth0 lladdr 00:16:3e:ea:06:ce STALE
192.168.1.80 dev eth0 lladdr 8c:89:a5:f2:e8:d9 REACHABLE
192.168.1.11 dev eth0 lladdr 7c:0a:3f:89:a7:fa STALE
192.168.1.30 dev eth1 lladdr 00:16:3e:bb:45:46 STALE
192.168.0.210 dev eth1 lladdr 00:16:3e:68:d8:56 REACHABLE
192.168.1.30 dev eth0 lladdr 00:16:3e:bb:45:46 STALE
192.168.1.18 dev eth1 lladdr 00:16:3e:0d:48:04 STALE
192.168.0.211 dev eth1 lladdr 00:16:3e:4d:40:04 STALE
192.168.1.35 dev eth0 lladdr 00:16:3e:d2:8f:76 STALE
192.168.1.18 dev eth0 lladdr 00:16:3e:0d:48:06 STALE
192.168.1.28 dev eth1 lladdr 00:16:3e:04:11:2c STALE
192.168.0.3 dev eth1 lladdr 70:e2:84:13:44:13 STALE
192.168.0.208 dev eth1 lladdr 00:16:3e:51:de:9c REACHABLE
192.168.0.241 dev eth1 lladdr 00:16:3e:0d:48:07 STALE
192.168.1.28 dev eth0 lladdr 00:16:3e:04:12:1c REACHABLE
192.168.1.33 dev eth1 lladdr 00:16:3e:59:96:9e STALE
192.168.0.241 dev eth0 lladdr 00:16:3e:0d:49:06 STALE
192.168.0.209 dev eth1 lladdr 00:16:3e:5c:dd:97 STALE
root@pcfrxen:~#
9. Check out with netstat / ss for any irregularities such as high amount of error of faulty ICMP / TCP / UDP network packs
For example check out the netstat network stack output
# netstat -s
root@pcfrxen:~# netstat -s
Ip:
Forwarding: 2
440044929 total packets received
1032 with invalid addresses
0 forwarded
0 incoming packets discarded
439988902 incoming packets delivered
396161852 requests sent out
3 outgoing packets dropped
100 dropped because of missing route
Icmp:
1025 ICMP messages received
540 input ICMP message failed
ICMP input histogram:
destination unreachable: 1014
timeout in transit: 11
519 ICMP messages sent
0 ICMP messages failed
ICMP output histogram:
destination unreachable: 519
IcmpMsg:
InType3: 1014
InType11: 11
OutType3: 519
Tcp:
1077237 active connection openings
1070510 passive connection openings
1398236 failed connection attempts
111345 connection resets received
83 connections established
438293250 segments received
508143650 segments sent out
42567 segments retransmitted
546 bad segments received
329039 resets sent
Udp:
1661295 packets received
278 packets to unknown port received
0 packet receive errors
1545720 packets sent
0 receive buffer errors
0 send buffer errors
IgnoredMulti: 33046
UdpLite:
TcpExt:
1 invalid SYN cookies received
1398196 resets received for embryonic SYN_RECV sockets
1737473 packets pruned from receive queue because of socket buffer overrun
1118775 TCP sockets finished time wait in fast timer
638 time wait sockets recycled by time stamp
656 packetes rejected in established connections because of timestamp
2218959 delayed acks sent
2330 delayed acks further delayed because of locked socket
Quick ack mode was activated 7172 times
271799723 packet headers predicted
14917420 acknowledgments not containing data payload received
171078735 predicted acknowledgments
52 times recovered from packet loss due to fast retransmit
TCPSackRecovery: 337
Detected reordering 1551 times using SACK
Detected reordering 1501 times using reno fast retransmit
Detected reordering 61 times using time stamp
9 congestion windows fully recovered without slow start
38 congestion windows partially recovered using Hoe heuristic
TCPDSACKUndo: 241
104 congestion windows recovered without slow start after partial ack
TCPLostRetransmit: 11550
1 timeouts after reno fast retransmit
TCPSackFailures: 13
3772 fast retransmits
2 retransmits in slow start
TCPTimeouts: 24104
TCPLossProbes: 101748
TCPLossProbeRecovery: 134
TCPSackRecoveryFail: 3
128989224 packets collapsed in receive queue due to low socket buffer
TCPBacklogCoalesce: 715034
TCPDSACKOldSent: 7168
TCPDSACKOfoSent: 341
TCPDSACKRecv: 16612
150689 connections reset due to unexpected data
27063 connections reset due to early user close
17 connections aborted due to timeout
TCPDSACKIgnoredOld: 158
TCPDSACKIgnoredNoUndo: 13514
TCPSpuriousRTOs: 9
TCPSackMerged: 1191
TCPSackShiftFallback: 1011
TCPDeferAcceptDrop: 699473
TCPRcvCoalesce: 3311764
TCPOFOQueue: 14289375
TCPOFOMerge: 356
TCPChallengeACK: 621
TCPSYNChallenge: 621
TCPSpuriousRtxHostQueues: 4
TCPAutoCorking: 1605205
TCPFromZeroWindowAdv: 132380
TCPToZeroWindowAdv: 132441
TCPWantZeroWindowAdv: 1445495
TCPSynRetrans: 23652
TCPOrigDataSent: 388992604
TCPHystartTrainDetect: 69089
TCPHystartTrainCwnd: 3264904
TCPHystartDelayDetect: 4
TCPHystartDelayCwnd: 128
TCPACKSkippedPAWS: 3
TCPACKSkippedSeq: 2001
TCPACKSkippedChallenge: 2
TCPWinProbe: 123043
TCPKeepAlive: 4389
TCPDelivered: 389507445
TCPAckCompressed: 7343781
TcpTimeoutRehash: 23311
TcpDuplicateDataRehash: 8
TCPDSACKRecvSegs: 17335
IpExt:
InMcastPkts: 145100
OutMcastPkts: 9429
InBcastPkts: 18226
InOctets: 722933727848
OutOctets: 759502627470
InMcastOctets: 58227095
OutMcastOctets: 3284379
InBcastOctets: 1756918
InNoECTPkts: 440286946
InECT0Pkts: 936
- List all listening established connections to host
# netstat -ltne
- List all UDP / TCP connections
# netstat -ltua
or if you prefer to do it with the newer and more comprehensive tool ss:
- List all listening TCP connections
# ss -lt
- List all listening UDP connections
# ss -ua
- Display statistics about recent connections
root@pcfrxen:~# ss -s
Total: 329
TCP: 896 (estab 70, closed 769, orphaned 0, timewait 767)
Transport Total IP IPv6
RAW 0 0 0
UDP 40 36 4
TCP 127 118 9
INET 167 154 13
FRAG 0 0 0
- If you need to debug some specific sport or dport filter out the connection you need by port number
# ss -at '( dport = :22 or sport = :22 )'
Debug for any possible issues with ICMP unreachable but ports reachable with NMAP / telnet / Netcat
# nc 192.168.0.1 -vz
root@pcfrxen:/ # nc 192.168.0.1 80 -vz
pcfreak [192.168.0.1] 80 (http) open
root@pcfrxen:/ # nc 192.168.0.1 5555 -vz
pcfreak [192.168.0.1] 5555 (?) : Connection refused
root@pcfrxen:/# telnet 192.168.0.1 3128
Trying 192.168.0.1…
Connected to 192.168.0.1.
Escape character is '^]'.
^]
telnet> quit
Connection closed.
root@pcfrxen:/# nmap -sS -P0 192.168.0.1 -p 443 -O
Starting Nmap 7.80 ( https://nmap.org ) at 2023-11-27 19:51 EET
Nmap scan report for pcfreak (192.168.0.1)
Host is up (0.00036s latency).
PORT STATE SERVICE
443/tcp open https
MAC Address: 8C:89:A5:F2:E8:D8 (Micro-Star INT'L)
Warning: OSScan results may be unreliable because we could not find at least 1 open and 1 closed port
Aggressive OS guesses: Linux 3.11 (96%), Linux 3.1 (95%), Linux 3.2 (95%), AXIS 210A or 211 Network Camera (Linux 2.6.17) (94%), Linux 2.6.32 (94%), Linux 3.10 (94%), Linux 2.6.18 (93%), Linux 3.2 – 4.9 (93%), ASUS RT-N56U WAP (Linux 3.4) (93%), Linux 3.16 (93%)
No exact OS matches for host (test conditions non-ideal).
Network Distance: 1 hop
OS detection performed. Please report any incorrect results at https://nmap.org/submit/ .
Nmap done: 1 IP address (1 host up) scanned in 6.24 seconds
root@pcfrxen:/#
10. Add static MAC address to Ethernet Interface (if you find a MAC address being wrongly assigned to interface)
Sometimes problems with network unrechability between hosts is caused by wrongly defined MAC addresses on a Switch that did not correspond correctly to the ones assigned on the Linux host.
The easiest resolution here if you don't have access to Switch in work environment is to reassign the default MAC addresses of interfaces to proper MAC addresses, expected by remote router.
root@pcfrxen:/# /sbin/ifconfig eth2 hw ether 8c:89:a5:f2:e8:d6
root@pcfrxen:/# /sbin/ifconfig eth1 hw ether 8c:89:a5:f2:e8:d5
root@pcfrxen:/# ifconfig eth0|grep -i ether
ether 8c:89:a5:f2:e8:d6 txqueuelen 1000 (Ethernet)
11. Check for Network Address Translation (NAT) misconfigurations
If you do use some NAT-ing between Linux host and the remote Network Device you cannot reach, make sure IP Forwarding is enabled (i.e. /etc/sysctl.conf was not mistakenly overwritten by a script or admin for whatever reason).
root@server:~# sysctl net.ipv4.ip_forward
net.ipv4.ip_forward = 1
root@server:~# sysctl net.ipv4.conf.all.forwarding
net.ipv4.conf.all.forwarding = 1
root@server:~# sysctl net.ipv6.conf.all.forwarding
net.ipv6.conf.all.forwarding = 0
12. Check for Resolving DNS irregularities with /etc/resolv.conf
If network connectivity is okay on TCP / IP , UDP Level but problems with DNS of course, check what you have configured inside /etc/resolv.conf
And if use newer Linux distributions and have resolving managed by systemd check status of resolvectl
root@server:~# cat /etc/resolv.conf
# Dynamic resolv.conf(5) file for glibc resolver(3) generated by resolvconf(8)
# DO NOT EDIT THIS FILE BY HAND — YOUR CHANGES WILL BE OVERWRITTEN
# 127.0.0.53 is the systemd-resolved stub resolver.
# run "resolvectl status" to see details about the actual nameservers.
nameserver 127.0.0.1
search pc-freak.net
domain pc-freak.net
nameserver 8.8.8.8
nameserver 8.8.4.4
nameserver 109.104.195.2
nameserver 109.104.195.1
nameserver 208.67.222.222
nameserver 208.67.220.220
options timeout:2 rotate
root@pcfreak:~#
root@server:~# resolvectl status
Global
Protocols: -LLMNR -mDNS -DNSOverTLS DNSSEC=no/unsupported
resolv.conf mode: stub
Link 2 (ens3)
Current Scopes: DNS
Protocols: +DefaultRoute +LLMNR -mDNS -DNSOverTLS DNSSEC=no/unsupported
Current DNS Server: 192.168.5.1
DNS Servers: 192.168.5.1
As seen see, the systemd-resolved service is used to provide domain names resolution and we can modify its configuration file /etc/systemd/resolved.conf to add the DNS server – the following line is set (two DNS servers’ addresses are added):
For example …
DNS=8.8.8.8
13. Fix problems with wrongly configured Network Speed between hosts
It is not uncommon to have a Switch between two Linux hosts that is set to communicate on a certain maximum amount of Speed but a Linux host is set to communicate or lesser or more of Speed, this might create network issues so in such cases make sure either you use the Auto Negitionation network feature
or set both sides to be communicating on the same amount of network speed.
To turn on auto negotiation for ether interface
# ethtool -s eth1 speed 1000 duplex full autoneg on
For example to set a Linux network interface to communicate on 1 Gigabit speed and switch off autonegotiation off.
# ethtool -s eth1 speed 1000 duplex full autoneg off
14. Check arp and icmp traffic with tcpdump
On both sides where the IPs can't see each other we can run a tcpdump to check the ARP and ICMP traffic flowing between the hosts.
# tcpdump -i eth1 arp or icmp
cpdump: verbose output suppressed, use -v[v]… for full protocol decode
listening on eth1, link-type EN10MB (Ethernet), snapshot length 262144 bytes
15:29:07.001841 IP freak-eth1 > pcfr_hware_local_ip: ICMP echo request, id 13348, seq 65, length 64
15:29:07.001887 IP pcfr_hware_local_ip > freak-eth1: ICMP echo reply, id 13348, seq 65, length 64
15:29:07.598413 ARP, Request who-has pcfr_hware_local_ip tell zabbix-server, length 46
15:29:07.598425 ARP, Reply pcfr_hware_local_ip is-at 8c:89:a5:f2:e8:d8 (oui Unknown), length 28
15:29:07.633055 ARP, Request who-has freak_vivacom_auto_assigned_dhcp_ip tell 192.168.1.1, length 46
15:29:08.025824 IP freak-eth1 > pcfr_hware_local_ip: ICMP echo request, id 13348, seq 66, length 64
15:29:08.025864 IP pcfr_hware_local_ip > freak-eth1: ICMP echo reply, id 13348, seq 66, length 64
# tcpdump -i eth1 -vvv
…
If you want to sniff for TCP protocol and specific port and look up for DATA transfered for SMTP you can use something like:
# tcpdump -nNxXi eth0 -s 0 proto TCP and port 25
If you need a bit more thorough explanation on what it would do check out my previous article How to catch / track mail server traffic abusers with tcpdump.
15. Debugging network bridge issues
Having bridge network interface is another brink where things could go totally wrong.
If you have network bridges configured, check out what is the status of the bridge.
root@freak:/etc/network# brctl show
bridge name bridge id STP enabled interfaces
xenbr0 8000.70e284134411 yes eno1
vif1.0
vif10.0
vif16.0
vif16.0-emu
vif2.0
vif3.0
vif4.0
vif5.0
vif6.0
vif9.0
vif9.0-emu
xenbr1 8000.70e284134412 yes eno2
vif1.1
vif10.1
vif16.1
vif16.1-emu
vif2.1
vif3.1
vif4.1
vif5.1
vif6.1
vif9.1
vif9.1-emu
Check out any configurations such as /etc/sysconfig/network-scripts/ifcfg-* are not misconfigured if on Redhat / CentOS / Fedora.
Or if on Debian / Ubuntu and other deb based Linuxes look up for /etc/network/interfaces config problems that might be causing the bridge to misbehave.
For example one bridge network issue, I've experienced recently is related to bridge_ports variable configured as bridge_ports all.
This was causing the second bridge xenbr1 to be unable to see another local network that was directly connected with a cable to it.
The fix was bridge_ports none. Finding out this trivial issue caused by a restored network config from old backup took me days to debug.
As everything seemed on a network level to be perfect just like in Physical layer, same way and on Software level, routings were okay.
Checked everything multiple times and did not see anything irregular. ping was missing and hosts cannot see each other even though having the right netmask and
network configuration in place.
Below is my /etc/network/interfaces configuration with the correct bridge_ports none changed.
root@freak:/etc/network# cat /etc/network/interfaces
auto lo
iface lo inet loopback
auto eno1
allow-hotplug eno1
iface eno1 inet manual
dns-nameservers 127.0.0.1 8.8.8.8 8.8.4.4 207.67.222.222 208.67.220.220
auto eno2
allow-hotplug eno2
iface eno2 inet manual
dns-nameservers 127.0.0.1 8.8.8.8 8.8.4.4 207.67.222.222 208.67.220.220
auto xenbr0
allow-hotplug xenbr0
# Bridge setup
# fetching dhcp ip from 192.168.1.20 (vivacom fiber optics router) routing traffic via 1Gigabit network
iface xenbr0 inet dhcp
hwaddress ether 70:e2:84:13:44:11
# address 192.168.1.5/22
address 192.168.1.5
netmask 255.255.252.0
# address 192.168.1.8 if dhcp takes from vivacom dhcpd
bridge_ports eno1
gateway 192.168.1.20
bridge_stp on
bridge_waitport 0
bridge_fd 0
bridge_ports none
dns-nameservers 8.8.8.8 8.8.4.4
auto xenbr1
# fetching dhcp ip from pc-freak.net (192.168.0.1) bergon.net routing traffic through it
allow-hotplug xenbr1
iface xenbr1 inet dhcp
hwaddress ether 70:e2:84:13:44:11
## address 192.168.0.3/22
address 192.168.0.8
netmask 255.255.252.0
# address 192.168.0.8 if dhcp takes from vivacom dhcpd (currently mac deleted from vivacom router)
# address 192.168.0.9 if dhcp takes from pc-freak.net hware host
# hwaddress ether 70:e2:84:13:44:13
gateway 192.168.0.1
bridge_ports eno2
bridge_stp on
bridge_waitport 0
bridge_fd 0
bridge_ports none
dns-nameservers 8.8.8.8 8.8.4.4
root@freak:/etc/network#
root@freak:/etc/network# brctl showstp xenbr0
xenbr0
bridge id 8000.70e284134411
designated root 8000.70e284134411
root port 0 path cost 0
max age 20.00 bridge max age 20.00
hello time 2.00 bridge hello time 2.00
forward delay 15.00 bridge forward delay 15.00
ageing time 0.00
hello timer 1.31 tcn timer 0.00
topology change timer 0.00 gc timer 0.00
flags
eno1 (1)
port id 8001 state forwarding
designated root 8000.70e284134411 path cost 19
designated bridge 8000.70e284134411 message age timer 0.00
designated port 8001 forward delay timer 0.00
designated cost 0 hold timer 0.31
flags
vif1.0 (2)
port id 8002 state forwarding
designated root 8000.70e284134411 path cost 100
designated bridge 8000.70e284134411 message age timer 0.00
designated port 8002 forward delay timer 0.00
designated cost 0 hold timer 0.31
flags
vif10.0 (12)
port id 800c state forwarding
designated root 8000.70e284134411 path cost 100
designated bridge 8000.70e284134411 message age timer 0.00
designated port 800c forward delay timer 0.00
designated cost 0 hold timer 0.31
flags
vif16.0 (13)
port id 800d state disabled
designated root 8000.70e284134411 path cost 100
designated bridge 8000.70e284134411 message age timer 0.00
designated port 800d forward delay timer 0.00
designated cost 0 hold timer 0.00
flags
vif16.0-emu (14)
port id 800e state forwarding
designated root 8000.70e284134411 path cost 100
designated bridge 8000.70e284134411 message age timer 0.00
designated port 800e forward delay timer 0.00
designated cost 0 hold timer 0.31
flags
vif2.0 (4)
port id 8004 state forwarding
designated root 8000.70e284134411 path cost 100
designated bridge 8000.70e284134411 message age timer 0.00
designated port 8004 forward delay timer 0.00
designated cost 0 hold timer 0.31
flags
vif3.0 (5)
port id 8005 state forwarding
designated root 8000.70e284134411 path cost 100
designated bridge 8000.70e284134411 message age timer 0.00
designated port 8005 forward delay timer 0.00
designated cost 0 hold timer 0.31
flags
vif4.0 (3)
port id 8003 state forwarding
designated root 8000.70e284134411 path cost 100
designated bridge 8000.70e284134411 message age timer 0.00
designated port 8003 forward delay timer 0.00
designated cost 0 hold timer 0.31
flags
vif5.0 (6)
port id 8006 state forwarding
designated root 8000.70e284134411 path cost 100
designated bridge 8000.70e284134411 message age timer 0.00
designated port 8006 forward delay timer 0.00
designated cost 0 hold timer 0.31
flags
vif6.0 (7)
port id 8007 state forwarding
designated root 8000.70e284134411 path cost 100
designated bridge 8000.70e284134411 message age timer 0.00
designated port 8007 forward delay timer 0.00
designated cost 0 hold timer 0.31
flags
vif9.0 (10)
port id 800a state disabled
designated root 8000.70e284134411 path cost 100
designated bridge 8000.70e284134411 message age timer 0.00
designated port 800a forward delay timer 0.00
designated cost 0 hold timer 0.00
flags
vif9.0-emu (11)
port id 800b state forwarding
designated root 8000.70e284134411 path cost 100
designated bridge 8000.70e284134411 message age timer 0.00
designated port 800b forward delay timer 0.00
designated cost 0 hold timer 0.31
flags
root@freak:/etc/network#
Sum it up
We have learned how to debug various routing issues, how to add and remote default gateways, check network reachability with ICMP protocol with ping, traceroute as well check for DNS issues and given some hints how to resolve DNS misconfigurations.
We also learned how to check the configured Network interfaces certain settings and resolve issues caused by Network sides max Speed misconfigurations as well how to track and resolve communication issues caused by wrongly configured MAC addresses.
Further more learned on how to do a basic port and protocol debugging of state of Network packets with netstat and nc and check problems related to iptables Firewall and IP Forwarding misconfigurations.
Finally we learned some basic usage of tcpdump on how to track arp and MAC traffic and look up for a specific TCP / UDP protocol and its contained data.
There is certainly things this article is missing as the topic of debugging network connectivity issues on Linux is a whole ocean, especially as the complexity of Linux has grown dramatically these days.
I gues it is worthy to mention that unable to see remote network could be caused by wrong VLAN configurations on Linux or even buggy switches and router devices, due to hardware or software,
but I hope this article at least covers the very basics of network debugging and Linux.
Enjojy 🙂