
As a system administration nomatter whether you manage a bunch of server in a own brew and run Data Center location with some Rack mounted Hardware like PowerEdge M600 / ProLiant DL360e G8 / ProLiant DL360 Gen9 (755258-B21) or you're managing a bunch of Dedicated Servers, you're or will be faced at some point to use the embedded in many Rack mountable rack servers IPMI / ILO interface remote console board management. If IPMI / ILO terms are new for you I suggest you quickly read my earlier article What is IPMI / IPKVM / ILO / DRAC Remote Management interfaces to server .
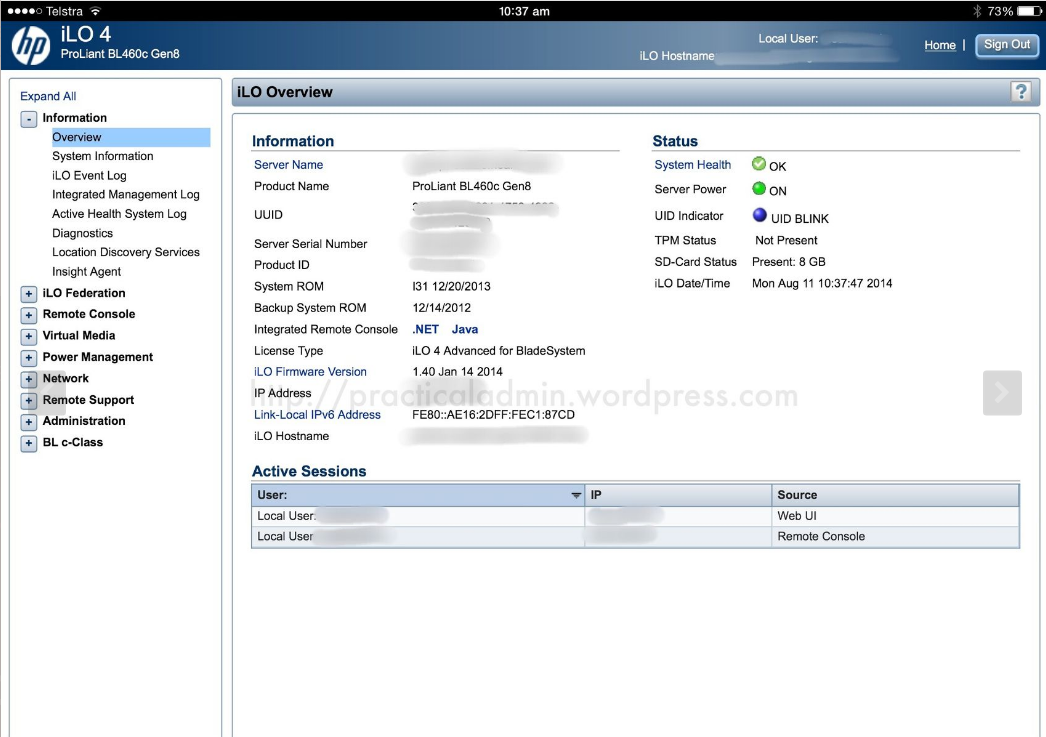
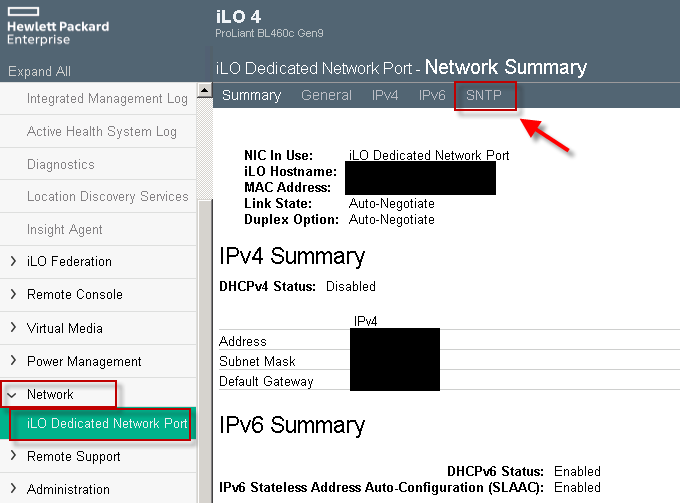
HP Proliant BL460 C IPMI (ILO) Web management interface
In short Remote Management Interface is a way that gives you access to the server just like if you had a Monitor and a Keyboard plugged in directly to server.
When a remote computer is down the sysadmin can access it through IPMI and utilize a text console to the boot screen.
The IPMI protocol specification is led by Intel and was first published on September 16, 1998. and currently is supported by more than 200 computer system vendors, such as Cisco, Dell, Hewlett Packard Enterprise, Intel, NEC Corporation, SuperMicro and Tyan and is a standard for remote board management for servers.
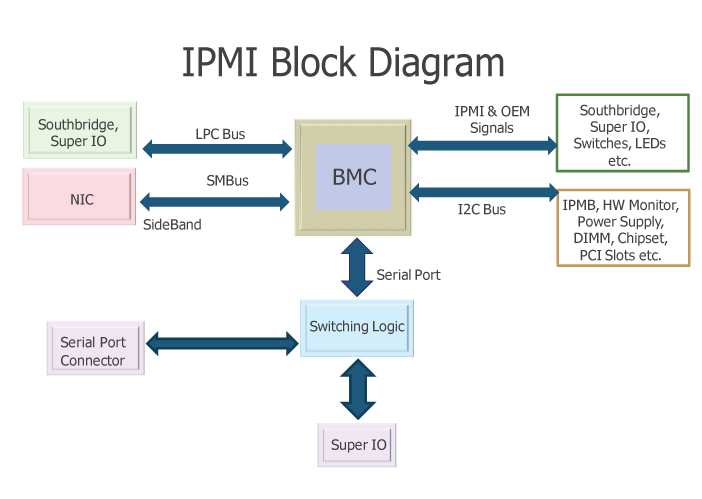
As you can see from diagram Baseboard Management Controllers (BMCs) is like the heart of IPMI.
Having this ILO / IPMI access is usually via a Web Interface Java interface that gives you the console and usually many of the machines also have an IP address via which a normal SSH command prompt is available giving you ability to execute diagnostic commands to the ILO on the status of attached hardware components of the server / get information about the attached system sensors to get report about things such as:
- The System Overall heat
- CPU heat temperature
- System fan rotation speed cycles
- Extract information about the server chassis
- Query info about various system peripherals
- Configure BIOS or UEFI on a remote system with no monitor / keyboard attached
Having a IPMI (Intelligent Platform Management Interface) firmware embedded into the server Motherboard is essential for system administration because besides this goodies it allows you to remotely Install Operating System to a server without any pre-installed OS right after it is bought and mounted to the planned Data Center Rack nest, just like if you have a plugged Monitor / Keyboard and Mouse and being physically in the remote location.
IPMI is mega useful for system administration also in case of Linux / Windows system updates that requires reboot in which essential System Libraries or binaries are updated and a System reboot is required, because often after system Large bundle updates or Release updates the system fails to boot and you need a way to run a diagnostic stuff from a System rescue Operating System living on a plugged in via a USB stick or CD Drive.
As prior said IPMI remote board is usually accessed and used via some Remote HTTPS encrypted web interface or via Secure Shell crypted session but sometimes the Web server behind the IPMI Web Interface is hanging especially when multiple sysadmins try to access it or due to other stuff and at times due to strange stuff even console SSH access might not be there, thansfully those who run a GNU / Linux Operating system on the Hardware node can use ipmitool tool http://ipmitool.sourceforge.net/ written for Linux that is capable to do a number of useful things with the IPMI management board including a Cold Reset of it so it turns back to working state / adding users / grasping the System hardware and components information health status, changing the Listener address of the IPMI access Interface and even having ability to update the IPMI version firmware.
Prior to be able to access IPMI remotely it has to be enabled usually via a UTP cable connected to the Network from which you expect it to be accesible. The location of the IPMI port on different server vendors is different.
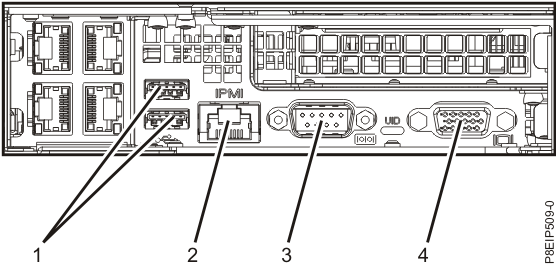
IBM Power 9 Server IPMI port
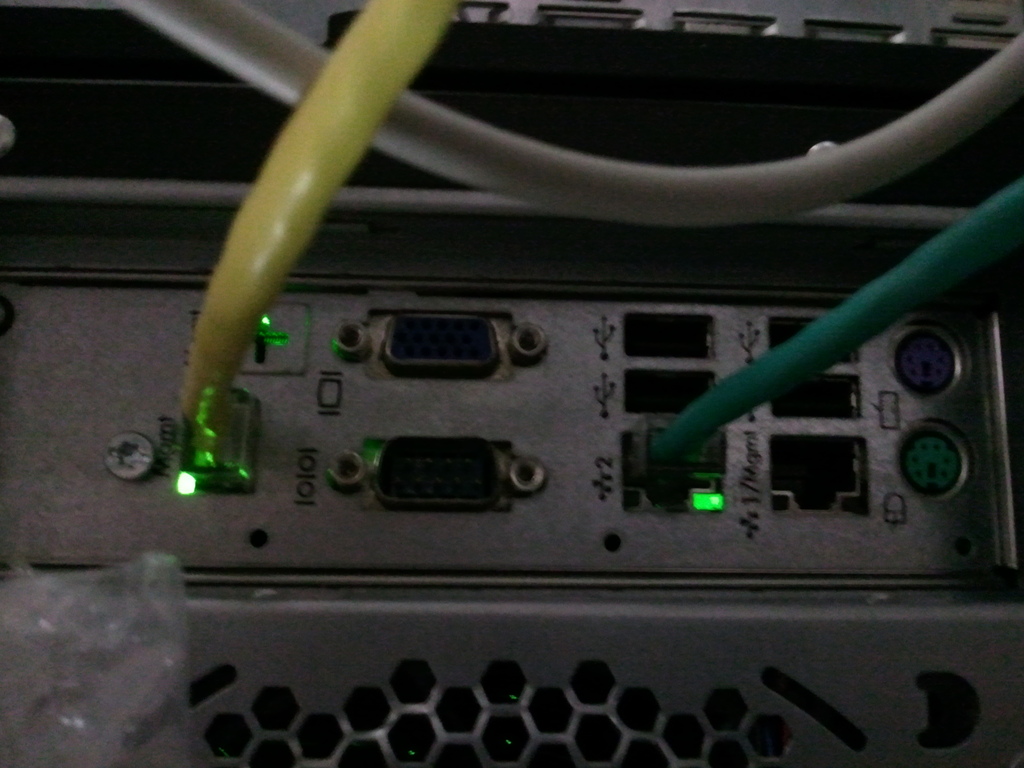
HP IPMI console called ILO (Integrated Lights-Out) Port cabled with yellow cable (usually labelled as
Management Port MGMT)
Supermicro server IPMI Dedicated Lan Port
In this article I'll shortly explain how IPMITool is available and can be installed and used across GNU / Linux Debian / Ubuntu and other deb based Linuxes with apt or on Fedora / CentOS (RPM) based with yum etc.
1. Install IPMITool
– On Debian
# apt-get install –yes ipmitool
– On CentOS
# yum install ipmitool OpenIPMI-tools
# ipmitool -V
ipmitool version 1.8.14
On CentOS ipmitool can run as a service and collect data and do some nice stuff to run it:
[root@linux ~]# chkconfig ipmi on
[root@linux ~]# service ipmi start
Before start using it is worthy to give here short description from ipmitool man page
DESCRIPTION
This program lets you manage Intelligent Platform Management Interface (IPMI) functions of either the local system, via a kernel device driver, or a remote system, using IPMI v1.5 and IPMI v2.0.
These functions include printing FRU information, LAN configuration, sensor readings, and remote chassis power control.
IPMI management of a local system interface requires a compatible IPMI kernel driver to be installed and configured. On Linux this driver is called OpenIPMI and it is included in standard dis‐
tributions. On Solaris this driver is called BMC and is included in Solaris 10. Management of a remote station requires the IPMI-over-LAN interface to be enabled and configured. Depending on
the particular requirements of each system it may be possible to enable the LAN interface using ipmitool over the system interface.
2. Get ADMIN IP configured for access
To get a list of what is the current listener IP with no access to above Web frontend via which IPMI can be accessed (if it is cabled to the Access / Admin LAN port).
# ipmitool lan print 1
Set in Progress : Set Complete
Auth Type Support : NONE MD2 MD5 PASSWORD
Auth Type Enable : Callback : MD2 MD5 PASSWORD
: User : MD2 MD5 PASSWORD
: Operator : MD2 MD5 PASSWORD
: Admin : MD2 MD5 PASSWORD
: OEM :
IP Address Source : Static Address
IP Address : 10.253.41.127
Subnet Mask : 255.255.254.0
MAC Address : 0c:c4:7a:4b:1f:70
SNMP Community String : public
IP Header : TTL=0x00 Flags=0x00 Precedence=0x00 TOS=0x00
BMC ARP Control : ARP Responses Enabled, Gratuitous ARP Disabled
Default Gateway IP : 10.253.41.254
Default Gateway MAC : 00:00:0c:07:ac:7b
Backup Gateway IP : 10.253.41.254
Backup Gateway MAC : 00:00:00:00:00:00
802.1q VLAN ID : 8
802.1q VLAN Priority : 0
RMCP+ Cipher Suites : 1,2,3,6,7,8,11,12
Cipher Suite Priv Max : aaaaXXaaaXXaaXX
: X=Cipher Suite Unused
: c=CALLBACK
: u=USER
: o=OPERATOR
: a=ADMIN
: O=OEM
3. Configure custom access IP and gateway for IPMI
[root@linux ~]# ipmitool lan set 1 ipsrc static
[root@linux ~]# ipmitool lan set 1 ipaddr 192.168.1.211
Setting LAN IP Address to 192.168.1.211
[root@linux ~]# ipmitool lan set 1 netmask 255.255.255.0
Setting LAN Subnet Mask to 255.255.255.0
[root@linux ~]# ipmitool lan set 1 defgw ipaddr 192.168.1.254
Setting LAN Default Gateway IP to 192.168.1.254
[root@linux ~]# ipmitool lan set 1 defgw macaddr 00:0e:0c:aa:8e:13
Setting LAN Default Gateway MAC to 00:0e:0c:aa:8e:13
[root@linux ~]# ipmitool lan set 1 arp respond on
Enabling BMC-generated ARP responses
[root@linux ~]# ipmitool lan set 1 auth ADMIN MD5
[root@linux ~]# ipmitool lan set 1 access on
4. Getting a list of IPMI existing users
# ipmitool user list 1
ID Name Callin Link Auth IPMI Msg Channel Priv Limit
2 admin1 false false true ADMINISTRATOR
3 ovh_dontchange true false true ADMINISTRATOR
4 ro_dontchange true true true USER
6 true true true NO ACCESS
7 true true true NO ACCESS
8 true true true NO ACCESS
9 true true true NO ACCESS
10 true true true NO ACCESS
– To get summary of existing users
# ipmitool user summary
Maximum IDs : 10
Enabled User Count : 4
Fixed Name Count : 2
5. Create new Admin username into IPMI board
[root@linux ~]# ipmitool user set name 2 Your-New-Username
[root@linux ~]# ipmitool user set password 2
Password for user 2:
Password for user 2:
[root@linux ~]# ipmitool channel setaccess 1 2 link=on ipmi=on callin=on privilege=4
[root@linux ~]# ipmitool user enable 2
[root@linux ~]#
6. Configure non-privilege user into IPMI board
If a user should only be used for querying sensor data, a custom privilege level can be setup for that. This user then has no rights for activating or deactivating the server, for example. A user named monitor will be created for this in the following example:
[root@linux ~]# ipmitool user set name 3 monitor
[root@linux ~]# ipmitool user set password 3
Password for user 3:
Password for user 3:
[root@linux ~]# ipmitool channel setaccess 1 3 link=on ipmi=on callin=on privilege=2
[root@linux ~]# ipmitool user enable 3
The importance of the various privilege numbers will be displayed when
ipmitool channel
is called without any additional parameters.
[root@linux ~]# ipmitool channel
Channel Commands: authcap <channel number> <max privilege>
getaccess <channel number> [user id]
setaccess <channel number> <user id> [callin=on|off] [ipmi=on|off] [link=on|off] [privilege=level]
info [channel number]
getciphers <ipmi | sol> [channel]
Possible privilege levels are:
1 Callback level
2 User level
3 Operator level
4 Administrator level
5 OEM Proprietary level
15 No access
[root@linux ~]#
The user just created (named 'monitor') has been assigned the USER privilege level. So that LAN access is allowed for this user, you must activate MD5 authentication for LAN access for this user group (USER privilege level).
[root@linux ~]# ipmitool channel getaccess 1 3
Maximum User IDs : 15
Enabled User IDs : 2
User ID : 3
User Name : monitor
Fixed Name : No
Access Available : call-in / callback
Link Authentication : enabled
IPMI Messaging : enabled
Privilege Level : USER
[root@linux ~]#
7. Check server firmware version on a server via IPMI
# ipmitool mc info
Device ID : 32
Device Revision : 1
Firmware Revision : 3.31
IPMI Version : 2.0
Manufacturer ID : 10876
Manufacturer Name : Supermicro
Product ID : 1579 (0x062b)
Product Name : Unknown (0x62B)
Device Available : yes
Provides Device SDRs : no
Additional Device Support :
Sensor Device
SDR Repository Device
SEL Device
FRU Inventory Device
IPMB Event Receiver
IPMB Event Generator
Chassis Device
ipmitool mc info is actually an alias for the ipmitool bmc info cmd.
8. Reset IPMI management controller or BMC if hanged
As earlier said if for some reason Web GUI access or SSH to IPMI is lost, reset with:
root@linux:/root# ipmitool mc reset
[ warm | cold ]
If you want to stop electricity for a second to IPMI and bring it on use the cold reset (this usually
should be done if warm reset does not work).
root@linux:/root# ipmitool mc reset cold
otherwise soft / warm is with:
ipmitool mc reset warm
Sometimes the BMC component of IPMI hangs and only fix to restore access to server Remote board is to reset also BMC
root@linux:/root# ipmitool bmc reset cold
9. Print hardware system event log
root@linux:/root# ipmitool sel info
SEL Information
Version : 1.5 (v1.5, v2 compliant)
Entries : 0
Free Space : 10240 bytes
Percent Used : 0%
Last Add Time : Not Available
Last Del Time : 07/02/2015 17:22:34
Overflow : false
Supported Cmds : 'Reserve' 'Get Alloc Info'
# of Alloc Units : 512
Alloc Unit Size : 20
# Free Units : 512
Largest Free Blk : 512
Max Record Size : 20
ipmitool sel list
SEL has no entries
In this particular case the system shows no entres as it was run on a tiny Microtik 1U machine, however usually on most Dell PowerEdge / HP Proliant / Lenovo System X machines this will return plenty of messages.
ipmitool sel elist
ipmitool sel clear
To clear anything if such logged
ipmitool sel clear
10. Print Field Replaceable Units ( FRUs ) on the server
[root@linux ~]# ipmitool fru print
FRU Device Description : Builtin FRU Device (ID 0)
Chassis Type : Other
Chassis Serial : KD5V59B
Chassis Extra : c3903ebb6237363698cdbae3e991bbed
Board Mfg Date : Mon Sep 24 02:00:00 2012
Board Mfg : IBM
Board Product : System Board
Board Serial : XXXXXXXXXXX
Board Part Number : 00J6528
Board Extra : 00W2671
Board Extra : 1400
Board Extra : 0000
Board Extra : 5000
Board Extra : 10
…
Product Manufacturer : IBM
Product Name : System x3650 M4
Product Part Number : 1955B2G
Product Serial : KD7V59K
Product Asset Tag :
FRU Device Description : Power Supply 1 (ID 1)
Board Mfg Date : Mon Jan 1 01:00:00 1996
Board Mfg : ACBE
Board Product : IBM Designed Device
Board Serial : YK151127R1RN
Board Part Number : ZZZZZZZ
Board Extra : ZZZZZZ<FF><FF><FF><FF><FF>
Board Extra : 0200
Board Extra : 00
Board Extra : 0080
Board Extra : 1
FRU Device Description : Power Supply 2 (ID 2)
Board Mfg Date : Mon Jan 1 01:00:00 1996
Board Mfg : ACBE
Board Product : IBM Designed Device
Board Serial : YK131127M1LE
Board Part Number : ZZZZZ
Board Extra : ZZZZZ<FF><FF><FF><FF><FF>
Board Extra : 0200
Board Extra : 00
Board Extra : 0080
Board Extra : 1
FRU Device Description : DASD Backplane 1 (ID 3)
….
Worthy to mention here is some cheaper server vendors such as Trendmicro might show no data here (no idea whether this is a protocol incompitability or IPMItool issue).
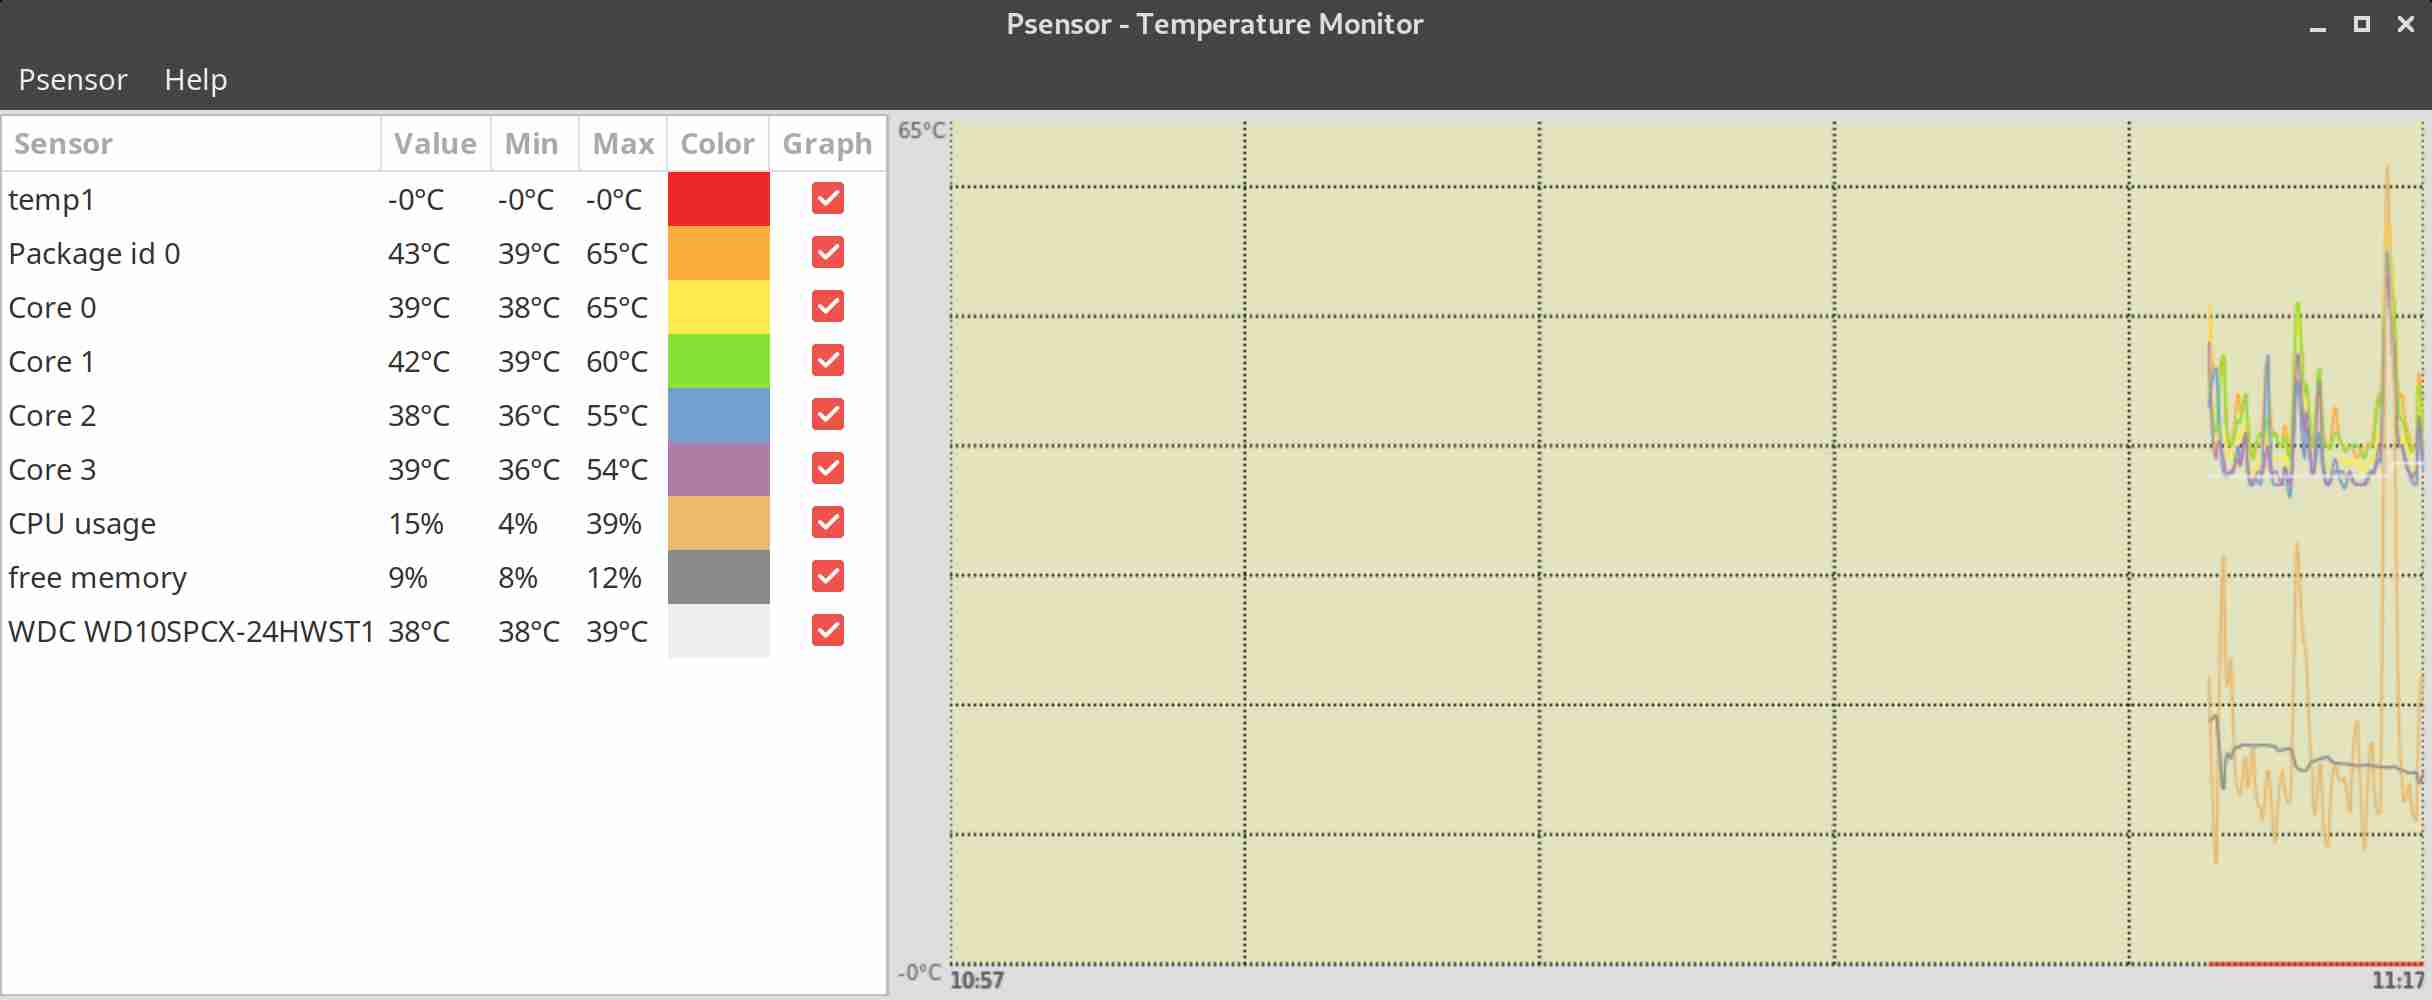
11. Get output about system sensors Temperature / Fan / Power Supply
Most newer servers have sensors to track temperature / voltage / fanspeed peripherals temp overall system temp etc.
To get a full list of sensors statistics from IPMI
# ipmitool sensor
CPU Temp | 29.000 | degrees C | ok | 0.000 | 0.000 | 0.000 | 95.000 | 98.000 | 100.000
System Temp | 40.000 | degrees C | ok | -9.000 | -7.000 | -5.000 | 80.000 | 85.000 | 90.000
Peripheral Temp | 41.000 | degrees C | ok | -9.000 | -7.000 | -5.000 | 80.000 | 85.000 | 90.000
PCH Temp | 56.000 | degrees C | ok | -11.000 | -8.000 | -5.000 | 90.000 | 95.000 | 100.000
FAN 1 | na | | na | na | na | na | na | na | na
FAN 2 | na | | na | na | na | na | na | na | na
FAN 3 | na | | na | na | na | na | na | na | na
FAN 4 | na | | na | na | na | na | na | na | na
FAN A | na | | na | na | na | na | na | na | na
Vcore | 0.824 | Volts | ok | 0.480 | 0.512 | 0.544 | 1.488 | 1.520 | 1.552
3.3VCC | 3.296 | Volts | ok | 2.816 | 2.880 | 2.944 | 3.584 | 3.648 | 3.712
12V | 12.137 | Volts | ok | 10.494 | 10.600 | 10.706 | 13.091 | 13.197 | 13.303
VDIMM | 1.496 | Volts | ok | 1.152 | 1.216 | 1.280 | 1.760 | 1.776 | 1.792
5VCC | 4.992 | Volts | ok | 4.096 | 4.320 | 4.576 | 5.344 | 5.600 | 5.632
CPU VTT | 1.008 | Volts | ok | 0.872 | 0.896 | 0.920 | 1.344 | 1.368 | 1.392
VBAT | 3.200 | Volts | ok | 2.816 | 2.880 | 2.944 | 3.584 | 3.648 | 3.712
VSB | 3.328 | Volts | ok | 2.816 | 2.880 | 2.944 | 3.584 | 3.648 | 3.712
AVCC | 3.312 | Volts | ok | 2.816 | 2.880 | 2.944 | 3.584 | 3.648 | 3.712
Chassis Intru | 0x1 | discrete | 0x0100| na | na | na | na | na | na
To get only partial sensors data from the SDR (Sensor Data Repositry) entries and readings
[root@linux ~]# ipmitool sdr list
Planar 3.3V | 3.31 Volts | ok
Planar 5V | 5.06 Volts | ok
Planar 12V | 12.26 Volts | ok
Planar VBAT | 3.14 Volts | ok
Avg Power | 80 Watts | ok
PCH Temp | 45 degrees C | ok
Ambient Temp | 19 degrees C | ok
PCI Riser 1 Temp | 25 degrees C | ok
PCI Riser 2 Temp | no reading | ns
Mezz Card Temp | no reading | ns
Fan 1A Tach | 3071 RPM | ok
Fan 1B Tach | 2592 RPM | ok
Fan 2A Tach | 3145 RPM | ok
Fan 2B Tach | 2624 RPM | ok
Fan 3A Tach | 3108 RPM | ok
Fan 3B Tach | 2592 RPM | ok
Fan 4A Tach | no reading | ns
Fan 4B Tach | no reading | ns
CPU1 VR Temp | 27 degrees C | ok
CPU2 VR Temp | 27 degrees C | ok
DIMM AB VR Temp | 24 degrees C | ok
DIMM CD VR Temp | 23 degrees C | ok
DIMM EF VR Temp | 25 degrees C | ok
DIMM GH VR Temp | 24 degrees C | ok
Host Power | 0x00 | ok
IPMI Watchdog | 0x00 | ok
[root@linux ~]# ipmitool sdr type Temperature
PCH Temp | 31h | ok | 45.1 | 45 degrees C
Ambient Temp | 32h | ok | 12.1 | 19 degrees C
PCI Riser 1 Temp | 3Ah | ok | 16.1 | 25 degrees C
PCI Riser 2 Temp | 3Bh | ns | 16.2 | No Reading
Mezz Card Temp | 3Ch | ns | 44.1 | No Reading
CPU1 VR Temp | F7h | ok | 20.1 | 27 degrees C
CPU2 VR Temp | F8h | ok | 20.2 | 27 degrees C
DIMM AB VR Temp | F9h | ok | 20.3 | 25 degrees C
DIMM CD VR Temp | FAh | ok | 20.4 | 23 degrees C
DIMM EF VR Temp | FBh | ok | 20.5 | 26 degrees C
DIMM GH VR Temp | FCh | ok | 20.6 | 24 degrees C
Ambient Status | 8Eh | ok | 12.1 |
CPU 1 OverTemp | A0h | ok | 3.1 | Transition to OK
CPU 2 OverTemp | A1h | ok | 3.2 | Transition to OK
[root@linux ~]# ipmitool sdr type Fan
Fan 1A Tach | 40h | ok | 29.1 | 3034 RPM
Fan 1B Tach | 41h | ok | 29.1 | 2592 RPM
Fan 2A Tach | 42h | ok | 29.2 | 3145 RPM
Fan 2B Tach | 43h | ok | 29.2 | 2624 RPM
Fan 3A Tach | 44h | ok | 29.3 | 3108 RPM
Fan 3B Tach | 45h | ok | 29.3 | 2592 RPM
Fan 4A Tach | 46h | ns | 29.4 | No Reading
Fan 4B Tach | 47h | ns | 29.4 | No Reading
PS 1 Fan Fault | 73h | ok | 10.1 | Transition to OK
PS 2 Fan Fault | 74h | ok | 10.2 | Transition to OK
[root@linux ~]# ipmitool sdr type ‘Power Supply’
Sensor Type "‘Power" not found.
Sensor Types:
Temperature (0x01) Voltage (0x02)
Current (0x03) Fan (0x04)
Physical Security (0x05) Platform Security (0x06)
Processor (0x07) Power Supply (0x08)
Power Unit (0x09) Cooling Device (0x0a)
Other (0x0b) Memory (0x0c)
Drive Slot / Bay (0x0d) POST Memory Resize (0x0e)
System Firmwares (0x0f) Event Logging Disabled (0x10)
Watchdog1 (0x11) System Event (0x12)
Critical Interrupt (0x13) Button (0x14)
Module / Board (0x15) Microcontroller (0x16)
Add-in Card (0x17) Chassis (0x18)
Chip Set (0x19) Other FRU (0x1a)
Cable / Interconnect (0x1b) Terminator (0x1c)
System Boot Initiated (0x1d) Boot Error (0x1e)
OS Boot (0x1f) OS Critical Stop (0x20)
Slot / Connector (0x21) System ACPI Power State (0x22)
Watchdog2 (0x23) Platform Alert (0x24)
Entity Presence (0x25) Monitor ASIC (0x26)
LAN (0x27) Management Subsys Health (0x28)
Battery (0x29) Session Audit (0x2a)
Version Change (0x2b) FRU State (0x2c)
12. Using System Chassis to initiate power on / off / reset / soft shutdown
!!!!! Beware only run this if you know what you're realling doing don't just paste into a production system, If you do so it is your responsibility !!!!!
– do a soft-shutdown via acpi
ipmitool [chassis] power soft
– issue a hard power off, wait 1s, power on
ipmitool [chassis] power cycle
– run a hard power off
ipmitool [chassis] power off
– do a hard power on
ipmitool [chassis] power on
– issue a hard reset
ipmitool [chassis] power reset
– Get system power status
ipmitool chassis power status
13. Use IPMI (SoL) Serial over Lan to execute commands remotely
Besides using ipmitool locally on server that had its IPMI / ILO / DRAC console disabled it could be used also to query and make server do stuff remotely.
If not loaded you will have to load lanplus kernel module.
modprobe lanplus
ipmitool -I lanplus -H 192.168.99.1 -U user -P pass chassis power status
ipmitool -I lanplus -H 192.168.98.1 -U user -P pass chassis power status
ipmitool -I lanplus -H 192.168.98.1 -U user -P pass chassis power reset
ipmitool -I lanplus -H 192.168.98.1 -U user -P pass chassis power reset
ipmitool -I lanplus -H 192.168.98.1 -U user -P pass password sol activate
– Deactivating Sol server capabilities
ipmitool -I lanplus -H 192.168.99.1 -U user -P pass sol deactivate
14. Modify boot device order on next boot
!!!!! Do not run this except you want to really modify Boot device order, carelessly copy pasting could leave your server unbootable on next boot !!!!!
– Set first boot device to be as BIOS
ipmitool chassis bootdev bios
– Set first boot device to be CD Drive
ipmitool chassis bootdev cdrom
– Set first boot device to be via Network Boot PXE protocol
ipmitool chassis bootdev pxe
15. Using ipmitool shell
root@iqtestfb:~# ipmitool shell
ipmitool> help
Commands:
raw Send a RAW IPMI request and print response
i2c Send an I2C Master Write-Read command and print response
spd Print SPD info from remote I2C device
lan Configure LAN Channels
chassis Get chassis status and set power state
power Shortcut to chassis power commands
event Send pre-defined events to MC
mc Management Controller status and global enables
sdr Print Sensor Data Repository entries and readings
sensor Print detailed sensor information
fru Print built-in FRU and scan SDR for FRU locators
gendev Read/Write Device associated with Generic Device locators sdr
sel Print System Event Log (SEL)
pef Configure Platform Event Filtering (PEF)
sol Configure and connect IPMIv2.0 Serial-over-LAN
tsol Configure and connect with Tyan IPMIv1.5 Serial-over-LAN
isol Configure IPMIv1.5 Serial-over-LAN
user Configure Management Controller users
channel Configure Management Controller channels
session Print session information
dcmi Data Center Management Interface
sunoem OEM Commands for Sun servers
kontronoem OEM Commands for Kontron devices
picmg Run a PICMG/ATCA extended cmd
fwum Update IPMC using Kontron OEM Firmware Update Manager
firewall Configure Firmware Firewall
delloem OEM Commands for Dell systems
shell Launch interactive IPMI shell
exec Run list of commands from file
set Set runtime variable for shell and exec
hpm Update HPM components using PICMG HPM.1 file
ekanalyzer run FRU-Ekeying analyzer using FRU files
ime Update Intel Manageability Engine Firmware
ipmitool>
16. Changing BMC / DRAC time setting
# ipmitool -H XXX.XXX.XXX.XXX -U root -P pass sel time set "01/21/2011 16:20:44"
17. Loading script of IPMI commands
# ipmitool exec /path-to-script/script-with-instructions.txt
Closure
As you saw ipmitool can be used to do plenty of cool things both locally or remotely on a server that had IPMI server interface available. The tool is mega useful in case if ILO console gets hanged as it can be used to reset it.
I explained shortly what is Intelligent Platform Management Interface, how it can be accessed and used on Linux via ipmitool. I went through some of its basic use, how it can be used to print the configured ILO access IP how
this Admin IP and Network configuration can be changed, how to print the IPMI existing users and how to add new Admin and non-privileged users.
Then I've shown how a system hardware and firmware could be shown, how IPMI management BMC could be reset in case if it hanging and how hardware system even logs can be printed (useful in case of hardware failure errors etc.), how to print reports on current system fan / power supply and temperature. Finally explained how server chassis could be used for soft and cold server reboots locally or via SoL (Serial Over Lan) and how boot order of system could be modified.
ipmitool is a great tool to further automate different sysadmin tasks with shell scrpts for stuff such as tracking servers for a failing hardware and auto-reboot of inacessible failed servers to guarantee Higher Level of availability.
Hope you enjoyed artcle .. It wll be interested to hear of any other known ipmitool scripts or use, if you know such please share it.


Report haproxy node switch script useful for Zabbix or other monitoring
Tuesday, June 9th, 2020For those who administer corosync clustered haproxy and needs to build monitoring in case if the main configured Haproxy node in the cluster is changed, I've developed a small script to be integrated with zabbix-agent installed to report to a central zabbix server via a zabbix proxy.
The script is very simple it assumed DC1 variable is the default used haproxy node and DC2 and DC3 are 2 backup nodes. The script is made to use crm_mon which is not installed by default on each server by default so if you'll be using it you'll have to install it first, but anyways the script can easily be adapted to use pcs cmd instead.
Below is the bash shell script:
To configure it with zabbix monitoring it can be configured via UserParameterScript.
The way I configured it in Zabbix is as so:
1. Create the userpameter_active_node.conf
Below script is 3 nodes Haproxy cluster
Once pasted to save the file press CTRL + D
The version of the script with 2 nodes slightly improved is like so:
The haproxy_active_DC_zabbix.sh script with a bit of more comments as explanations is available here
2. Configure access for /usr/sbin/crm_mon for zabbix user in sudoers
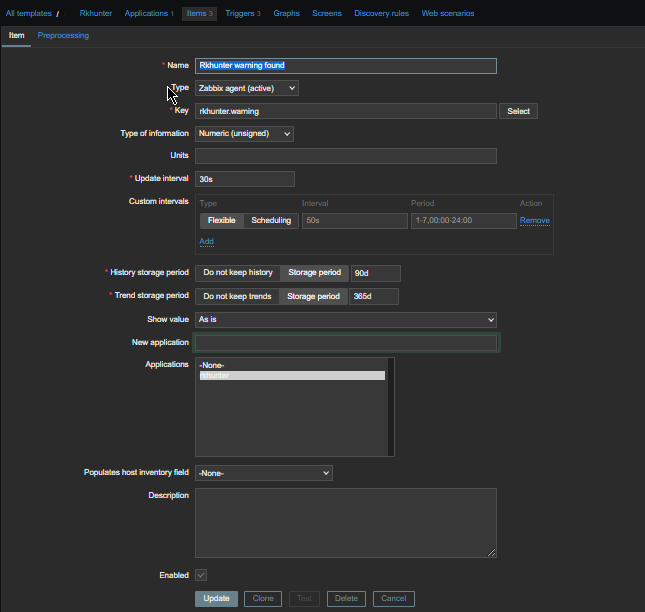
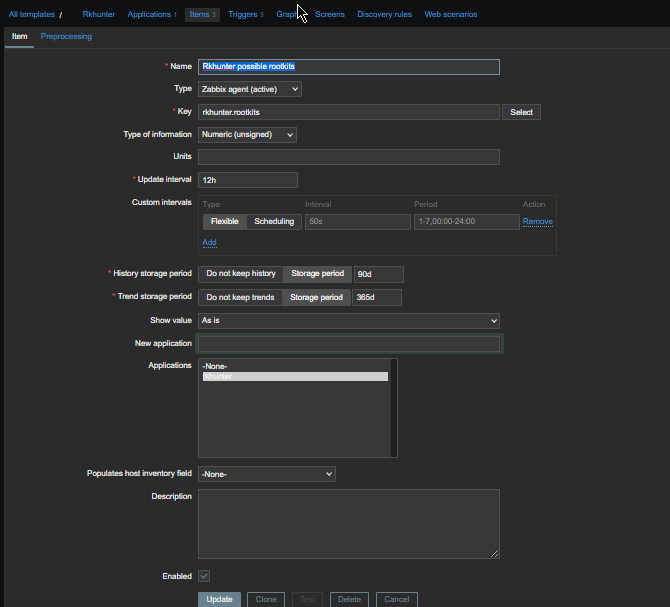
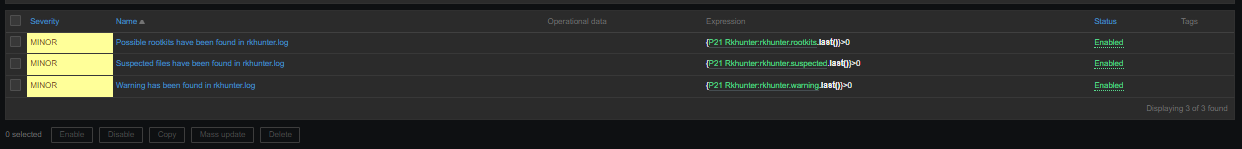
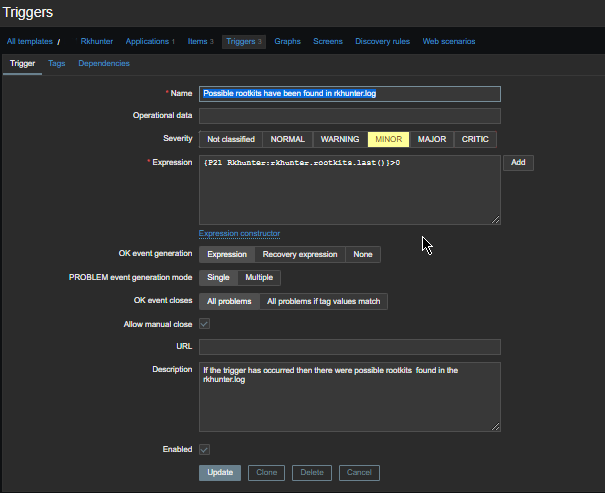
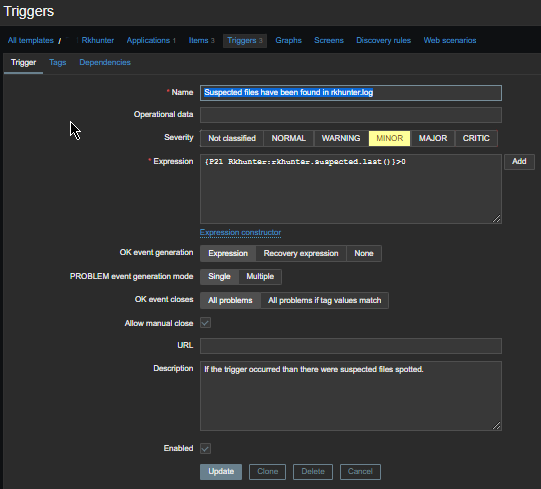
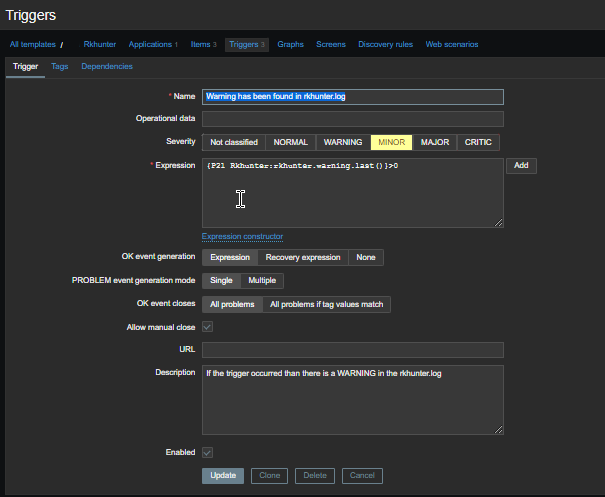
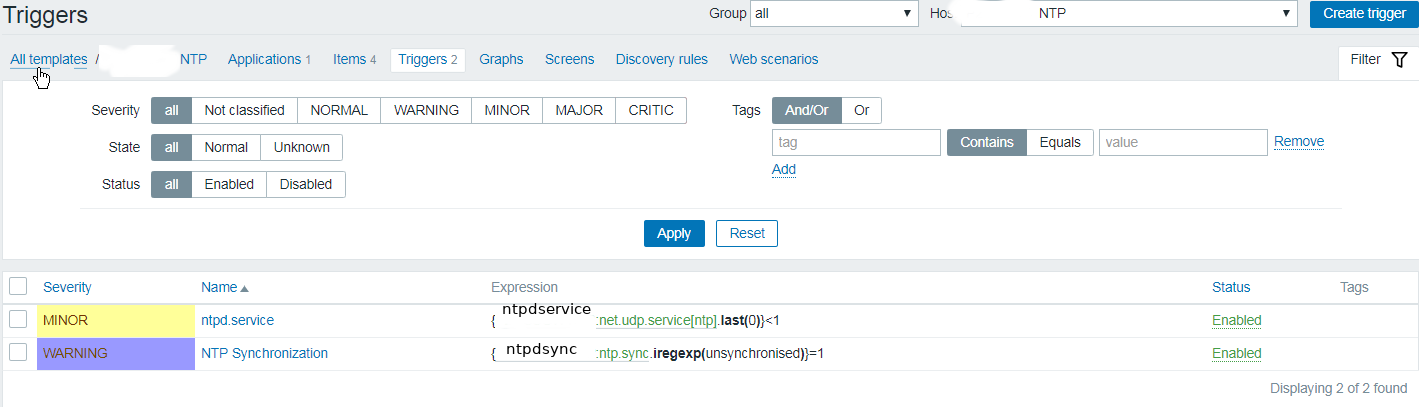
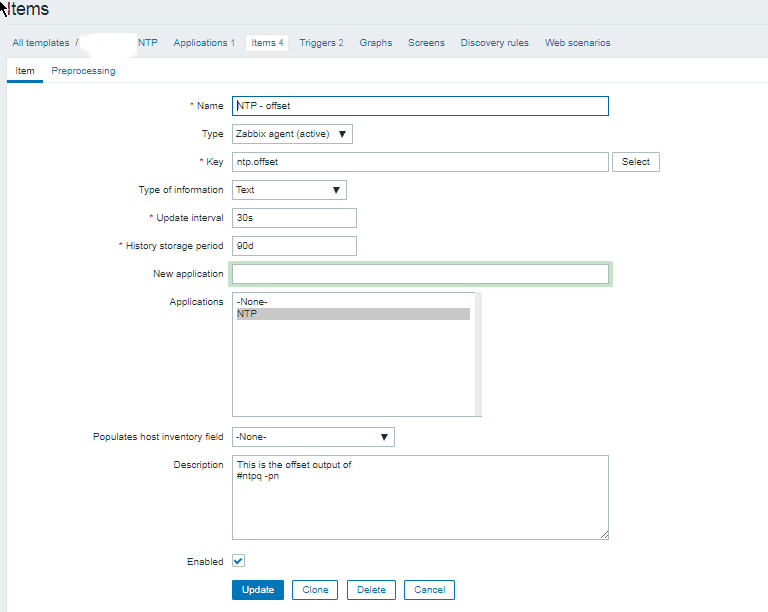
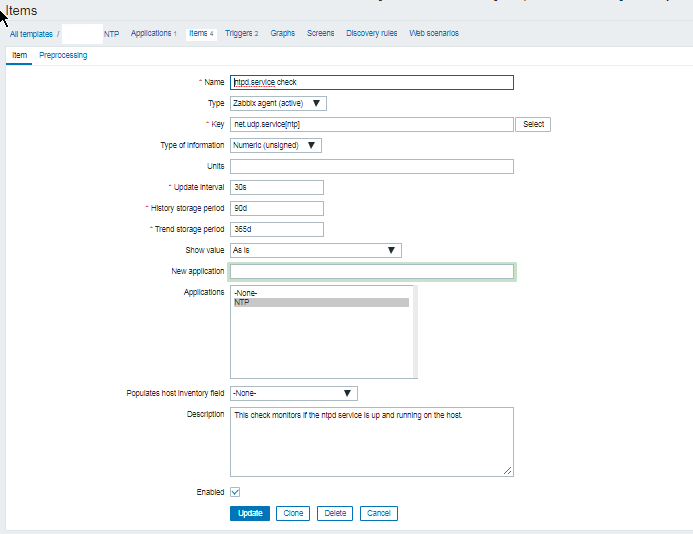
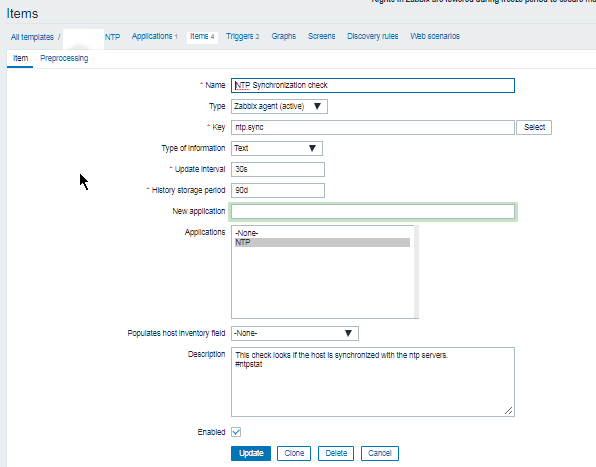
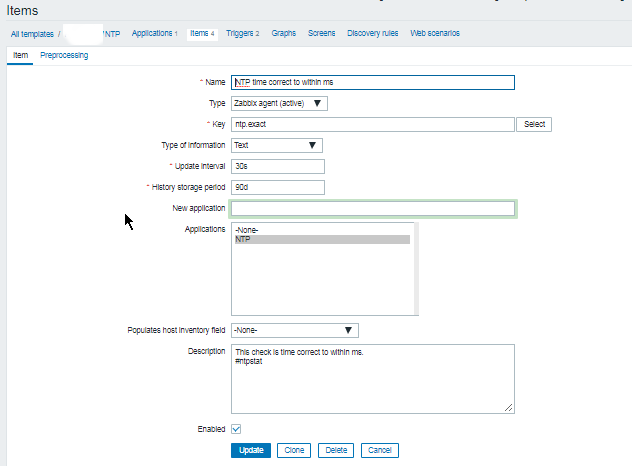
3. Configure in Zabbix for active.dc key Trigger and Item
Tags: access, ALL, and, Anyways, are, available, awk, bash shell, bash shell script, Below, bit, case, cat, Central, check, Cluster, cmd, Comments, conf, configure
Posted in Linux, Monitoring, Zabbix | No Comments »