Archive for February, 2015

Create SSH Tunnel to MySQL server to access remote filtered MySQL port 3306 host through localhost port 3308

Friday, February 27th, 2015

create_ssh_tunnel_to-mysql_server-to-access-remote-filtered-mysql-on-port-3306-secure_ssh_traffic
On our Debian / CentOS / Ubuntu Linux and Windows servers we're running multiple MySQL servers and our customers sometimes need to access this servers.
This is usually problem because MySQL Db  servers are running in a DMZ Zone with a strong firewall and besides that for security reasons SQLs are configured to only listen for connections coming from localhost, I mean in config files across our Debian Linux servers and CentOS / RHEL Linux machines the /etc/mysql/my.cnf and /etc/my.cnf the setting for bind-address is 127.0.0.1:
 

[root@centos ~]# grep -i bind-address /etc/my.cnf 
bind-address            = 127.0.0.1
##bind-address  = 0.0.0.0


For source code developers which are accessing development SQL servers only through a VPN secured DMZ Network there are few MySQL servers witha allowed access remotely from all hosts, e.g. on those I have configured:
 

[root@ubuntu-dev ~]# grep -i bind-address /etc/my.cnf 

bind-address  = 0.0.0.0


However though clients insisted to have remote access to their MySQL Databases but since this is pretty unsecure, we decided not to configure MySQLs to listen to all available IP addresses / network interfaces. 
MySQl acess is allowed only through PhpMyAdmin accessible via Cleint's Web interface which on some servers is CPanel  and on other Kloxo (This is open source CPanel like very nice webhosting platform).

For some stubborn clients which wanted to have a mysql CLI and MySQL Desktop clients access to be able to easily analyze their databases with Desktop clients such as MySQL WorkBench there is a "hackers" like work around to create and use a MySQL Tunnel to SQL server from their local Windows PCs using standard OpenSSH Linux Client from Cygwin,  MobaXterm which already comes with the SSH client pre-installed and has easy GUI interface to create SSH tunnels or eventually use Putty's Plink (Command Line Interface) to create the tunnel

Anyways the preferred and recommended (easiest) way to achieve a tunnel between MySQL and local PC (nomatter whether Windows or Linux client system) is to use standard ssh client and below command:
 

ssh -o ServerAliveInterval=10 -M -T -M -N -L 3308:localhost:3306 your-server.your-domain.com


By default SSH tunnel will keep opened for 3 minutes and if not used it will automatically close to get around this issue, you might want to raise it to (lets say 15 minutes). To do so in home directory user has to add in:
 

~/.ssh/config

ServerAliveInterval 15
ServerAliveCountMax 4


Note that sometimes it is possible ven though ssh tunnel timeout value is raised to not take affect if there is some NAT (Network Adress Translation) with low timeout setting on a firewall level. If you face constant SSH Tunnel timeouts you can use below bash few lines code to auto-respawn SSH tunnel connection (for Windows users use MobaXterm or install in advance bash shell cygwin package):
 

while true
do
 
ssh -o ServerAliveInterval=10 -M -T -M -N -L 3308:localhost:3306 your-server.your-domain.com
  sleep 15
done


Below is MySQLBench screenshot connected through server where this blog is located after establishing ssh tunnel to remote mysql server on port 3308 on localhost

mysql-workbench-database-analysis-and-management-gui-tool-convenient-for-data-migratin-and-queries-screenshot-

There is also another alternative way to access remote firewall filtered mysql servers without running complex commands to Run a tunnel which we recommend for clients (sql developers / sql designers) by using HeidiSQL (which is a useful tool for webdevelopers who has to deal with MySQL and MSSQL hosted Dbs).

heidisql-show-host_processlist-screenshot

To connect to remote MySQL server through a Tunnel using Heidi:

mysql_connection_configuration-heidi-mysql-gui-connect-tool


In the ‘Settings’ tab

1. In the dropdown list of ‘Network type’, please select SSH tunnel

2. Hostname/IP: localhost (even you are connecting remotely)

3. Username & Password: your mysql user and password

Next, in the tab SSH Tunnel:

1. specify plink.exe or you need to download it and specify where it’s located

2. Host + port: the remote IP of your SSH server(should be MySQL server as well), port 22 if you don’t change anything

3. Username & password: SSH username (not MySQL user)


heidi-connection_ssh_tunnel_configuration-heidi-sql-tool-screenshot
 

Howto install XCache Debian on GNU / Linux to accelerate Apache Webserver – XCache Best alternative to outdated PHP cacher EAccelerator

Thursday, February 26th, 2015

xcache_install-and-enable-best-alternative-php-cacher-to-eaccelerator-logo
I was using Eaccelerator until recently on all Apache / PHP / MySQL  (LAMP) web-servers as a caching engine (Webserver accelerator) across all Debian GNU / Linux Lenny / Squeeze / Etch servers.
However recently, I've noticed in phpinfo output on some of the Debian hosts, that eaccelerator was loaded but showed:

 Caching Enabled false

eaccelerator_caching_enabled_false-phpinfo-screenshot-apache-debian-linux.


Our servers are quite busy serving about 50 000 to 100 000 requests and thus not having enabled caching puts a lot of extra load on the CPU and eats a lot of memory which were usually saved by eAccelerator.
Logically I tried fixing the issues following some Stackoverflow threads recommendations such as this one but didn't work I tried playing manually spending hours trying to make eaccelerator run again and as a final mean, I even tried to upgrade eaccelerator to newer version but noticed the latest available eaccelerator version 0.9.6 was 2.5 years old (from 03.09.2012). Thus while there is no new release, just make s so just to make sure I didn't break the module with (default Debian bundled distribution package which is also installed on the servers)  re-installed eAccelerator from source 

This didn't worked either and since I was totally pissed off by the worsened systems performance (CPU load increased with to 10-30%) per server, I looked for some alternatives I can use and in the mean time I learned a bit more about history of PHP Accelerators, I learned some interesting things such as that  ionCube (PHPA) was the  first PHP Accelerator Apache like module (encoding PHP code),  created in 2001, later it become inspirational for  birth to PHP-APC (Alternative PHP Cache) Apache module. 
There is also Zend Opcache PHP accelerator (available since PHP 5.5 onwards)  but since Zend OpCache caches well PHP Zend written PHP code and servers run PHP 5.4 + sites are not using Zend PHP Framewosk  this was an option.
Further investigation lead me to MMCache which is already too obsolete (latest release is from 2013), PHPExpress – PHP Encoder which  was said to run on Windows, Linux, FreeBSD, NetBSD, Mac OS X, and Solaris) but already looks dead as there were no new releases since January 2012) and finally Lighttpd's XCache.

To give you an idea on what exactly is the difference between Apache Webserver with PHP-APC Caching or other PHP Cacher enabled and the Standard way PHP Interprets PHP scripts below is a diagram:

php-apc-cache-how-php-caching-works-with-and-without-encoding-php-code-diagram

Obviously my short research shows that from all the available PHP Cache Encoder / Accelerators only ones that seemed to be recently updated (under active development) are APC and XCache.
I've already used PHP-APC earlier on some servers and was having having some random Apache Webservers crashes and weird empty pages with some PHP pages and besides that APC is known to give lower speed in PHP caching than Eaccelerator and XCache, leaving me with the only and logical choise to use XCACHE.

Here is how Xcache developers describe their opcacher:
 

XCache is a free, open source operation code cacher, it is designed to enhance the performance of PHP scripts execution on servers. It optimizes the performance by eliminating the compilation time of PHP code by caching the compiled version of code into the memory and this way the compiled version loads the PHP script directly from the memory. This will surety accelerate the page generation time by up to 5 times faster and also optimizes and increases many other aspects of php scripts and reduce website/server load.


Thanksfully XCache is shipped by default with all Debians (Etch /Lenny / Squeeze / Wheezy)  Linuces so to install it just run the standard apt cmd:
 

apt-get install –yes php5-xcache


Then to enable XCache all I had to do is edit /etc/php5/apache2/php.ini and place below code
 

debian-server:~# vim /etc/php5/apache2/php.ini


[xcache-common]
;; install as zend extension (recommended), normally "$extension_dir/xcache.so"
;;zend_extension = /usr/lib/php5/20100525/xcache.so


[xcache.admin]
xcache.admin.enable_auth = On
; Configure this to use admin pages
; xcache.admin.user = "mOo"
; xcache.admin.pass = md5($your_password)
; xcache.admin.pass = ""

[xcache]
; ini only settings, all the values here is default unless explained

; select low level shm/allocator scheme implemenation
xcache.shm_scheme =        "mmap"
; to disable: xcache.size=0
; to enable : xcache.size=64M etc (any size > 0) and your system mmap allows
xcache.size  =                16M
; set to cpu count (cat /proc/cpuinfo |grep -c processor)
xcache.count =                 1
; just a hash hints, you can always store count(items) > slots
xcache.slots =                8K
; ttl of the cache item, 0=forever
xcache.ttl   =                 0
; interval of gc scanning expired items, 0=no scan, other values is in seconds
xcache.gc_interval =           0
; same as aboves but for variable cache

Note that Debian location which instructs xcache to load in Apache as a module is xcache.ini – e.g. /usr/share/php5/xcache/xcache.ini, so instead of placing above configuration right into php.ini you might prefer to place it in xcache.ini (though I personally prefer php.ini) because it is easier for me to later control how PHP behaves from single location.

To test whether XCache is enabled for Apache Webserver:

Create phpinfo.php somewhere in DocumentRoot (in my case this was /var/www/php_info.php)

debian-server:~# vim /var/www/php_info.php


<php?
phpinfo()
?>


When you access the php_info.php in browser you will get XCache loaded as in below screenshot:


xcache_loaded-in-php-apache-phpinfo-output-debian-gnu-linux-server

To Test whether Xcache is enabled also for PHP CLI (applications set to run as a crontab – cronjob) :
 

debian-server:~# php -v
PHP 5.4.37-1~dotdeb.0 (cli) (built: Feb  2 2015 05:03:00)
Copyright (c) 1997-2014 The PHP Group
Zend Engine v2.4.0, Copyright (c) 1998-2014 Zend Technologies
    with XCache v3.2.0, Copyright (c) 2005-2014, by mOo
    with XCache Cacher v3.2.0, Copyright (c) 2005-2014, by mOo


Once it is tested as successful install you might want to enable the XCache admin (which is disabled by default), to enable XCache Admin on Debian you need to generate new password for it first like so:


echo -n "xcache_rulez" | md5sum
acbf5ba4a44f03058aa0ad11e0a6b645


Then you need to add in /etc/php5/mods-available/xcache.ini

debian-server:~# vim /etc/php5/mods-available/xcache.ini
[xcache.admin]
xcache.admin.enable_auth = On
; Configure this to use admin pages
 xcache.admin.user = "admin"
; xcache.admin.pass = md5($your_password)
 xcache.admin.pass = "change_with_above_generated_password_here"


To enable admin and be able to access it in a browser (if you're using as a documentroot /var/www/ and docroot supports interpretting php scripts and (has AllowOverride All) enabled to also support htaccess authentication do:
 

debian-server:~# cd /var/www/
debian-server:~# ln -sf /usr/share/xcache/htdocs/ xcache

When you access http://your-url-address.com/xcache/ you should see in browser some statistics along with all configured xcache options:

xcacher-admin-on-debian-gnu-linux-in-chrome-browser-screenshot-enable-xcacher-admin-howto

If you have time you can play with the options and get some speed minor speed improvements. The overall increase in page opening XCache should give you is between 100% – 190% !

Enjoy 🙂

Microsoft Windows most secure OS for 2014 ? – Short OS and Application Security report for 2014

Tuesday, February 24th, 2015

windows-more-secure-OS-for-2014-than-Linux-and-Mac-OSX-and-iOS-operating-systems-short-security-report-2014

It is shocking news for me and probably to many that according to security specialists at National Vulnerability Database, at present moment for year 2014 Windows looks like more secure than both Apple's (iOS and Mac OS X) as well as to Linux.

Windows has been  bullied for its bad OS design and easier to breach Security compared to Linux, there was a constant hype also of Mac OS users claiming the invulnerability of their BSD based OS, but it seems security breach statistics given by  National Vulnerability Database security breach evaluation reports tell us security issues for 2014 Windows OSes while compared to other OS vulnerabilities in different operating systems such as Linux.

statistics-of-Operating-System-security-issues-vulnerabilities-for-2014-windows-most-secure-OS-2014-source-national-vulnerability-database
I will have to disappoint Apple Mac fans but in 2014 Mac OS X was found to be riddled with the greatest number of security problems147 in total, including 64 rated as high severity, and 67 as medium.

iOS's security was also ranked poor with 127 vulnerabilities including 32 high and 72 with a medium rating.

For comparison the latest Windows 8.1 had only 36 vulnerabilities, and its predecessors — Windows 8 and 7 — both had same number.
In Enterprise World (users) Windows Server 2007 and 2008 both have 38 vulnerabilities. Reported vulnerabilities were mainly of middle and high severity.

high-severity-vulnerabilities-graph-of-operating-systems-year-2014

Overall statistics also show there has been a huge increase in the number security vulnerabilities in the NVD security reports database.
In 2013 the number of all logged vulnerabilities were 4,794 while this jumped to 7,038 in y. 2014. The good news is lower percentage of all logged in security issues were rated of critical security importance.
It is mostly third party software not part of OS which contain security issues, 83% of all reported vulnerabilities were laying in 3rd party applications, only 13% percantage were OS specific and 4% hardware related.
Though overall statistics shows Microsoft products more secure than Apple Inc. Products and (Open Source) Linux, though still M$ Internet Explorer is the most insecure web browser, for 2014,  Internet Explorer had  242 vulnerabilities while Google Chrome had 124 security issues and the most secure browser rated for 2014 is (surprising for me) Mozilla Firefox.
It is important to say such statistics are not completely relevant because, for example you can rarely see a Linux desktop user infected with Malware but almost everyone around using Windows OS is malware infected, same goes for Mac OS users, there are plenty of vulnerabilities for Mac but overall security of Mac OS is better as I haven't still met Mac OS users with Viruses and Spyware but I fixed about (30!!) of Microsoft PCs and notebooks infected with various Viruses and badware throughout 2014. Also it should be considered that many securitty bugs are kept secret and actively exploited for a long time by blackhats like it happened recently with Heartbleed and ShellShock vulnerabilities
For those interested, below is a list of top vulnerable applications for 2014

security-issues-vulnerability-report-2012-2013-2014_graph_windows-most-secure-operating-system-for-2014

Windows how to check which process locks file command – A M$ Windows equivalent of lsof command

Monday, February 23rd, 2015

windows-how-to-check-which-process-locks-file-command-a-ms-windows-equivalent-of-lsof-command

I've had a task today to deploy a new WAR (Web Application Archive) Tomcat file on Apache Tomcat server running  on Windows server 2008 R2 UAT environment.
The client Tomcat application within war is providing a frontend to an proprietary Risk Analysis application called Risiko Management (developed by a German vendor called Schleupen).
The update of WAR file was part of a version upgrade of application so, both "Risk Analysis" desktop standalone server RiskKit and the Web frontend was developed by Schleupen had to be updated.
In order to update I followed the usual .WAR Tomcat Javafile upadate Tomcat process.

1. Stopped Tomcat running service Instance via services.msc command e.g.
 

Start (menu) -> Run
 

services.msc


stopping-tomcat-application-howto-stop-service-ms-windows-screenshot


2. Move (by Renaming) old risk-analysis.war to risk-analysis_backup_2015.war

and also rename the automatically Tomcat extracted folder (named same name as the WAR archive file directory – D:\web\Apache-Tomcat-7.0.33\webapps\Risiko-Analysis\ to :\web\Apache-Tomcat-7.0.33\webapps\Risiko-Analysis_backup_2015, i.e. run:
 

C:\Users\risk-analysis> D:
D:\>
D:\> CD \Web\Apache-Tomcat-7.0.33\webapps\

D:\Web\Apache-Tomcat-7.0.33\webapps> move risk-analysis.war risk-analysis_2015.war
D:\Web\Apache-Tomcat-7.0.33\webapps> move  
Risiko-Analysis\  Risiko-Analysis_backup_2015\


But unfortunately I couldn't rename it and I got below error:

move-windows-command-access-is-denied-tiny-screenshot

Also I tried copying it using Windows Explorer Copy / Paste but this didn't worked either, and I got below error :

cant-move-risk-analysis-tomcat-java-application-error-ms-windows-screenshot

3. Finding what Locks a directory or File on M$ Windows


Obviously, the reason for unable to copy the directory was something was locking it. Actually there are plenty of locked files many running applications like Explorer do. A good example for all time locked file is Windows (swap file) pagefile.sys – this is Windows Linux equivalent of swap filesystem (enabled / disabled with spapon / swapoff commands)

Having the directory locked was a strange problem, because the Tomcat process was not running as I checked closely both in Windows taskmgr GUI interface and manually grepped for the process with tasklist command like so:


d:\>tasklist /m|find /i "tomcat"


tomcat7.exe                   4396 ntdll.dll, kernel32.dll, KERNELBASE.dll,

For people like me who use primary Linux , above command shows you very precious debugging information, it shows which Windows libraries (DLL) are loaded in memory and used by the process 


(Note that when Tomcat is running, it is visible with command)
 

D:\> wmic.exe process list brief | find /i "tomcat"
526          tomcat7.exe          8         4396       49           156569600


Just for those wondering the 156569600 number is number of bytes loaded in Windows memory used by Tomcat.

After tomcat was stopped above command returned empty string meaning obviously that tomcat is stopped ..

BTW, wmic command is very useful to get a list of process names (to list all running processes):

 D:> wmic.exe process list brief

get-all-process-names-in-command-line-with-windows-wmic-command-screenshot

Well obviously something was locking this directory (some of its subdirectories or a file name within the directory / folder), so I couldn't rename it just like that.
In Linux finding which daemon (service) is locking a file is pretty easy with lsof command (for those new to lsof check my previous article how to how to check what process listens on network port in Linux), however it was unknown to me how I can check which running service is locking a file and did a quick google search which pointed me to the famous handle part of SysInternals tools.
The command tool Handle.exe was exactly what I was looking for. 

handle-sysinternals-tool-to-windows-see-all-locked-files-and-what-is-locking-them-ms-windows-screenshot

To get list of all opened (locked) files and see which application has opened it just exec command without arguments, you will get
plenty of useful info which will help you to better understand what Windows OS is doing invisible in the background and what app uses what.

handle-command-part-of-sysinternals-witout-any-arguments-display-opened-locked-files-in-windows

handle is pretty much Windows equivalent command of Linux lsof

To get which file was locked by Tomcat I used handle in conjuntion with find /i command which is pretty much like Linux's grep equivalent


C:\TEMP> Handle.exe | FIND /I "Tomcat"
   1C: File  (RW-)   D:\Web\Apache-Tomcat-7.0.33\webapps\Risk-Analysis\images\app


Alternatively if you have sysinternals and prefer GUI environment you can use SysInternals Process Explorer (press CTRL + F) and look for a string:

process-explorer-toolbar-find-what-is-locking-a-file-or-directory-windows

Next to handle I found also another GUI program (Internet Explorer extension) WhoLockMe, that can be used to show you all running programs and locked files by this programs.
WhoLockMe is pretty straight forward to use, though it shows GUI output you have to run the command from cmd line. Below is sample output screenshot of wholockme.


who-lock-me-windows-screenshot-see-which-files-running-programs-are-locking-on-ms-windows


To Install Wholockme 


Unzip "WhoLockMe.zip" in a directory (for exemple : "C:\Program Files\WhoLockMe")
Launch "Install.bat" or execute this Windows registry modification command :
 

regsvr32 "C:\Program Files\WhoLockMe\WhoLockMe.dll"


To Uninstall WhoLockMe – if you need to later:


Execute command :
 

regsvr32 /u "C:\Program Files\WhoLockMe\WhoLockMe.dll"


Reboot (Or Kill Explorer.exe).

Removes the "C:\Program Files\WhoLockMe" directory and its contents.

Probably there are other ways to find out what is locking a file or direcotry using powershell scripts or .bat (batch) scripting. If you know of other way using default Windows embedded commands, please share in comments.


Remove URL from comments in WordPress Blogs and Websites to mitigate comment spam URLs in pages

Friday, February 20th, 2015

remove-comment-spam-url-field-wordpress-website-or-blog-working-how-to
If you're running a WordPress blog or Website where you have enabled comments for a page and your article or page is well indexing in Google (receives a lot of visit / reads ) daily, your site posts (comments) section is surely to quickly fill in with a lot of "Thank you" and non-sense Spam comments containing an ugly link to an external SPAM or Phishing website.

Such URL links with non-sense message is a favourite way for SPAMmers to raise their website incoming (other website) "InLinks" and through that increase current Search Engine position. 

We all know a lot of comments SPAM is generally handled well by Akismet but unfortunately still many of such spam comments fail to be identified as Spam  because spam Bots (text-generator algorithms) becomes more and more sophisticated with time, also you can never stop paid a real-persons Marketers to spam you with a smart crafted messages to increase their site's SEO ).
In all those cases Akismet WP (Anti-Spam) plugin – which btw is among the first "must have"  WP extensions to install on a new blog / website will be not enough ..

To fight with worsening SEO because of spam URLs and to keep your site's SEO better (having a lot of links pointing to reported spam sites will reduce your overall SEO Index Rate) many WordPress based bloggers, choose to not use default WordPress Comments capabilities – e.g. use exnternal commenting systems such as Disqus – (Web Community of Communities), IntenseDebate, LiveFyre, Vicomi

However as Disqus and other 3rd party commenting systems are proprietary software (you don't have access to comments data as comments are kept on proprietary platform and shown from there), I don't personally recommend (or use) those ones, yes Disqus, Google+, Facebook and other comment external sources can have a positive impact on your SEO but that's temporary event and on the long run I think it is more advantageous to have comments with yourself.
A small note for people using Disqos and Facebook as comment platforms – (just imagine if Disqos or Facebook bankrupts in future, where your comments will be? 🙂 )

So assuming that you're a novice blogger and I succeeded convincing you to stick to standard (embedded) WordPress Comment System once your site becomes famous you will start getting severe amount of comment spam. There is plenty of articles already written on how to remove URL comment form spam in WordPress but many of the guides online are old or obsolete so in this article I will do a short evaluation on few things I tried to remove comment spam and how I finally managed to disable URL link spam to appear on site.
 

1. Hide Comment Author Link (Hide-wp-comment-author-link)

This plugin is the best one I found and I started using it since yesterday, I warmly recommend this plugin because its very easy, Download, Unzip, Activate and there you're anything typed in URL field will no longer appear in Posts (note that the URL field will stay so if you want to keep track on person's input URL you can get still see it in Wp-Admin). I'm using default WordPress WRC (Kubrick), but I guess in most newer wordpress plugins is supposed to work. If you test it on another theme please drop a comment to inform whether works for you.  Hide Comment Author Link works on current latest Wordpress 4.1 websites.

A similar plugin to hide-wp-author-link that works and you can use is  Hide-n-Disable-comment-url-field, I tested this one but for some reason I couldn't make it work.

wordpress-remove-delete-hide-n-disable-url-comment-without-deleting-the-form-url-field-screenshot-reduce-comment-spam
Whatever I type in Website field in above form, this is wiped out of comment once submitted 🙂
 

2. Disable hide Comment URL (disable-hide-comment-url)

I've seen reports disable-hide-comment-url works on WordPress 3.9.1, but it didn't worked for me, also the plugin is old and seems no longer maintaned (its last update was 3.5 years ago), if it works for you please please drop in comment your WP version, on WP 4.1 it is not working.

disable-hide-comment-url-screenshot-plugin-to-disable-comment-url-spam-in-wordpress-sites


3. WordPress Anti-Spam plugin

WordPress Anti-Spam plugin is a very useful addition plugin to install next to Akismet. The plugin is great if you don't want to remove commenter URL to show in the post but want to cut a lot of the annoying Spam Robots crawling ur site.
 

Anti-spam plugin blocks spam in comments automatically, invisibly for users and for admins.

  • no captcha, because spam is not users' problem
  • no moderation queues, because spam is not administrators' problem
  • no options, because it is great to forget about spam completely

Plugin is easy to use: just install it and it just works.

Anti bot works fine on WP 4.1

4. Stop Spam Comments

Stop Spam Comments is:

  • Dead simple: no setup required, just activate it and enjoy your spam-free website.
  • Lightweight: no additional database queries, it doesn't add script files or other assets in your theme. This means your website performance will not be affected and your server will thank you.
  • Invisible by design: no captchas, no tricky questions or any other user interaction required at all.
     

Stop Spam Comments works fine on WP 4.1.

I've mentioned few of the plugins which can help you solve the problem, but as there are a lot of anti-spam URL plugins available for WP its up to you to test and see what fits you best. If you know or use some other method to protect yourself from Comment Url Spam to share it please.

Import thing to note is it usually a bad idea to mix up different anti-spam plugins so don't enable both Stop Spam Comments and WordPress Anti Spam plugin.

5. Comment Form Remove Url field Manually 

This (Liberian) South) African blog describes a way how to remove URL field URL manually

In short to Remove Url Comment Field manually either edit function.php (if you have Shell SSH access) or if not do it via Wp-Admin web interface:
 

WordPress admin page –> Appearance –> Editor


Paste at the end of file following PHP code:


add_filter('comment_form_default_fields', 'remove_url');
 function remove_url($fields)
 {
 if(isset($fields[‘url’]))
 unset($fields[‘url’]);
 return $fields;
 }


Now to make changes effect, Restart Apache / Nginx Webserver and clean any cache if you're using a plugin like W3 Total Cache plugin etc.

Other good posts describing some manual and embedded WordPress ways to reduce / stop comment spam is here and here, however as it comes to my blog, none of the described manual (code hack) ways I found worked on WordPress v. 4.1.
Thus I personally stuck to using Hide and Disable Comment URL plugin  to get rid of comment website URL.

WordPress Plugins to monitor and debug WP enabled plugins – Find Errors / Warnings and Remove WP problematic plugins slowing down your Website (blog) database

Thursday, February 19th, 2015

plugins-to-monitor-debug-wordpress-enabled-plugins-how-to-track-find-errors-and-warnings-and-remove-problematic-wp-extensions-that-slow-down-your-website

Recent days, I'm spending a lot of time again trying to optimize my wordpress blog. Optimizing WP for better efficiency is becoming harder and harder task day by day as the website file content data is growing along with SQL databases. Moreover situation gets even worse because the number of plugins enabled on my blog is incrementally growing with time because, there is more and more goodies I'd like to add.
Optimizing WordPress to run for Speed on a server is a whole a lot of art and its a small universe in itself, because as of time of writting this post the count (number) of WordPress available PLUGINS is 36,197 ! 

1. Manually Tracking WordPress  Plugins causing Slow SQL Queries (MySQL bottleneck) issues directly using console / SSH

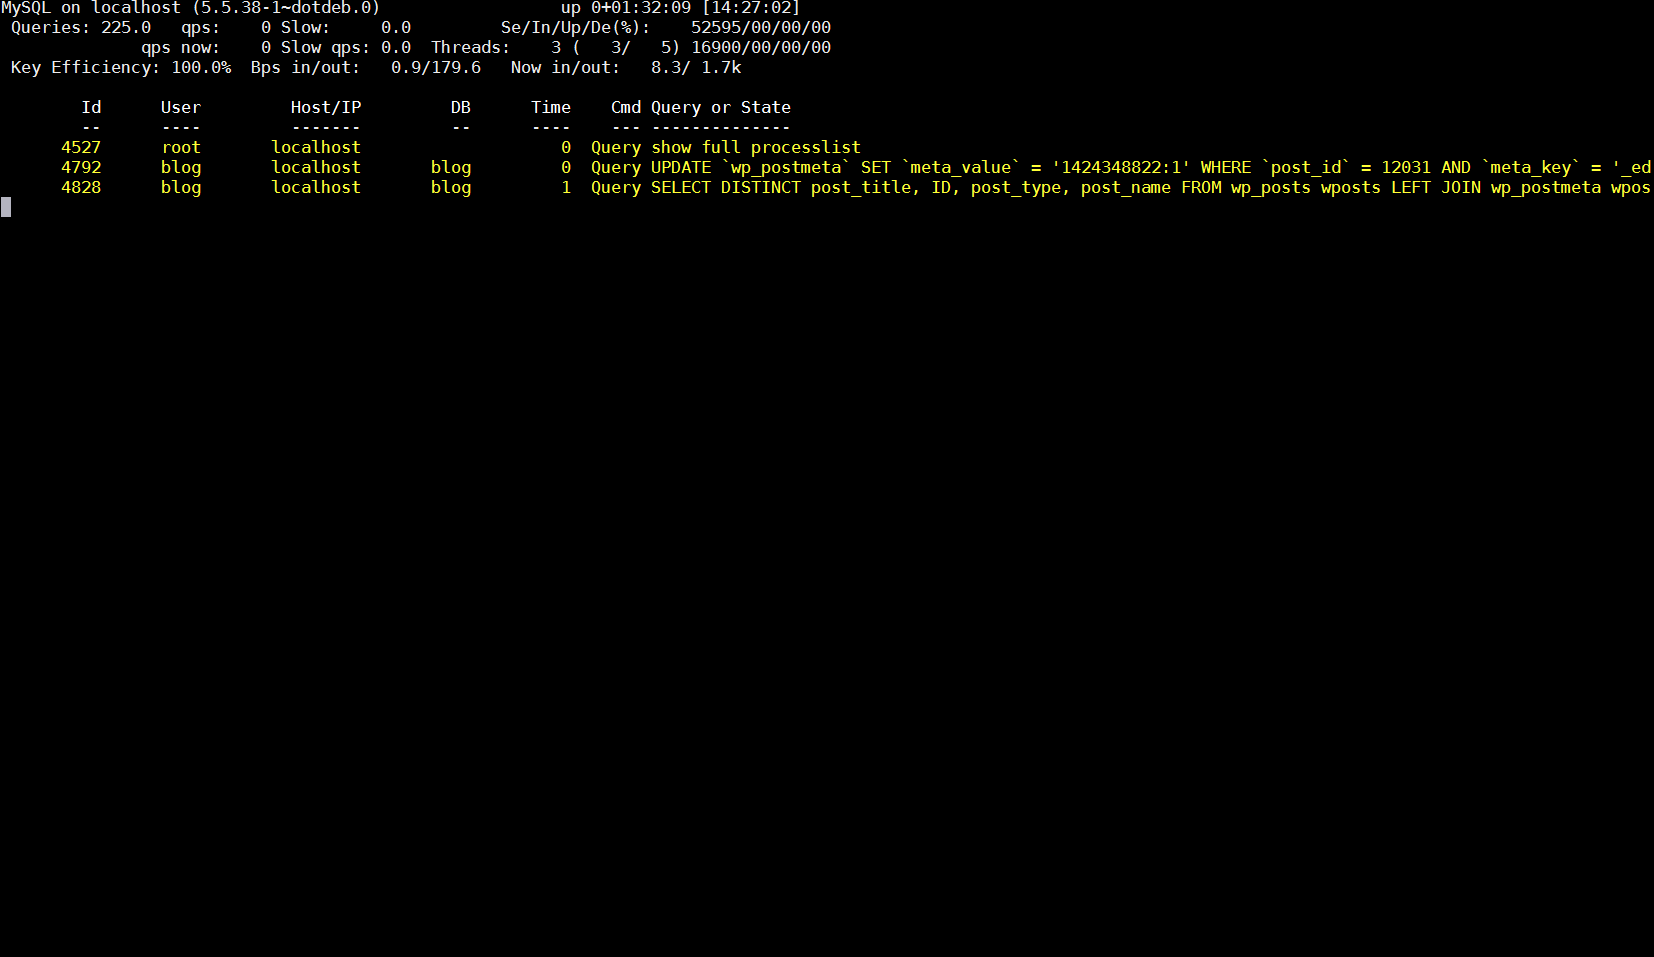
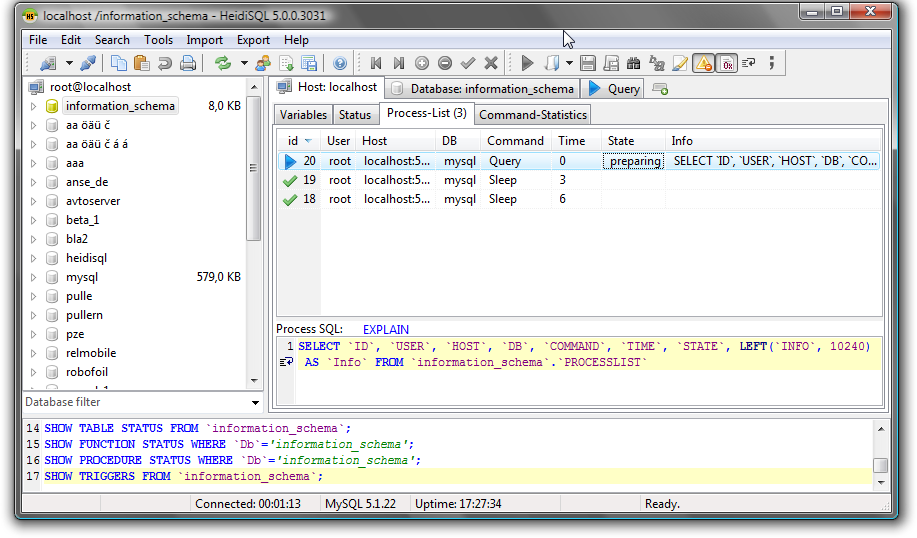
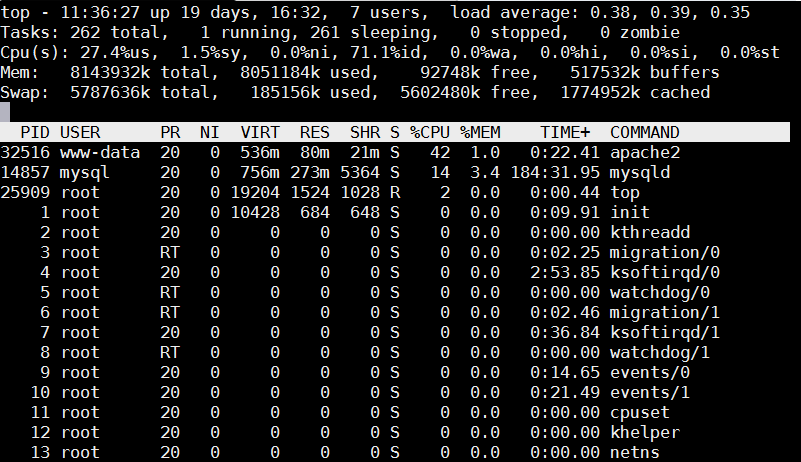
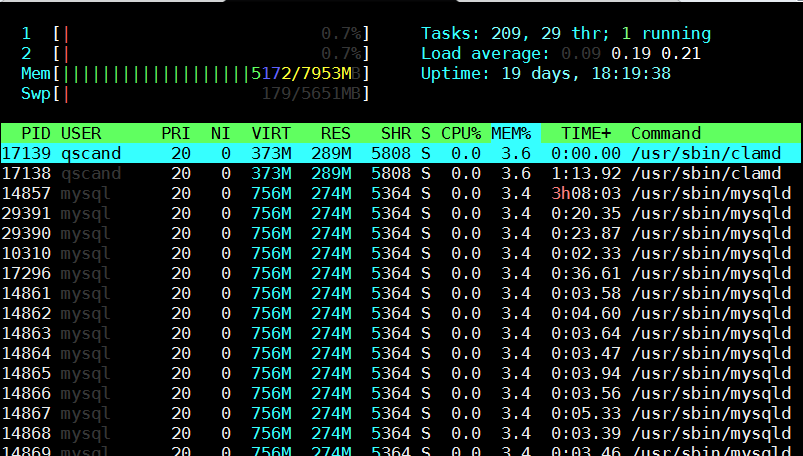
Because of its open source development and its nice modular design wordpress has turned into a standard for building small, middle sized and large websites (some WordPress based blogs and sites have from 50 000 to 100 000 unique pages!). My blog is still a small WordPress site with only 1676 posts, so I still haven't reached the high volume traffic optimization requirements but still even though I have a relatively good server hardware  8GB RAM / (2×2.70 Ghz Intel CPU) / 500 GB (7400 RPM HDD) at times I see Apache Webservers is unable to properly serve coming requests because of MySQL database (LEFT JOIN) requests being slow to serve (taking up to few seconds to complete) and creating a MySQL table lock, putting all the rest SQL queries to stay in a long unserved queues line, I've realized about this performance issue by using a a mysql cli (command) client and few commands and console command (tool) called mytop (also known as mtop). MyTop refreshes every 3 seconds, so the slow query will immediately stay on screen to view moer info about it press "f" and type the  in query ID.

mysql-top-running-on-gnu-linux-server-tracking-sql-queries-in-console-screenshot.png

mysql-top-running-on-gnu-linux-server-tracking-sql-queries-in-console-screenshot2

Finally it is very useful to run  for a while MySQL server logging to /var/log/mysql/slow-query.log:
Slow query is enabled (on my Debian 7 Wheezy host) by adding to /etc/mysql/my.cnf
after conf section


vim /etc/mysql/my.cnf
#
# * Logging and Replication
#
# Both location gets rotated by the cronjob.
# Be aware that this log type is a performance killer.
# As of 5.1 you can enable the log at runtime!
#general_log_file        = /var/log/mysql/mysql.log
#general_log             = 1
#
# Error logging goes to syslog due to /etc/mysql/conf.d/mysqld_safe_syslog.cnf.
#
# Here you can see queries with especially long duration


Paste:


slow_query_log = 1
slow_query_log_file = /var/log/mysql/slow-query.log
long_query_time = 2
log-queries-not-using-indexes


And then to make new mysql configuration load restarted mysql server:


debian-server:~# /etc/init.d/mysql restart
Stopping MySQL database server: mysqld.
Starting MySQL database server: mysqld ..
Checking for tables which need an upgrade, are corrupt or were
not closed cleanly..


Leaving mysql-slow.log to be enabled for 30 minutes to an 1 hrs is a good time to track most problematic slow queries and based on this queries, I took parts of  SQL UPDATE / SELECT / INSERT etc. Db queries which was problematic and grepped throughout /var/www/blog/wp-content/plugin files in order to determine which WordPress Plugin is triggering the slow query, causing blog to hang when too many clients try to see it in browser.

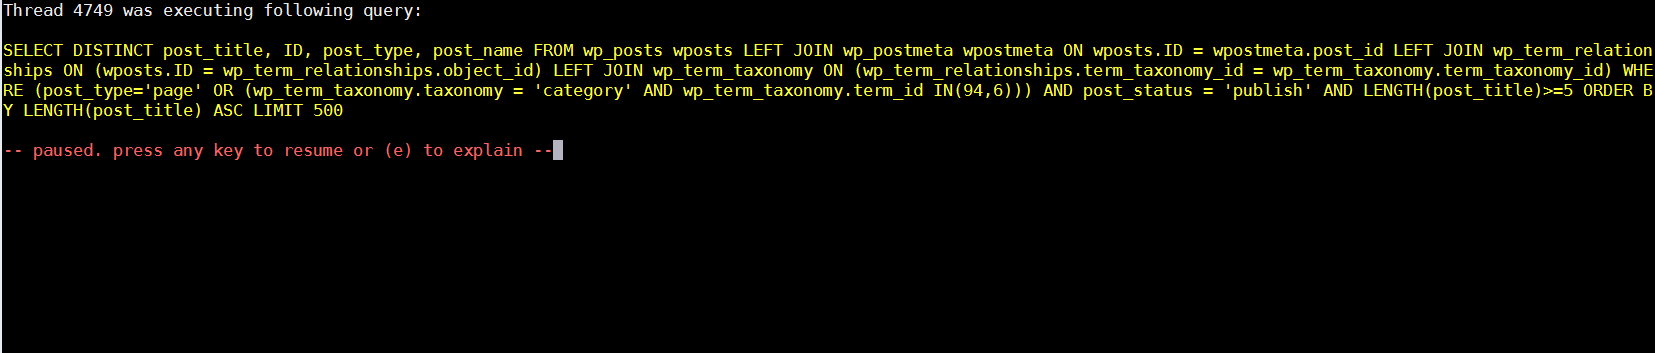
My main problematic SQL query having long execution time  (about 2 to 3 seconds!!!) most commonly occuring in slow-query.log was:


SELECT DISTINCT post_title, ID, post_type, post_name FROM wp_posts wposts LEFT JOIN wp_postmeta wpostmeta ON wposts.ID = wpostmeta.post_id LEFT JOIN wp_term_relationships ON (wposts.ID = wp_term_relationships.object_id) LEFT JOIN wp_term_taxonomy ON (wp_term_relationships.term_taxonomy_id = wp_term_taxonomy.term_taxonomy_id) WHERE (post_type='page' OR (wp_term_taxonomy.taxonomy = 'category' AND wp_term_taxonomy.term_id IN(11))) AND post_status = 'publish' AND LENGTH(post_title)>=5 ORDER BY LENGTH(post_title) ASC LIMIT 500

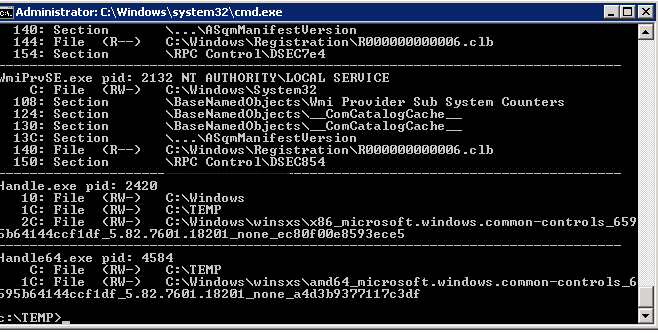
Because above query uses SQL Column names and Tables which are not hard coded in PHP code, to find out which plugins is most probably to launch this complex LEFT JOIN query, I used a quick bash one-liner:


# cd /var/www/blog/wp-content/plugins


# for i in $(grep -rli 'SELECT DISTINCT' *); do grep -rli 'LEFT JOIN' $i; done 
./seo-automatic-links/seo-links.php
./wp-postviews/wp-postviews.php
./yet-another-related-posts-plugin/classes/YARPP_Cache_Tables.php


I wanted to put less load on CPU during grep so looked for string only in .PHP extensioned files with:


 # for i in $(find . -iname '*.php' -exec grep -rli 'SELECT DISTINCT' '{}' \;); do grep -rli 'LEFT JOIN' $i; done
./seo-automatic-links/seo-links.php
./wp-postviews/wp-postviews.php
./yet-another-related-posts-plugin/classes/YARPP_Cache_Tables.php


As you can see the complex query is being called from PHP file belonging to one of 3 plugins

  • SEO Automatic Links – this is SEO Smart Links WP plugin (Does internal bliog interlinking in order to boast SEA)
  • WP PostViews – WordPress Post Views plugin (Which allows me to show how many times an article was read in WP Widget menu)
  • Yet Another Related Posts – Which is WP plugin I installed / enabled to show Related posts down on each blog post


2. Basic way to optimize MySQL slow queries (EXPLAIN / SHOW CREATE TABLE)

Now as I have a basic clue on plugins locking my Database, I disabled them one by one while keeping enabled mysql slow query log and viewing queries in mytop and I figure out that actually all of the plugins were causing a short time overheat (lock) on server Database because of LEFT JOINs. Though I really like what this plugins are doing, as they boast SEO and attract prefer to disable them for now and have my blog all the time responsible light fast instead of having a little bit better Search Engine Optimization (Ranking) and loosing many of my visitors because they're annoyed to wait until my articles open

Before disabling I tried to optimize the queries using MySQL EXPLAIN command + SHOW CREATE TABLE (2 commands often used to debug slow SQL queries and find out whether a Column needs to have added INDEX-ing to boast MySQL query).

Just in case if you decide to give them a try here is example on how they're used to debug problematic SQL query:
 

  1. mysql> explain SELECT DISTINCT post_title, ID, post_type, post_name
  2.     -> FROM wp_posts wposts LEFT JOIN wp_postmeta wpostmeta
  3.     -> ON wposts.ID = wpostmeta.post_id LEFT JOIN wp_term_relationships
  4.     -> ON (wposts.ID = wp_term_relationships.object_id) LEFT JOIN wp_term_taxonomy
  5.     -> ON (wp_term_relationships.term_taxonomy_id = wp_term_taxonomy.term_taxonomy_id)
  6.     -> WHERE (post_type='page'
  7.     -> OR (wp_term_taxonomy.taxonomy = 'category'
  8.     -> AND wp_term_taxonomy.term_id IN(11,15,17)))
  9.     -> AND post_status = 'publish'
  10.     -> AND LENGTH(post_title)>=5
  11.     -> ORDER BY LENGTH(post_title) ASC
  12.     -> LIMIT 500;
  13. +—-+————-+———————–+——–+——————+———+———+———————————————+——+———————————————-+
  14. | id | select_type | table                 | type   | possible_keys    | key     | key_len | ref                                         | rows | Extra                                        |
  15. +—-+————-+———————–+——–+——————+———+———+———————————————+——+———————————————-+
  16. |  1 | SIMPLE      | wposts                | ALL    | type_status_date | NULL    | NULL    | NULL                                        | 1715 | Using where; Using temporary; Using filesort |
  17. |  1 | SIMPLE      | wpostmeta             | ref    | post_id          | post_id | 8       | blog.wposts.ID                              |   11 | Using index; Distinct                        |
  18. |  1 | SIMPLE      | wp_term_relationships | ref    | PRIMARY          | PRIMARY | 8       | blog.wposts.ID                              |   19 | Using index; Distinct                        |
  19. |  1 | SIMPLE      | wp_term_taxonomy      | eq_ref | PRIMARY          | PRIMARY | 8       | blog.wp_term_relationships.term_taxonomy_id |    1 | Using where; Distinct                        |
  20. +—-+————-+———————–+——–+——————+———+———+———————————————+——+———————————————-+
  21. 4 rows in set (0.02 sec)
  22.  
  23. mysql>
  24.  


  1. mysql> show create table wp_posts;
  2. +———-+————————–+
  3. | Table    | Create Table                                                                                                                                                                                                                                                                                                                                                                                                                                 |
  4. +———-+————————–+
  5. | wp_posts | CREATE TABLE `wp_posts` (
  6.   `ID` bigint(20) unsigned NOT NULL AUTO_INCREMENT,
  7.   `post_author` bigint(20) unsigned NOT NULL DEFAULT '0',
  8.   `post_date` datetime NOT NULL DEFAULT '0000-00-00 00:00:00',
  9.   `post_date_gmt` datetime NOT NULL DEFAULT '0000-00-00 00:00:00',
  10.   `post_content` longtext NOT NULL,
  11.   `post_title` text NOT NULL,
  12.   `post_excerpt` text NOT NULL,
  13.   `post_status` varchar(20) NOT NULL DEFAULT 'publish',
  14.   `comment_status` varchar(20) NOT NULL DEFAULT 'open',
  15.   `ping_status` varchar(20) NOT NULL DEFAULT 'open',
  16.   `post_password` varchar(20) NOT NULL DEFAULT '',
  17.   `post_name` varchar(200) NOT NULL DEFAULT '',
  18.   `to_ping` text NOT NULL,
  19.   `pinged` text NOT NULL,
  20.   `post_modified` datetime NOT NULL DEFAULT '0000-00-00 00:00:00',
  21.   `post_modified_gmt` datetime NOT NULL DEFAULT '0000-00-00 00:00:00',
  22.   `post_content_filtered` longtext NOT NULL,
  23.   `post_parent` bigint(20) unsigned NOT NULL DEFAULT '0',
  24.   `guid` varchar(255) NOT NULL DEFAULT '',
  25.   `menu_order` int(11) NOT NULL DEFAULT '0',
  26.   `post_type` varchar(20) NOT NULL DEFAULT 'post',
  27.   `post_mime_type` varchar(100) NOT NULL DEFAULT '',
  28.   `comment_count` bigint(20) NOT NULL DEFAULT '0',
  29.   PRIMARY KEY (`ID`),
  30.   KEY `post_name` (`post_name`),
  31.   KEY `type_status_date` (`post_type`,`post_status`,`post_date`,`ID`),
  32.   KEY `post_parent` (`post_parent`),
  33.   KEY `post_author` (`post_author`),
  34.   FULLTEXT KEY `post_related` (`post_title`,`post_content`)
  35. ) ENGINE=MyISAM AUTO_INCREMENT=12033 DEFAULT CHARSET=utf8 |
  36. +———-+———————-+
  37. 1 row in set (0.00 sec)
  38.  
  39. mysql>
  40.  


By the way above output is a paste from the the new PasteBin Open Source (Stikked powered) service I started on www.pc-freak.net – paste.www.pc-freak.net (p.www.pc-freak.net) 🙂

Before I took final decision to disable slow WP plugins, I've experimented a bit trying to add INDEX to Table Column (wposts) in hope that this would speed up SQL queries with:


mysql> ALTER TABLE TABLE_NAME ADD INDEX (wposts);


But this didn't improve query speed even on the contrary it make execution time worse.

3. Tracking WordPress Plugin PHP Code Execution time and Plugins causing Slow SQL Queries (MySQL bottleneck) issues through WP itself

Well fine, I'm running my own hosted Blog and WordPress sites, but for people who have wordpress sites on shared hosting, there is usually no SSH (Terminal) Access to server, those people will be happy to hear there are 2 Free easy installable WordPress plugins which can be used to Debug Slow WordPress Plugins SQL Queries as well as plugin to Track which plugin takes most time to execute, this are:


a) P3 Plugin Performance Profiler  

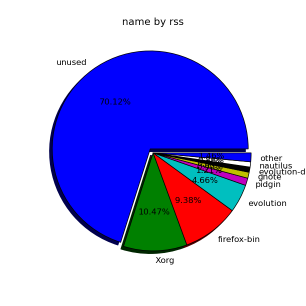
runs a scan over your site to determine what resources your plugins are using, and when, during a standard page request. P3 PPP Can even create reports in a beatiful Excel like Pie chart sheet.

p3-plugin-performance-profiler-godaddy-screenshot-debian-gnu-linux-wordpress-website

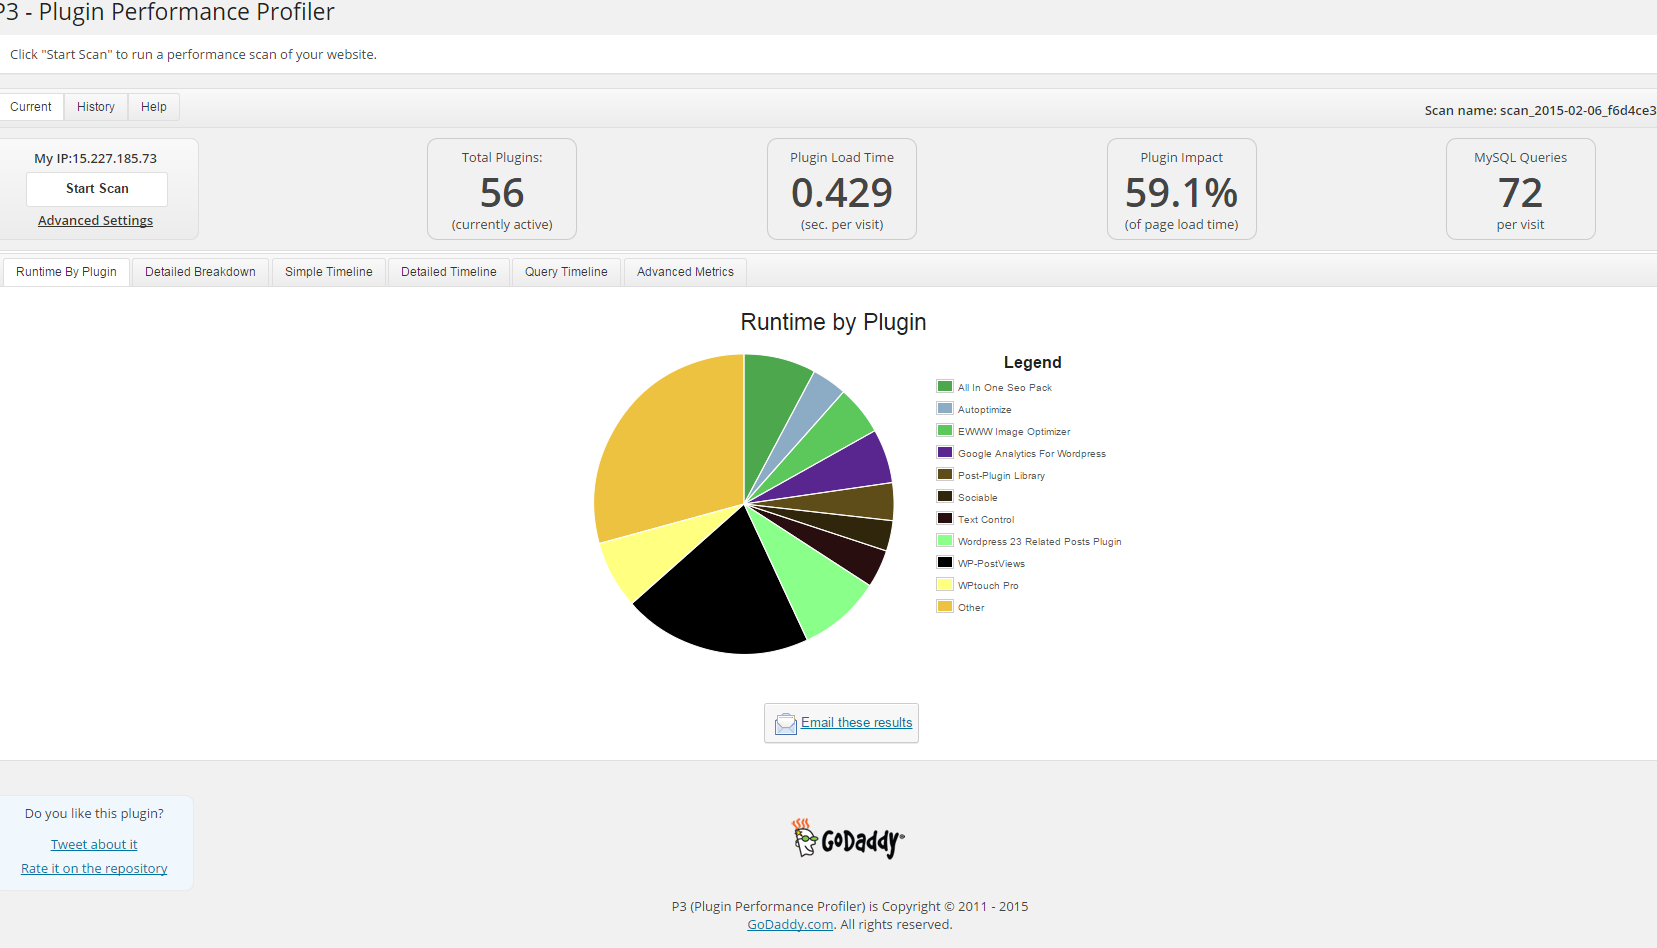
Another useful thing to see with P3 PPP is Detailed Timeline it shows when the plugins are being loaded during new page request so you can see if there is a certain sequence in time when a plugin slows down the website.

detailed_timeline-wordpress-p3-performance-plugin-on-website-screenshot

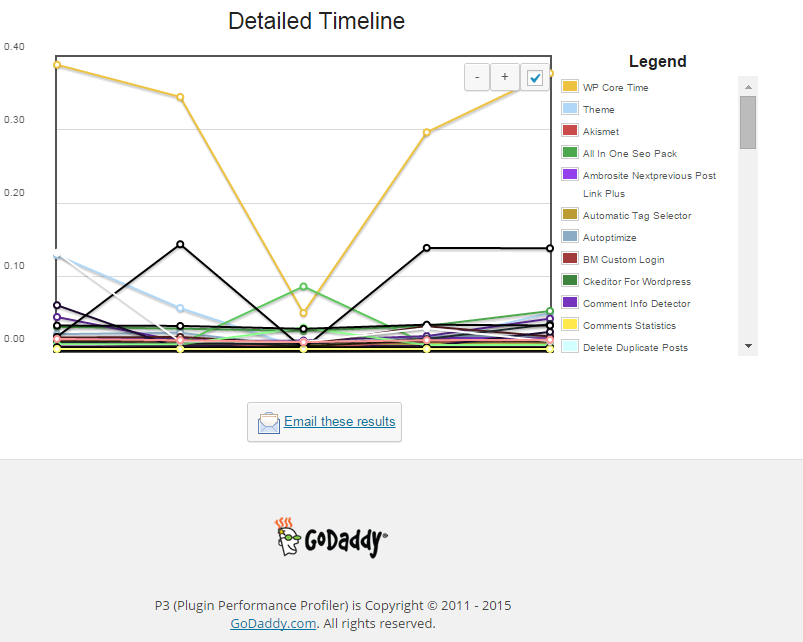
The pictures says it all as P3 PPP is Godaddy's work, congrats to GoDaddy, they've done great job.


b) WordPress memory Viewer WP plugins

Is useful to check how much memory each of WordPress plugin is taking on user (visitor) request.
Memory Viewer is allows you to view WordPress’ memory utilization at several hooks during WordPress’ execution. It also shows a summary of MySQL Queries that have ran as well as CPU time.
To use it download it to plugins/ folder as usual enable it from:

Installed Plugins -> (Inactive) -> Memory Viewer (Enable)

To see statistics from Memory Viewer open any post from your blog website and scroll down to the bottom you will notice the statistics, showing up there, like on below screenshot.

wordpress-memory-viewer-plugin-debian-gnu-linux-hosted-website-show-which-plugin-component-eats-most-memory-in-wordprses-blog
 

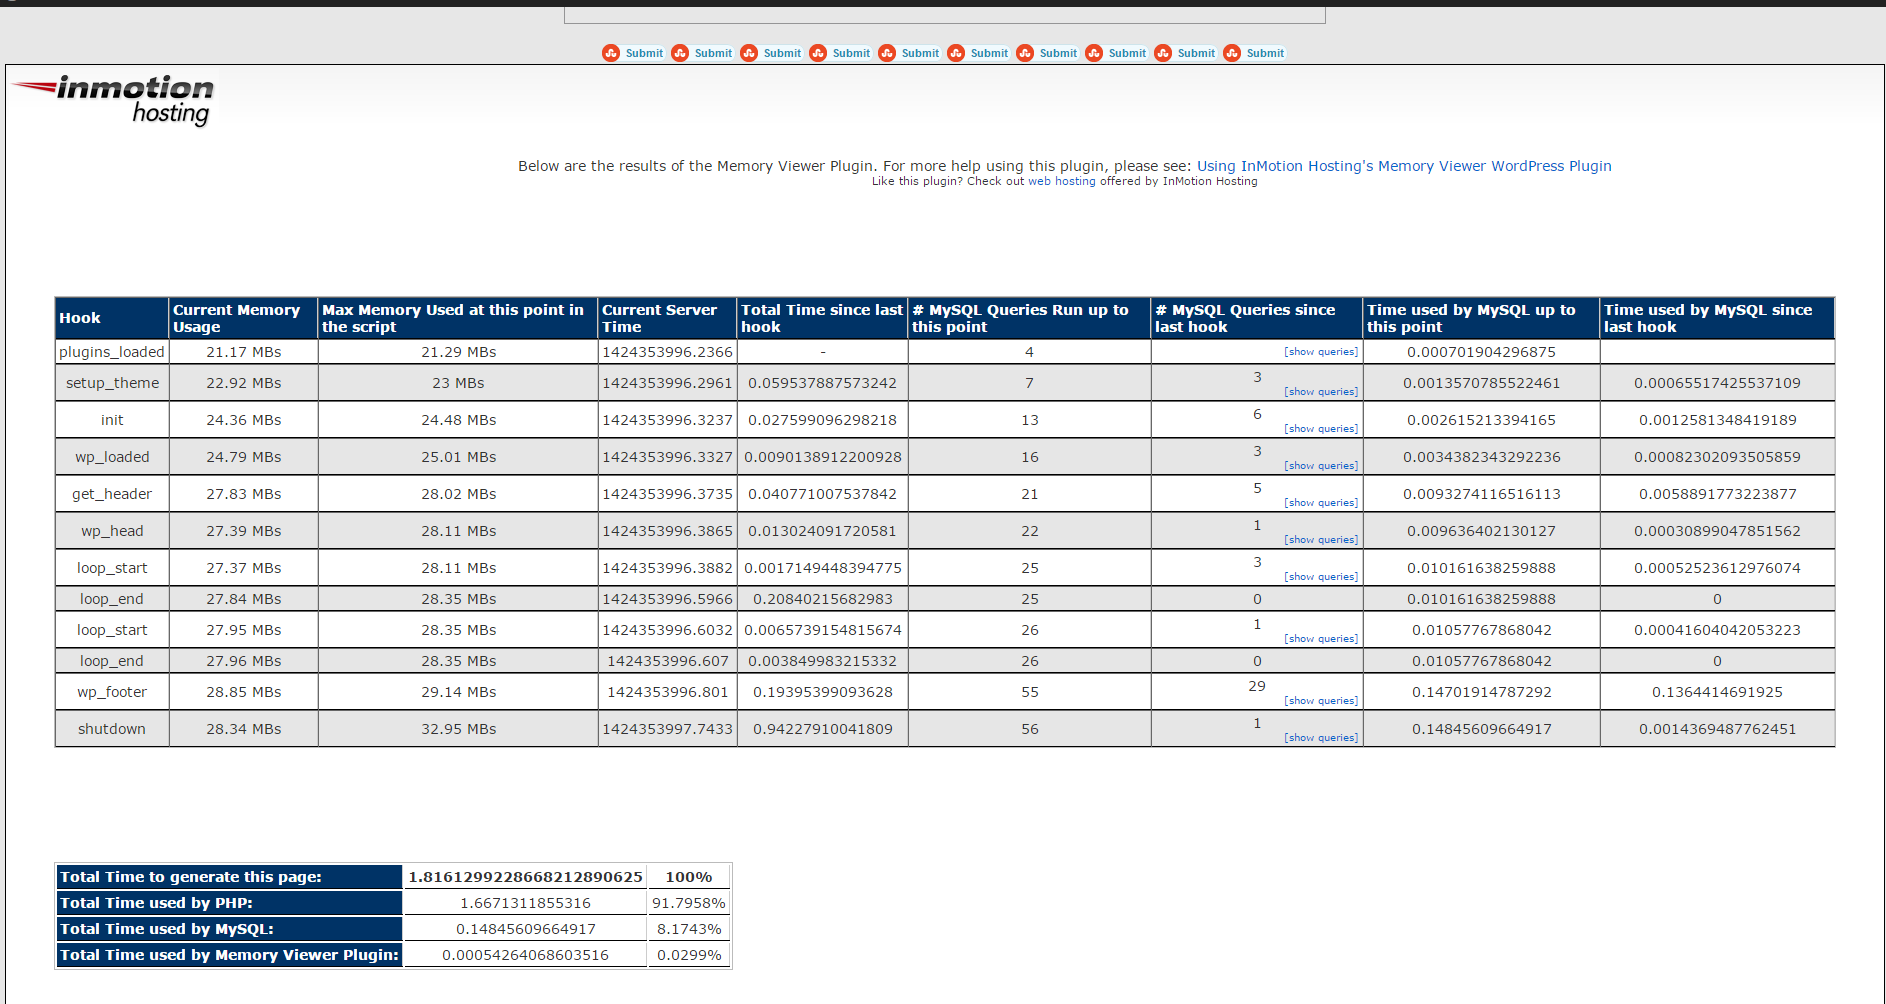
Though WP Memory Viewer is said to work only up to WP version 3.2.1, I've tested it and it works fine on my latest stable WordPress 4.1 based blog.

c) WordPress Query Monitor

wordpress-query-monitor-plugin-to-monitor-track-and-optimize-problems-with-sql-caused-by-wp-plugins.png
 

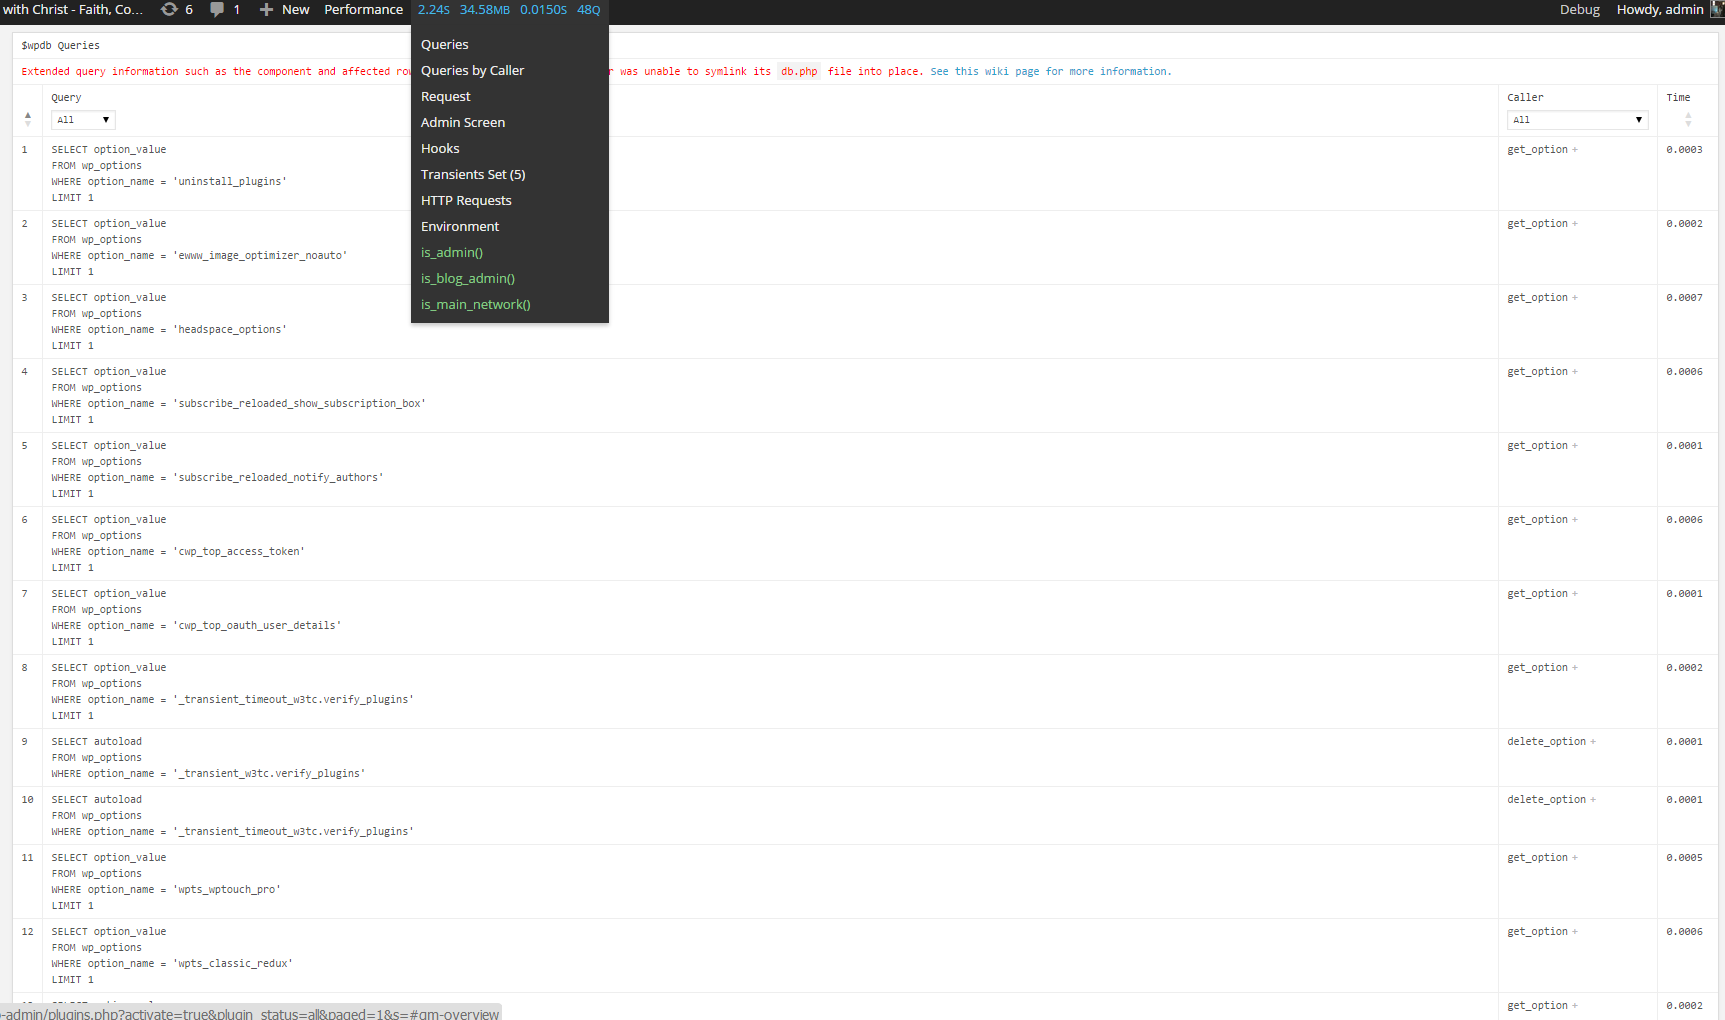
Query Monitor is a debugging plugin for anyone developing with WordPress but also very helpful for anyone who want to track issues with plugins who use the database unefficient.
It has some advanced features not available in other debugging plugins, including automatic AJAX debugging and the ability to narrow down things by plugin or theme.
You can view plenty of precious statistics on how enabled plugins query the database server, here is a short overview on its Database Queries capabilities:

  • Shows all database queries performed on the current page
  • Shows affected rows and time for all queries
  • Show notifications for slow queries and queries with errors
  • Filter queries by query type (SELECT, UPDATE, DELETE, etc)
  • Filter queries by component (WordPress core, Plugin X, Plugin Y, theme)
  • Filter queries by calling function
  • View aggregate query information grouped by component, calling function, and type
  • Super advanced: Supports multiple instances of wpdb on one page
  • Once enabled from Plugins you will see it appear as a new menu on bottom Admin raw.

An important note to make here is latest Query Monitor extension fails when loaded on current latest Wordpress 4.1, to use it you will have to download and useolder Query Monitor plugin version 2.6.8 you can download it from here
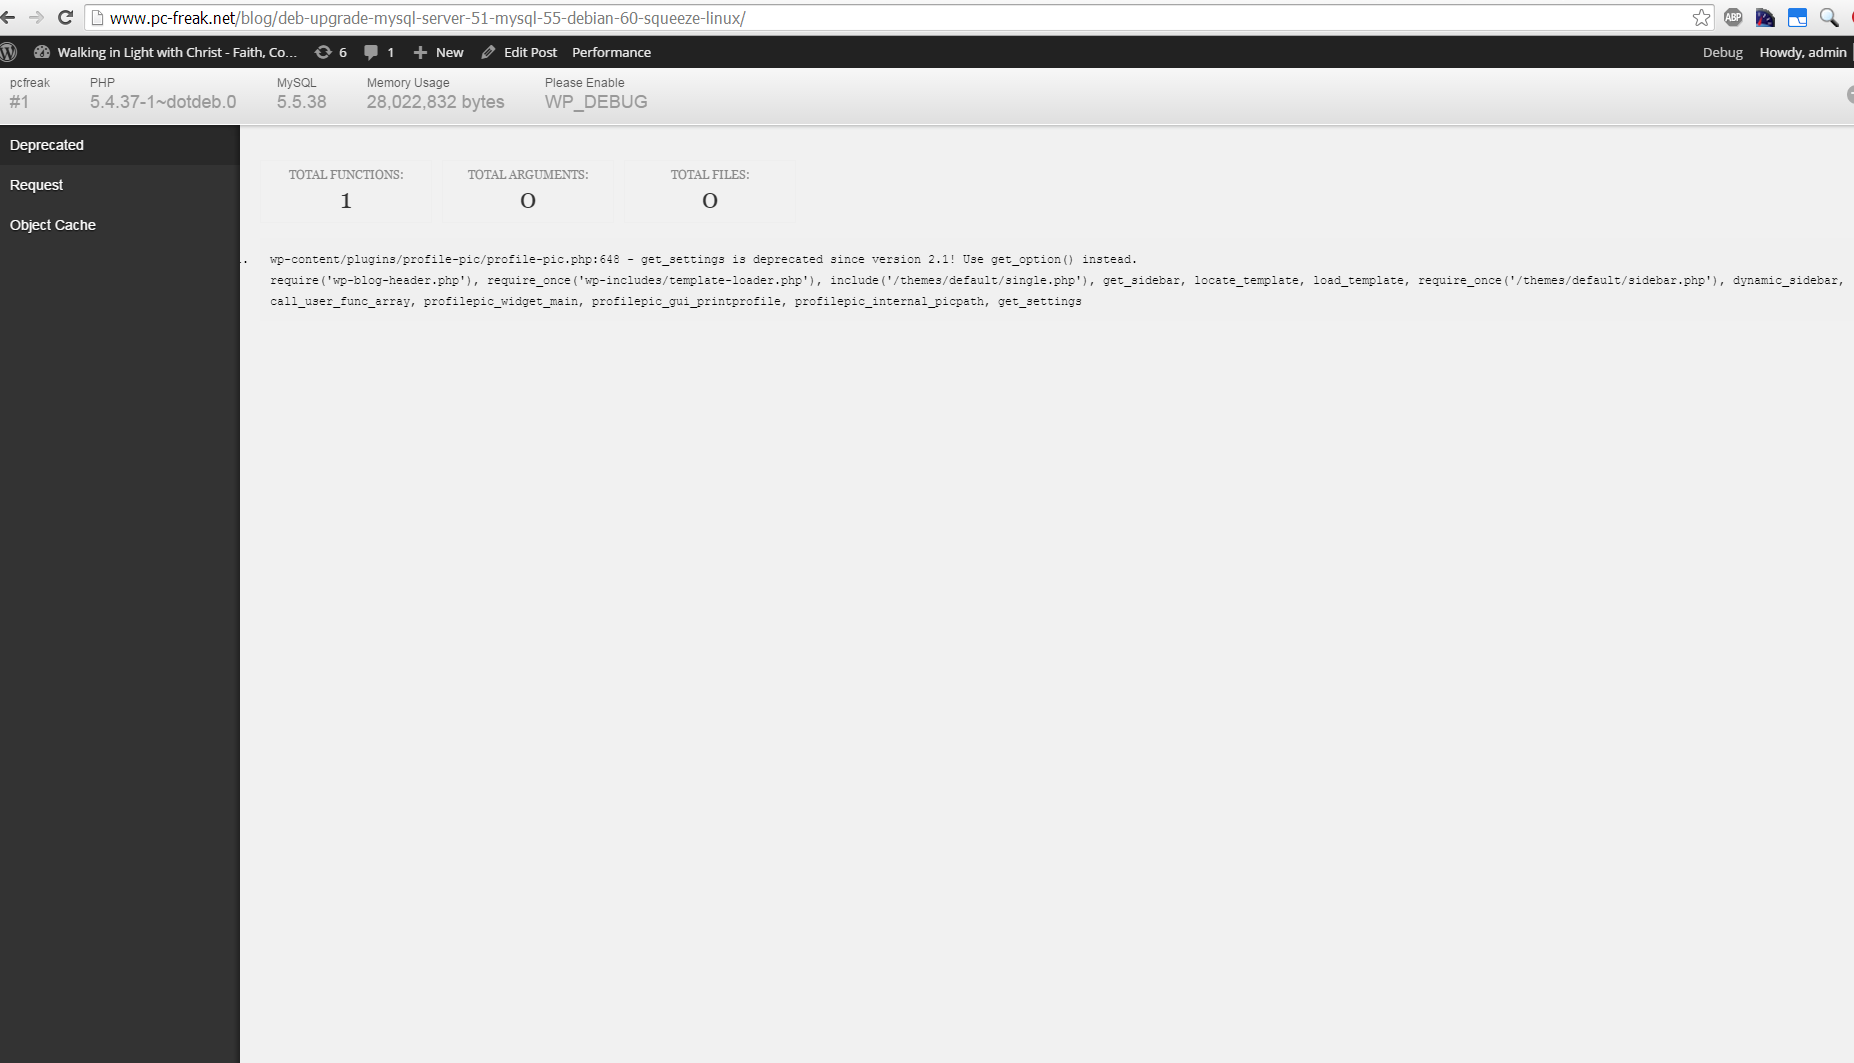
d) Debug Bar

If you want you want a Memory Viewer like plugin for more complex used components memory debugging, reporting if (WP_DEBUG is set in wp-config.php) also check out Debug Bar .
For me Debug Bar was very useful because it show me depreciated functions some plugins used, so I substituted the obsoleted function with new one.


debug-bar-debug-wordpress-plugins-memory-use-screenshot-website


4. Server Hardware hungry (slow) WordPress plugins that you better not use

While spending time to Google for some fixes to WP slow query plugins – I've stumbled upon this post giving a good list with WordPress Plugins better off not to use because they will slow down your site
This is a publicly well known list of WP plugins every WordPress based site adminstrator should avoid, but until today I didn't know so my assumption is you don't know either ..

Below plugins are extremely database intensive mentioned in article that we should better (in all cases!) avoid:

  • Dynamic Related Posts
  • SEO Auto Links & Related Posts
  • Yet Another Related Posts Plugin
  • Similar Posts
  • Contextual Related Posts
  • Broken Link Checker — Overwhelms even our robust caching layer with an inordinate amount of HTTP requests.
  • MyReviewPlugin — Slams the database with a fairly significant amount of writes.
  • LinkMan — Much like the MyReviewPlugin above, LinkMan utilizes an unscalable amount of database writes.
  • Fuzzy SEO Booster — Causes MySQL issues as a site becomes more popular.
  • WP PostViews — Inefficiently writes to the database on every page load. To track traffic in a more scalable manner, both the stats module in Automattic’s Jetpack plugin and Google Analytics work wonderfully.
  • Tweet Blender — Does not play nicely with our caching layer and can cause increased server load.


A good Complete list of known WordPress slow plugins that will hammer down your wordpress performance is here

There are few alternatives to this plugins and when I have some free time I will download and test their alternatives but for now I plan the plugins to stay disabled.
 

For the absolute WP Performance Optimization Freaks, its good to check out the native way to Debug a wordpress installation through using few embedded
variables


define('WP_DEBUG', true);
define('WP_DEBUG', false);
define('WP_DEBUG_LOG', true);
define('WP_DEBUG_DISPLAY', false);
define('SAVEQUERIES', true);


An article describing how you can use native WP debug variables is here


Happy Optimizing  ! 🙂

How much memory users uses in GNU / Linux and FreeBSD – Commands and Scripts to find user memory usage on Linux

Tuesday, February 17th, 2015


how-much-memory-users-use-in-gnu-linux-freebsd-command-to-find-and-show-ascending-descending-usage-of-system-memory-tux-memory-logo


If you have to administrate a heterogenous network with Linux and FreeBSD or other UNIX like OSes you should sooner or later need for scripting purposes to have a way to list how much memory separate users take up on your system. Listing memory usage per user is very helpful for admins who manager free-shells or for companies where you have developers, developing software directly on the server via ssh. Being able to check which process eats up most memory is essential for every UNIX / Linux sysadmin, because often we as admins setup (daemons) on servers and we forgot about their existence, just to remember they exist 2 years later and see the server is crashing because of memory exhaustion. Tracking server bottlenecks where RAM memory and Swapping is the bottleneck is among the main swiss amry knives of admins. Checking which user occupies all server memory is among the routine tasks we're forced to do as admins, but because nowdays servers have a lot of memory and we put on servers often much more memory than ever will be used many admins forget to routinely track users / daemons memory consumption or even many probably doesn't know how.  Probably all are aware of the easiest wy to get list of all users memory in console non interactively with free command, e.g.:
 

free -m
             total       used       free     shared    buffers     cached
Mem:         32236      26226       6010          0        983       8430
-/+ buffers/cache:      16812      15424
Swap:        62959        234      62725


but unfortunately free command only shows overall situation with memory and doesn't divide memory usage by user

Thus probably to track memory users the only known way for most pepole is to (interactively) use good old top command or if you like modern (colorful) visualization with htop:

debian:~# top


linux-check_memory_usage_by_logged-in-user-with-top-process-command-gnu-linux-freebsd-screenshot

Once top runs interactive press 'm' to get ordered list of processes which occupy most system memory on Linux server.Top process use status statistics will refresh by default every '3.0' seconds to change that behavior to '1' second press  s and type '1.0'. To get Sort by Memory Use in htop also press 'm'
 

[root@mail-server ~]# htop


htop_show_users_memory_usage_order_ascending-gnu-linux-screenshot


However if you need to be involved in scripting and setting as a cron job tasks to be performed in case if high memroy consumption by a service you will need to use few lines of code. Below are few examples on how Linux user memory usage can be shown with ps cmd.

Probably the most universal way to see memory usage by users on Debian / Ubuntu / CentOS / RHEL and BSDs (FreeBSD / NetBSD) is with below one liner:


server:~# ps hax -o rss,user | awk '{a[$2]+=$1;}END{for(i in a)print i” “int(a[i]/1024+0.5);}' | sort -rnk2
daemon 0
debian-tor 63
dnscache 1
dnslog 0
hipo 21
messagebus 1
mysql 268
ntp 2
privoxy 1
proftpd 1
qmaill 0
qmailq 0
qmailr 0
qmails 0
qscand 291
root 94
shellinabox 1
snmp 1
statd 1
vpopmail 80
www-data 6765


Output is in MBs

Below is output from machine where this blog is running, the system runs ( Apache + PHP + MySQL Webserver + Qmail Mail server and Tor) on Debian GNU / Linux.

 To get more human readable (but obscure to type – useful for scripting) output list of which user takes how much memory use on deb / rpm etc. based Linux :


server:~# echo "USER                 RSS      PROCS" ; echo "——————– ——– —–" ; \
ps hax -o rss,user | awk '{rss[$2]+=$1;procs[$2]+=1;}END{for(user in rss) printf “%-20s %8.0f %5.0f\n”, user, rss[user]/1024, procs[user];}' | sort -rnk2


USER                 RSS      PROCS
——————– ——– —–
www-data                 6918   100
qscand                    291     2
mysql                     273     1
root                       95   120
vpopmail                   81     4
debian-tor                 63     1
hipo                       21    15
ntp                         2     1
statd                       1     1
snmp                        1     1
shellinabox                 1     2
proftpd                     1     1
privoxy                     1     1
messagebus                  1     1
dnscache                    1     1
qmails                      0     2
qmailr                      0     1
qmailq                      0     2
qmaill                      0     4
dnslog                      0     1
daemon                      0     2


It is possible to get the list of memory usage listed in percentage proportion, with a tiny for bash loop and some awk + process list command
 

TOTAL=$(free | awk '/Mem:/ { print $2 }')
for USER in $(ps haux | awk '{print $1}' | sort -u)
do
    ps hux -U $USER | awk -v user=$USER -v total=$TOTAL '{ sum += $6 } END { printf "%s %.2f\n", user, sum / total * 100; }'
done

107 1.34
115 2.10
119 1.34
daemon 1.32
dnscache 1.34
dnslog 1.32
hipo 1.59
mysql 4.79
ntp 1.34
privoxy 1.33
proftpd 1.32
qmaill 1.33
qmailq 1.33
qmailr 1.32
qmails 1.33
qscand 4.98
root 1.33
snmp 1.33
statd 1.33
vpopmail 2.35
www-data 86.48

Also a raw script which can be easily extended to give you some custom information on memory use by user list_memory_use_by_user.sh is here.
You can also want to debug further how much memory a certain users (lets say user mysql and my username hipo) is allocating, this can easily be achieved ps like so:
 

root@pcfreak:~# ps -o size,pid,user,command -u mysql –sort -size
 SIZE   PID USER     COMMAND
796924 14857 mysql   /usr/sbin/mysqld –basedir=/usr –datadir=/var/lib/mysql –plugin-dir=/usr/lib/mysql/plugin –user=mysql –pid-file=/var/run/mysqld/mysqld.pid –socket=/var/run/mysqld/mysqld.sock –port=3306


root@pcfreak~# ps -o size,pid,user,command -u hipo –sort -size|less
 SIZE   PID USER     COMMAND
13408 19063 hipo     irssi
 3168 19020 hipo     SCREEN
 2940  2490 hipo     -bash
 1844 19021 hipo     /bin/bash
 1844 19028 hipo     /bin/bash
 1844 19035 hipo     /bin/bash
 1844 19042 hipo     /bin/bash
 1844 19491 hipo     /bin/bash
 1844 22952 hipo     /bin/bash
  744  2487 hipo     sshd: hipo@pts/0
  744  2516 hipo     sshd: hipo@notty
  524  2519 hipo     screen -r
  412  2518 hipo     /usr/lib/openssh/sftp-server

You see from below output user running with www-data (this is Apache Webserver user in Debian) is eating 86.48% of overall system memory and MySQL server user is using only 4.79% of available memory

Output is shown in Megabytes per username memory usage, and user memory usage is ordered (stepping-down / descentive) from top to bottom

Getting more thoroughful and easier to read reporting without beeing a 31337 bash coder you can install and use on Linux smem – memory reporting tool .

SMEM can provide you with following memory info:

  • system overview listing
  • listings by process, mapping, user
  • filtering by process, mapping, or user
  • configurable columns from multiple data sources
  • configurable output units and percentages
  • configurable headers and totals
  • reading live data from /proc
  • reading data snapshots from directory mirrors or compressed tarballs
  • lightweight capture tool for embedded systems
  • built-in chart generation


Installing smem on Debian 6 / 7 / Ubuntu 14.04 / Turnkey Linux etc. servers is done with standard:


debian:~# apt-get install –yes smem
….


To install smem on CentOS 6 / 7:


[root@centos ~ ]# yum -y install smem
….


On Slackware and other Linux-es where smem is not available as a package you can install it easily from binary archive with:


cd /tmp/
wget http://www.selenic.com/smem/download/smem-1.3.tar.gz
tar xvf smem-1.3.tar.gz
sudo cp /tmp/smem-1.3/smem /usr/local/bin/
sudo chmod +x /usr/local/bin/smem


Two most common smem uses are:


root@mail:~# smem -u
User     Count     Swap      USS      PSS      RSS
dnslog       1       44       48       54      148
qmaill       4      232      124      145      464
hipo        11    13552     8596     9171    13160
qscand       2     4500   295336   295602   297508
root       188   217312  4521080  4568699  7712776


Below command shows (-u – Report memory usage by user, -t – show totals, -k – show unix suffixes)

root@mail:~# smem -u -t -k
User     Count     Swap      USS      PSS      RSS
dnslog       1    44.0K    48.0K    54.0K   148.0K
qmaill       4   232.0K   124.0K   145.0K   464.0K
hipo        11    13.2M     8.4M     9.0M    12.9M
qscand       2     4.4M   288.4M   288.7M   290.5M
root       188   212.2M     4.3G     4.4G     7.4G
—————————————————
           206   230.1M     4.6G     4.6G     7.7G


To get users memory use by percentage with smem:
 

root@mail:~# smem -u -p
User     Count     Swap      USS      PSS      RSS
dnslog       1    0.00%    0.00%    0.00%    0.00%
qmaill       4    0.00%    0.00%    0.00%    0.01%
hipo        11    0.17%    0.11%    0.11%    0.16%
qscand       2    0.05%    3.63%    3.63%    3.66%
root       194    2.64%   56.18%   56.77%   95.56%

It is also useful sometimes when you want to debug system overloads caused by external hardware drivers loaded into kernel causing issues to get list of system wide memory use sorted by user


 root@mail:~# smem -w -p
Area                           Used      Cache   Noncache
firmware/hardware             0.00%      0.00%      0.00%
kernel image                  0.00%      0.00%      0.00%
kernel dynamic memory        38.30%     36.01%      2.28%
userspace memory             60.50%      0.98%     59.53%
free memory                   1.20%      1.20%      0.00%


smem is very nice as if you're running it on a Desktop Linux system with Xserver installed you can see also graphical output of memory use by application:
 

root@desktop-pc:~# smem –bar pid -c "pss uss"


smem_graphical_representation-of-which-user-application-is-consuming-most-memory-gnu-linux-kde-screenshot-smem-command-line-tool

smem can even generate graphical pie charts to visualize better memory use
 

root@desktop-pc:~# smem -P '^k' –pie=name


generate-graphical-staticstics-linux-memory-use-by-pie-chart

If there is a high percentage shown in firmware/hardware this means some buggy module is loaded in kernel eating up memory, to fix it debug further and remove the problematic module.
userspace memory actually shows the percantage of memory out of all server available RAM that is being consumed by applications (non kernel and other system processes which make the system move). You see in above example the kernel itself is consuming about 40% of system overall available memory. 

We all know the SWAP field stands for hard disk drive used as a memory when system is out, but there are 3 fields which smem will report which will be probably unclear for most here is also explanation on what USS / PSS / RSS means?

RSS is the Resident Set Size and is used to show how much memory is allocated to that process and is in RAM. It does not include memory that is swapped out. It does include memory from shared libraries as long as the pages from those libraries are actually in memory. It does include all stack and heap memory too.

There is also PSS (proportional set size). This is a newer measure which tracks the shared memory as a proportion used by the current process. So if there were two processes using the same shared library from before.

USS stands for Unique set size, USS is just the unshared page count, i.e. memory returned when process is killed 

PSS = Proportional set size, (PSS),  is a more meaningful representation of the amount of memory used by libraries and applications in a virtual memory system.  
Because large portions of physical memory are typically shared among multiple applications, the standard measure of memory usage known as resident set size (RSS) will significantly overestimate memory usage. The parameter PSS instead measures each application’s “fair share” of each shared area to give a realistic measure. For most admins checking out the output from RSS (output) should be enough, it will indicate which user and therefore which daemon is eating up all your memory and will help you to catch problematic services which are cause your server to run out of RAM and start swapping to disk.

How to deb upgrade PHP 5.3.3-7 / MySQL Server 5.1 to PHP 5.4.37 MySQL 5.5 Server on Debian 6.0 / 7.0 Squeeze / Wheezy GNU / Linux

Thursday, February 12th, 2015

how-to-deb-upgrade-mysql-server-5.1-to-mysql-5.5-php-5.3-to-php-5.4-5.5-upgrade-howto-on-old-stable-debian-squeeze-wheezy

I've been still running Debian Squeeze 6.0 GNU / Linux on few of the Linux / Apache / MySQL servers I'm administrating and those servers are running few Wordperss / Joomla websites which lately face severe MySQL performance issues. I tried to optimize using various mysql performance optimization scripts such as mysql-tuner.pl, Tuning-primer.sh and Percona Toolkit – a collection of advanced command-line tools for system administrators and tech / support staff to perform a variety of MySQL and system tasks that are too difficult or complex to perform manually. Though with above tools and some my.cnf tunizations I managed to achieve positive performance improvement results with above optimizations, still I didn't like how MyQSL served queries and since the SQL server is already about 5 years old (running version 5.1) and the PHP on sever is still at 5.3 branch, I was advised by my dear colleague Anatoliy to try version update as a mean to improve SQLserver performance. I took seriously the suggestion to try upgrade as a mean to resolve performance issues in this article I will explain in short what I had to do to make MySQL upgrade a success

Of course to try keep deb installed software versions as fresh as possible possible deb packagse, I'm already using Debian Back Ports (for those who hear it a first time Debian Backports is a special repository for Stable versioned Debian Desktop and Servers  – supporting stable releases of Debian Linux) which allows you to keep install packages versions less outdated (than default installable software which usually are way behind latest stable package versions with 2-5 years).

If you happen to administer Stable Debian servers and you never used BackPorts I warmly recommend it as it often includes security patches of packages part of Debian stable releases that reached End Of Support (EOS) and already too old even for security updates to be issued by respective Debian Long Term Suport (LTS) repositories.

If you're like me and still in situation to manage remotely Debian 6.0 Squeeze and its the first time you hear about BackPorts and Debian LTShttps://wiki.debian.org/LTS/ to start using those two add to your /etc/apt/sources.list below 3 lines

Open with vim editor and press shift+G to go to last line of file and then press I to enter INSERT mode, once you're done to save, press (ESC) then press : and type x! in short key combination for exit and save setting in vim is 
 

Esc + :x! 


debian-server:~# vim /etc/apt/sources.list
deb http://http.debian.net/debian squeeze-lts main contrib non-free
deb-src http://http.debian.net/debian squeeze-lts main contrib non-free
deb http://http.debian.net/debian-backports squeeze-backports main

If you haven't been added a security updates line in /etc/apt/sources.list make sure you add also:


deb http://security.debian.org/ squeeze/updates main contrib non-free
deb-src http://security.debian.org/ squeeze/updates main contrib non-free


Then to apply latest security updates and packages from LTS / Backports repository run the usual:


debian-server:~# apt-get update && apt-get –yes upgrade
….

If you need to search a package or install something from just added backports repository use:


debian-server:~# apt-cache -t squeeze-backports search "mysql-server"
auth2db – Powerful and eye-candy IDS logger, log viewer and alert generator
torrentflux – web based, feature-rich BitTorrent download manager
cacti – Frontend to rrdtool for monitoring systems and services
mysql-server-5.1 – MySQL database server binaries and system database setup
mysql-server-core-5.1 – MySQL database server binaries
mysql-server – MySQL database server (metapackage depending on the latest version)


To install specific packages only with all their dependencies from Backports while keeping rest of packages from Debian Stable:


debian-server:~# apt-get install -t squeeze-backports "package_name"

In same way you can also search or install specific packages from LTS repo:


debian-server:~# apt-get search -t squeeze-lts "package_name"

debian-server:~# apt-get install -t squeeze-lts "package_name"

Latest mysql available from Debian BackPorts and LTS is still quite old 5.1.73-1+deb6u1 therefore I made an extensive research online on how can I easily update MySQL 5.1 to MySQL 5.5 / 5.6 on Debian Stable Linux.
 

Luckily there were already DotDeb deb repositories for Debian LAMP (Linux / Apache  / MySQL / PHP / Nginx ) running servers prepared in order to keep the essential Webserver services up2date even long after distro official support is over. I learned about existence of this repo thanks to a Ryan Tate's post who updates his LAMP stack on TurnKey Linux which by the way is based on slightly modified official stable Debian Linux releases packages

To start using DotDeb repos add in /etc/apt/sources.list (depending whereh you're on Squeeze or Wheeze Debian):


deb http://packages.dotdeb.org squeeze all
deb-src http://packages.dotdeb.org squeeze all

or for Debian Wheezy add repos:


deb http://packages.dotdeb.org wheezy all
deb-src http://packages.dotdeb.org wheezy all


I was updating my DebianLatest MySQL / PHP / Apache release to Latest ones on (6.0.4) Squeeze so added above squeeze repos:

Before refreshing list of package repositories, to authenticate repos issue:


debian-server:~# wget -q http://www.dotdeb.org/dotdeb.gpg
debian-server:~# apt-key add dotdeb.gpg

Once again to update my packages from newly added DodDeb repository


debian-server:~# apt-get update

Before running the SQL upgrade to insure myself, I dumped all databases with:


debian-server:~# mysqldump -u root -p -A > /root/dump.sql

Finally I was brave enough to run apt-get dist-upgrade to update with latest LAMP packages


debian-server:~# apt-get dist-upgrade
Reading package lists… Done
Building dependency tree
Reading state information… Done
Calculating upgrade… Done
The following packages will be REMOVED:
  mysql-client-5.1 mysql-server mysql-server-5.1
The following NEW packages will be installed:
  libaio1 libmysqlclient18 mysql-client-5.5 mysql-client-core-5.5 python-chardet python-debian
The following packages will be upgraded:
  curl krb5-multidev libapache2-mod-php5 libc-bin libc-dev-bin libc6 libc6-dev libc6-i386 libcurl3 libcurl3-gnutls libcurl4-openssl-dev libevent-1.4-2
  libgssapi-krb5-2 libgssrpc4 libjasper1 libk5crypto3 libkadm5clnt-mit7 libkadm5srv-mit7 libkdb5-4 libkrb5-3 libkrb5-dev libkrb53 libkrb5support0 libmysqlclient-dev
  libxml2 libxml2-dev locales mysql-client mysql-common ntp ntpdate php-pear php5 php5-cgi php5-cli php5-common php5-curl php5-dev php5-gd php5-imagick php5-mcrypt
  php5-mysql php5-odbc php5-recode php5-sybase php5-xmlrpc php5-xsl python-reportbug reportbug unzip

50 upgraded, 6 newly installed, 3 to remove and 0 not upgraded.
Need to get 51.7 MB of archives.
After this operation, 1,926 kB of additional disk space will be used.
Do you want to continue [Y/n]? Y

As you see from above output above command updates Apache webservers / PHP and PHP related modules, however it doesn't update MySQL installed version, to update also MySQL server 5.1 to MySQL server 5.5


debian-server:~#  apt-get install –yes mysql-server mysql-server-5.5

You will be prompted with the usual Debian ncurses text blue interface to set a root password to mysql server, just set it the same as it used to be on old upgraded MySQL 5.1 server.

Well now see whether mysql has properly restarted with ps auxwwf


debian-server:~#  ps axuwwf|grep -i sql
root     22971  0.0  0.0 112360   884 pts/11   S+   15:50   0:00  |                   \_ grep -i sql
root     19436  0.0  0.0 115464  1556 pts/1    S    12:53   0:00 /bin/sh /usr/bin/mysqld_safe
mysql    19837  4.0  2.3 728192 194552 pts/1   Sl   12:53   7:12  \_ /usr/sbin/mysqld –basedir=/usr –datadir=/var/lib/mysql –plugin-dir=/usr/lib/mysql/plugin –user=mysql –pid-file=/var/run/mysqld/mysqld.pid –socket=/var/run/mysqld/mysqld.sock –port=3306
root     19838  0.0  0.0 110112   700 pts/1    S    12:53   0:00  \_ logger -t mysqld -p daemon.error

In my case it was running, however if it fails to run try to debug what is going wrong on initialization by manually executing init script /etc/init.d/mysql stop; /etc/init.d/mysql start and look for errors. You can also manually try to run mysqld_safe from console if it is not running run:


debian-server:~# /usr/bin/mysqld_safe &

This should give you a good hint on why it is failing to run
 

One more thing left is to check whether php modules load correctly to do so issue:


debian-server:~# php -v
Failed loading /usr/lib/php5/20090626/xcache.so:  /usr/lib/php5/20090626/xcache.so: cannot open shared object file: No such file or directory

Failed loading /usr/lib/php5/20090626/xdebug.so:  /usr/lib/php5/20090626/xdebug.so: cannot open shared object file: No such file or directory


You will likely get an exception (error) like above.
To solve the error, reinstall xcache and xcache-debug debs


debian-server:~# apt-get purge php5-xcache php5-xdebug

Now PHP + MySQL + Apache environment should be running much smootly.

debian-squeeze-wheeze-update-install-mysql-sevver5.55-620x344-howto

Upgrading the MySQL server / PHP library to MySQL server 5.6 / PHP 5.5 on Wheeze Linux is done in very much analogous ways all you have to do is change the repositories with above wheeze 7.0 ones and to follow the process as described in this article. I haven't tested update on Wheezy yet, so if you happen to try my article with wheezy reports and got a positive upgrade result please drop a comment.

Remove \r (Carriage Return) from string with standard bash shell / sed / tr / vim or awk – Replace \r hidden messy characters from files

Tuesday, February 10th, 2015

remove_r_carriage_return_from_string_with-standard-bash_shell_sed_tr_or_awk_replace_annoying_hidden_messy_characters_from_files

I've been recently writting this Apache webserver / Tomcat / JBoss / Java decomissioning bash script. Part of the script includes extraction from httpd.conf of DocumentRoot variable configured for Apache host.
I was using following one liner to grep and store DocumentRoot set directory into new variable:

documentroot=$(grep -i documentroot /usr/local/apache/conf/httpd.conf | awk '{ print $2 }' |sed -e 's#"##g');

Above line greps for documentroot prints 2nd column of the matchi (which is the Apache server set docroot and then removes any " chars).

However I faced the issue that parsed string contained in $documentroot variable there was mysteriously containing r – return carriage – this is usually Carriage Return (CR) sent by Mac OS and Apple computers. For those who don't know the End of Line of files in UNIX / Linux OS-es is LF – often abreviated as n – often translated as return new line), while Windows PCs use for EOF CR + LF – known as the infamous  rn. I was running the script from the server which is running SuSE SLES 11 Linux, meaning the CR + LF end of file is standardly used, however it seem someone has editted the httpd.conf earlier with a text editor from Mac OS X (Terminal). Thus I needed a way to remove the r from CR character out of the variable, because otherwise I couldn't use it to properly exec tar to archive the documentroot set directory, cause the documentroot directory was showing unexistent.

Opening the httpd.conf in standard editor didn't show the r at the end of
"directory", e.g. I could see in the file when opened with vim

DocumentRoot "/usr/local/apache/htdocs/site/www"

However obviously the r character was there to visualize it I had to use cat command -v option (–show-nonprinting):

cat -v /usr/local/apache/conf/httpd.conf

DocumentRoot "/usr/local/apache/htdocs/site/wwwr"


1. Remove the r CR with bash

To solve that with bash, I had to use another quick bash parsing that scans through $directory and removes r, here is how:

documentroot=${documentroot%$'r'}

It is also possible to use same example to remove "broken" Windows rn Carriage Returns after file is migrated from Windows to Liunx /  FreeBSD host:

documentroot=${documentroot%$'rn'}


2. Remove r Carriage Return character with sed

Other way to do remove (del) Windows / Mac OS Carriage Returns in case if Migrating to UNIX is with sed (stream editor).

sed -i s/r// filename >> filename_out.txt


3. Remove r CR character with tr

There is a third way also to do it with (tr) – translate or delete characters old shool *nix command:

tr -d 'r' < file_with_carriagereturns > file_without_carriage_returns


4. Remove r CRs with awk (pattern scanning and processing language)

 awk 'sub("$", "r")' inputf_with_crs.txt > outputf_without_crs.txt


5. Delete r CR with VIM editor

:%s/r//g


6. Converting  file DOS / UNIX OSes with dos2unix and unix2dos command line tools

For sysadmins who don't want to bother with writting code to convert CR when moving files between Windows and UNIX hosts there are dos2unix and unix2dos installable commands.

All done Cheers ! 🙂