Posts Tagged ‘statistics’

Get daily E-Mail Reports statistics on postfix Linux mail server

Tuesday, July 14th, 2020

https://www.pc-freak.net/images/Postfix-email-server-logo.svg-1

I've had today a task at work to monitor a postfix mail send and received emails (MAIL FROM / RPCT TO) and get out a simple statistics on what kind of emails are coming and going out from the Postfix SMTP on a server?

Below is shortly explained how I did it plus you will learn how you can use something more advanced to get server mail count, delivery status, errors etc. daily.
 

1. Using a simple script to process /var/log/messages

For that I made a small script to do the trick, the script simply checks mail delivery logged information from /var/log/maillog process a bit sort and logs in a separate log daily.

#!/bin/sh
# Process /var/log/maillog extract from= and to= mails sort
# And log mails to $LOGF
# Author Georgi Georgiev 14.07.2020

DATE_FORM=$(date +'%m_%d_%y_%H_%M_%S_%h_%m');
LOG='/home/gge/mail_from_to-mails';
LOGF="$LOG.$DATE_FORM.log";
CUR_DATE=$(date +'%m_%d_%y_%T');
echo "Processing /var/log/maillog";
echo "Processing /var/log/maillog" > $LOGF;
echo >>$LOGF
echo "!!! $CUR_DATE # Sent MAIL FROM: addresses: !!!" >> $LOGF;
grep -E 'from=' /var/log/maillog|sed -e 's#=# #g'|awk '{ print $8 }'|sed -e 's#<# #g' -e 's#># #g' -e 's#\,##'|sort -rn|uniq >> $LOGF;

echo "!!! $CUR_DATE # Receive RCPT TO: addresses !!!" >>$LOGF;
grep -E 'to=' /var/log/maillog|sed -e 's#=# #g'|awk '{ print $8 }'|sed -e 's#<# #g' -e 's#># #g' -e 's#\,##'|sort -rn|uniq >> $LOGF;


You can get a copy of the mail_from_to_collect_mails_postfix.sh script here.

I've set the script to run via a crond scheduled job once early in the mornthing and I'll leave it like that for 5 days or so to get a good idea on what are the mailboxes that are receiving incoming mail.

The cron I've set to use is as follows:

# crontab -u root -l 
05 03 * * *     sh /home/gge/mail_from_to.sh >/dev/null 2>&1


This will be necessery later for a Email Server planned migration to relay its mail via another MTA host.


2. Getting More Robust Postifx Mail Statistics from logs


My little script is of course far from best solution to get postfix mail statistics from logs.

If you want something more professional and you need to have a daily report on what mails sent to mail server and mails sent from the MTA to give you information about the Email delivery queue status, number of successful and failed emails from a mail sender / recipient and a whole bunch of useful info you can use something more advanced such as pflogsumm perl script to get daily / weekly monthly mail delivery statistics.

What can pflogsumm do for you ?


Pflogsumm is a log analyzer/summarizer for the Postfix MTA. It is
designed to provide an overview of Postfix activity, with just enough
detail to give the administrator a “heads up” for potential trouble
spots and fixing any SMTP and email related issues.

Pflogsumm generates summaries and, in some cases, detailed reports of
mail server traffic volumes rejected and bounced email and server
warnings, errors, and panics.

At the time of writting this article it is living on jimsun.linxnet.com just in case if pflogsumm.pl's official download location disappears at some time in future here is pflogsumm-1.1.3.tar.gz mirror stored on www.pc-freak.net

– Install pflogsumm

Use of pflogsumm is pretty straight forward, you download unarchive the script to some location such as /usr/local/bin/pflogsumm.pl  add the script executable flag and you run it to create a Postfix Mail Log statistics report for you

wget http://jimsun.linxnet.com/downloads/pflogsumm-1.1.3.tar.gz -O /usr/local/src/pflogsumm-1.1.3.tar.gz


# mkdir -p /usr/local/src/
# cd /usr/local/src/
# tar -zxvf pflogsumm-1.1.3.tar.gz
# cd pflogsumm-1.1.3/

# mv /usr/local/pflogsumm-1.1.3/pflogsumm.pl /usr/local/bin/pflogsumm
# chmod a+x /usr/local/bin/pflogsumm


That's all, assuming you have perl installed on the system with some standard modules, we're now good to go: 

To give it a test report to the command line:

# /usr/local/bin/pflogsumm -d today /var/log/maillog

pflogsumm-log-summary-screenshot-linux-received-forwarded-bounced-rejected

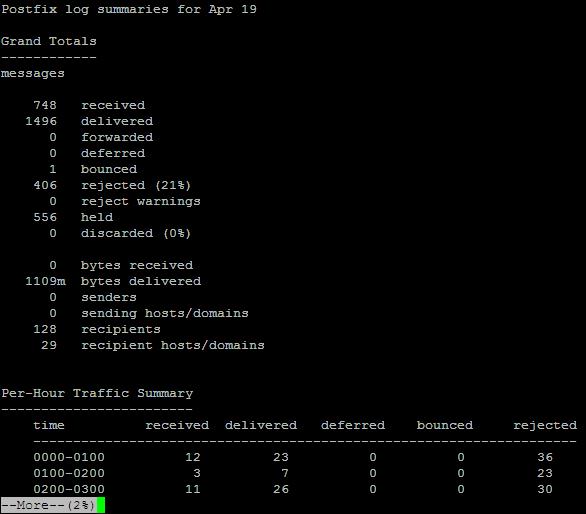
To generate mail server use report and launch to some email of choice do:

# /usr/local/bin/pflogsumm -d today /var/log/maillog | mail -s Mailstats your-mail@your-domain.com


To make pflogsumm report everyday various interesting stuff such as (message deferrals, message bounce, details, smtp delivery failures, fatal errors, recipients by message size etc. add some cronjob like below to the server:

# /usr/sbin/pflogsumm -d yesterday /var/log/maillog | mail -s Mailstats | mail -s Mailstats your-mail@your-domain.com

If you need a GUI graphical mail monitoring in a Web Browser, you will need to install a webserver with a perl / cgi support,  RRDTools and MailGraph.

linux-monitoring-mail-server-with-mailgraph.cgi

How to View and Delete NetApp Storage qtree, Get statistics about Filer Volume Read / Writes operations and delete and show mounted volumes

Friday, August 2nd, 2019

how-to-delete-volume-qtree-snapmirror-view-netapp-volume-qtree-and-and-view-netapp-cluster-device-statistics-NetAppLogo

I've had recently the trivial decomissioning task to delete some NetApp Storage qtrees on some of the SAP Hana Enterprise Cloud NetApp filers.
If it is first time you heard of NetApp is a hybrid cloud data services and data management (ranked in the Fortune 500 companies).

Netapps are hybrid cloud data services for management of applications and data across cloud and on-premises environments and are a de-facto standard for Data storage on many of the existing Internet Clouds and Large Corporatons that Stores many Pentabytes of Data.

The Netapp storage devices are a kinda of proprietary Clustered version of the Small business NAS storage Solution FreeNAS (which of itself is a Free FreeBSD based Data Storage OS – The #1 Storage OS).
NetApps allow plenty of things to do such as Data Mirroring (Data Backups), Data Syncing, SpapMirroring, SnapVault and many, many more custom Data revolutionary solutions such as StorageGrid.

NetApp supports integration with Kubernetes, Docker, Oracle / SAP DB, Citrix, Xen, KVM as well as multiple cloud environments such as AWS, Azure, OpenStack and has even integration with some CI/CD DevOps data provisioning – i.e. Jenkins.

In this small article, I'll show you how a Volume / Qtree on a NetApp filer could be viewed, mounted, unmounted, deleted. I'll also show you how to get statistics, while logged in remotely to the NetApp console and finally how to view and delete a NetApp configured snapmirror.


View NetApp Qtree


Here is how to view the Storage Qtree:

netapp> qtree show -vserver netapp01fv018 -volume VOL_OS_MIG -qtree bck_01v046485_20190108

To view the file content existing on the Storage server from the Linux bost next step to do is mount it with regular mount:

linux-host:~# mount netappfiler01fv018:/VOL_OS_MIG/ bck_01v035527_20190108 /mnt/test


Delete the Qtree from NetApp (Storage) Filer

Become administrator on the device

Once assured the content could go on to delete the qtree, it is necessery to become superuser (root) on the NetApp device, to do so, I hed to type:


netapp> set -privilege advanced


Then to delete the unneded volume previously used for transferring system update files, when logged in via SSH to the NetApp device – ONTAP Proprietary Operating system :


netapp> qtree delete -vserver netapp01fv018 -volume VOL_OS_MIG -force -qtree bck_01v035527_20190108


Note that this command will return back a job ID
assigned until operation is completed, to check the status of completion of generated JOB that is backgrounded, I've used command:

netapp> job show 53412

If all is okay you should get a Status of Success otherwise, if you get failed status you have to debug further what's causing it.
 

How to view existing export polcities and remove them


If you don't want to delete the qtree or volume but want to prevent a certain Linux server / application to not have access to it, it is useful to view existing export policy for a qtree.
 

netappfc001::> qtree show -exports -volume vol1_vmspace_netapp01v000885 -qtree q_01v002131
                                                   Is Export
Vserver    Volume        Qtree        Policy Name  Policy Inherited
———- ————- ———— ———— —————–
netapp01fv001 vol1_vmspace_netapp01v000885
                         q_01v002131
                                      vol1_vmspace_netapp01v000885.exports
                                                   true


To remove then export policy (to not exist at all), this is how:


netapp> volume qtree modify -vserver hec01fv018 -qtree-path /vol/volume_name/qtree_name -export-policy ""


I've also found the following volume qtree commands NetApp ONTAP documentation page helpful to read and recommend to anyone that wants to learn more.
 

How to delete a NetApp Volume if it is not used anymore

To delete unsed netapp volume, you have to do 3 things.
1. Unmount the volume
2. Put it offline
3. Delete it

to do so run below 3 cmds:


netapp> volume unmount -vserver vserver_name -volume volume_name
netapp> volume offline -vserver vserver_name volume_name
netapp> volume delete -vserver vserver_name volume_name


Show mounted Volume junctions (Get Extra Storage Volume information)


netapp> volume show -vserver netapp01fv004 -junction
netapp> volume show -vserver netapp01fv004 -volume MUFCF01_BACKUP


How to delete a Configured SnapMirror

What is a snapmirror?


Recovery-Scenario-Restore-Changes-To-Recovery-site-snapmirror-diagram

SnapMirror is a feature of Data ONTAP that enables you to replicate data. SnapMirror enables you to replicate data from specified source volumes or qtrees to specified destination volumes or qtrees, respectively. You need a separate license to use SnapMirror.

You can use SnapMirror to replicate data within the same storage system or with different storage systems.

After the data is replicated to the destination storage system, you can access the data on the destination to perform the following actions:

  • You can provide users immediate access to mirrored data in case the source goes down.
  • You can restore the data to the source to recover from disaster, data corruption (qtrees only), or user error.
  • You can archive the data to tape.
  • You can balance resource loads.
  • You can back up or distribute the data to remote sites.


netapp> snapmirror show -destination-path netapp02fv001:vol1_MUF_PS1_DR


netapp> snapmirror delete -destination-path netapp02fv001:vol1_MUF_PS1_DR -force
Operation succeeded: snapmirror delete for the relationship with destination "hec02fv001:vol1_MUF_PS1_DR".
 

If the snapmirror deletion gets scheduled you can use snapmirror status command to check status:
 

netapp> snapmirror status MUF_PS1_PRD
Snapmirror is on.


How to telnet from NetApp Storage to another one / check status of configured SMTPs for NetApp Cluster (filer)


You can use the autosupport and options autosupport commands to change or view AutoSupport configuration, display information about past AutoSupport messages, and send or resend an AutoSupport message.

For example if NetApp Filers have configured SMTP or SMTPs servers or other Proxy Configurations to pass on traffic from DMZ-ed network to external Internet resources or Relay servers this command will provide information on the Connection status of this remote services.


rows 0
set diag
node show

autosupport check show
systemshell -node netapp01f0018 -c telnet
autosupport show -fields proxy-url
systemshell -node netappf0018 -c telnet  147.204.148.38 80

netapp09fc001::*> systemshell -node  netapp08f0013 -c telnet  8080
  (system node systemshell)
Trying 100.127.20.4


node show – will provide information about configured nodes
rows 0 – will set the output print rows how they will be displayed
set – diag sets the device in diagnostic state

As you can see you can use the systemshell netapp command to try out telnet connections from the Configured NetApp logged in Source to any remote destination to make sure the set Proxy or SMTP is properly reachable.

How to get Statistics about NetApp existing volume Read / Write operations


On Netapp side issue:

netapp> statistics volume show -interval 5 -iterations 1 -max 25 -vserver netapp01fv004 -volume MUFCF01_BACKUP

For people starting up with NetApps, it is very useful to get a in-depth read on quick and dirty –  Netapp Commandline CheatSheet (for simplicity I've stored it in netapp-commands-cheatsheat.txt formatted file here ).

Conclusion

NetApp storages are used in many Governments and Large Corporations and for critical applications with SLAs forfeits for million bucks, mostly for applications and Database storage that are of a very large scale and too critical to be handled by the conventional storage computing of simple RAIDS 1,2,3,5,6 etc. / LVM and so on. ONTAP and NetApp Filers and Filer Clusters, are easy to maintain but due to its high number of features, not many NetApp Storage / Backup system administrators have the knowledge how to take a good advantage of this beasts. Thus finally, my even small experience with them shows that even simple things as critical errors are not handled properly at least that was my experience as a SAP consultant with SAP Hana Enterprise Cloud (HEC) and their HANA Converged Cloud where, main storage. 
This article's goal was pretty simple to guide the user on a minimum set of commands for simple qtree / volume / snapmirror view and removal decomissioning tasks. NetApps Clusters are a whole ocean of stuff and knowledge so before doing anything complex, if you're not sure what you're doing always consult a NetApp storage sysadmin as some of this animals features looks easy for the common general sysadmin but not are not so.
 

Did you that every single day there are …

Saturday, April 7th, 2012

Do you know that every single day there are:

  • 150 Million Blogs being read
  • 60 Million New Facebook Status Updates
  • 140 Million New "Treets" …
  • 2 Million New Videos Posted to Youtube per day
  • 3.3 Billion! Product and Information Searches
  • 188 Billion! Emails Sent …


This statistics were sent to me just few weeks, ago by a friend. I have no clue where he got the statistics, but the numbers are really amazing. From a business perspective point of view this numbers are tremendously HIGH! Nowadays only about 2.5 billion people are actively using the internet daily.

This means more than half of the humanity is still about to join using the internet in the 10 or 15 years to come. Though the continuous use of internet has a very bad impact on us. It is a tremendously big business opportunity field. With this said definitely business innovative people and enterpreneurs should reconsider, there strategic plans for potential products and extend or include the internet in anything they do in order to maximize profits.

All this is just news for anyone who is involved somehow actively with the net (like me), so system admins, web designers, programmers, use your brains and start making money from the internet. If one doesn't start with monetarizing his high tech skills, its quite likely some bad tied suit guy took the lead and made his millions or billions  on our back 🙂

Top AIX UNIX Performance tracking commands every Linux admin / user should know

Monday, March 16th, 2015

IBM_AIX_UNIX-Performance-Tracking-every-commands-Linux-sysadmin-and-user-should-know-AIX_logo

Though IBM AIX is basicly UNIX OS and many of the standard Linux commands are same or similar to AIX's if you happen to be a Linux sysadmin and you've been given some 100 AIX servers,  you will have to invest some time to read on AIX, however as a starter you should be aware to at least be able to do performance tracking on system to prevent system overloads. If that's the case I advise you check thoroughfully below commands documentation.

fcstat – Displays statistics gathered by the specified Fibre Channel device driver

filemon – Performance statistics for files, logical/physical volumes and virtual memory segments

fileplace – Displays the placement of file blocks within logical or physical volumes.

entstat – Displays the statistics gathered by the specified Ethernet device driver

iostat – Statistics for ttys, disks and cpu ipcs – Status of interprocess communication facilities

lsps – Statistics about paging space

netstat – Shows network status

netpmon – Performance statistics for CPU usage, network device-driver I/O, socket calls & NFS

nfsstat – Displays information about NFS and RPC calls

pagesize – Displays system page size ps – Display status of current processes

pstat – Statistics about system attributes

sar – System Activity Recorder

svmon – Captures a snapshot of the current contents of both real and virtual memory

traceroute – intended for use in network testing, measurement, and management.

tprof – Detailed profile of CPU usage by an application vmstat – Statistics about virtual memory and cpu/hard disk usage

topas – AIX euqivalent of Linux top command

Here are also useful examples use of above AIX performance tracking commands

To display the statistics for Fiber Channel device driver fcs0, enter:

fcstat fcs0

To monitor the activity at all file system levels and write a verbose report to the fmon.out file, enter:

filemon -v -o fmon.out -O all

To display all information about the placement of a file on its physical volumes, enter:

fileplace -piv data1

To display a continuous disk report at two second intervals for the disk with the logical name disk1, enter the following command:

iostat -d disk1 2

To display extended drive report for all disks, enter the following command:

iostat -D

To list the characteristics of all paging spaces, enter:

lsps -a

List All Ports (both listening and non listening ports)

netstat -a | more

The netpmon command uses the trace facility to obtain a detailed picture of network activity during a time interval.

netpmon -o /tmp/netpmon.log -O all;

netpfmon is very much like AIX Linux equivalent of tcpdump To print all of the supported page size with an alphabetical suffix, enter:

pagesize -af

To display the i-nodes of the system dump saved in the dumpfile core file

pstat -i dumpfile

To report current tty activity for each 2 seconds for the next 40 seconds, enter the following command:

sar -y -r 2 20

To watch system unit for 10 minutes and sort data, enter the following command:

sar -o temp 60 10

To report processor activity for the first two processors, enter the following command:

sar -u -P 0,1

To display global statistics for virtual memory in a one line format every minute for 30 minutes, enter the following command:

svmon -G -O summary=longreal -i 60 30

The traceroute command is intended for use in network testing, measurement, and management. While the ping command confirms IP network reachability, you cannot pinpoint and improve some isolated problems

traceroute aix1

Basic global program and thread-level summary / Reports processor usage

prof -x sleep 10

Single process level profiling

tprof -u -p workload -x workload

Reports virtual memory statistics

vmstat 10 10

To display fork statistics, enter the following command:

vmstat -f

To display the count of various events, enter the following command: vmstat -s To display the count of various events, enter the following command:

vmstat -s

To display time-stamp next to each column of output of vmstat, enter the following command:

vmstat -t

To display the I/O oriented view with an alternative set of columns, enter the following command:

vmstat -I

To display all the VMM statistics available, enter the following command:

vmstat -vs


If you already have some experience with some BSD (OpenBSD or FreeBSD) you will feel much more confortable with AIX as both operating system share common ancestor OS (UNIX System V), actually IBM AIX is U. System V with 4.3 BSD compatible extensions. As AIX was the first OS to introduce file system journalling, journalling capabilities on AIX are superb. AIX was and is still widely used by IBM for their mainframes, on IBM RS/6000 series (in 1990s), nowdays it runs fine on PowerPC-based systems and IA-64 systems.
For GUI loving users which end up on AIX try out SMIT (System Management Interface tool for AIX). AIX was using bash shell in prior versions up to AIX 3 but in recent releases default shell is Korn Shell (ksh88).
Nowdays AIX just like HP-UX and rest of commercial UNICes are loosing ground as most of functionalities is provided by commercial Linux distributions like RHEL so most of clients including Banks and big business clients are migrating to Linux.


Happy AIX-ing ! 🙂

Microsoft Windows most secure OS for 2014 ? – Short OS and Application Security report for 2014

Tuesday, February 24th, 2015

windows-more-secure-OS-for-2014-than-Linux-and-Mac-OSX-and-iOS-operating-systems-short-security-report-2014

It is shocking news for me and probably to many that according to security specialists at National Vulnerability Database, at present moment for year 2014 Windows looks like more secure than both Apple's (iOS and Mac OS X) as well as to Linux.

Windows has been  bullied for its bad OS design and easier to breach Security compared to Linux, there was a constant hype also of Mac OS users claiming the invulnerability of their BSD based OS, but it seems security breach statistics given by  National Vulnerability Database security breach evaluation reports tell us security issues for 2014 Windows OSes while compared to other OS vulnerabilities in different operating systems such as Linux.

statistics-of-Operating-System-security-issues-vulnerabilities-for-2014-windows-most-secure-OS-2014-source-national-vulnerability-database
I will have to disappoint Apple Mac fans but in 2014 Mac OS X was found to be riddled with the greatest number of security problems147 in total, including 64 rated as high severity, and 67 as medium.

iOS's security was also ranked poor with 127 vulnerabilities including 32 high and 72 with a medium rating.

For comparison the latest Windows 8.1 had only 36 vulnerabilities, and its predecessors — Windows 8 and 7 — both had same number.
In Enterprise World (users) Windows Server 2007 and 2008 both have 38 vulnerabilities. Reported vulnerabilities were mainly of middle and high severity.

high-severity-vulnerabilities-graph-of-operating-systems-year-2014

Overall statistics also show there has been a huge increase in the number security vulnerabilities in the NVD security reports database.
In 2013 the number of all logged vulnerabilities were 4,794 while this jumped to 7,038 in y. 2014. The good news is lower percentage of all logged in security issues were rated of critical security importance.
It is mostly third party software not part of OS which contain security issues, 83% of all reported vulnerabilities were laying in 3rd party applications, only 13% percantage were OS specific and 4% hardware related.
Though overall statistics shows Microsoft products more secure than Apple Inc. Products and (Open Source) Linux, though still M$ Internet Explorer is the most insecure web browser, for 2014,  Internet Explorer had  242 vulnerabilities while Google Chrome had 124 security issues and the most secure browser rated for 2014 is (surprising for me) Mozilla Firefox.
It is important to say such statistics are not completely relevant because, for example you can rarely see a Linux desktop user infected with Malware but almost everyone around using Windows OS is malware infected, same goes for Mac OS users, there are plenty of vulnerabilities for Mac but overall security of Mac OS is better as I haven't still met Mac OS users with Viruses and Spyware but I fixed about (30!!) of Microsoft PCs and notebooks infected with various Viruses and badware throughout 2014. Also it should be considered that many securitty bugs are kept secret and actively exploited for a long time by blackhats like it happened recently with Heartbleed and ShellShock vulnerabilities
For those interested, below is a list of top vulnerable applications for 2014

security-issues-vulnerability-report-2012-2013-2014_graph_windows-most-secure-operating-system-for-2014

IQ world rank by country and which are the smartest nations

Friday, March 14th, 2014

IQ_world_rank_by_country_world_distribution_of_intelligence
In a home conversation with my wife who is Belarusian and comparison between Bulgarian and Belarusian nation, the interesting question arised – Which nation is Smarter Bulgarian or Belarusian?

This little conversation pushed me to intriguing question What is the IQ World rank if compared by country? Since a moment of my life I'm trying to constantly prove to myself I'm smart enough. For years my motivation was to increase my IQ. I had periods when studied hard history, philosophy and literature then I had periods to put all my efforts in music and mysticism then there was my fascination about IT and informatics and hacking, I had periods with profound interest in Biology and neourosciences, then of course psychology and social sciences and since last 10 years as I belived in God, I'm deeply interested in world religions and more particularly in Christniaty. All this is connected with my previous IQ (Intelligence Quotient) and my desire to develop my IQ. I'm quite aware that IQ statistics can never be 100% reliable as there is deviation (standard error) and its a very general way to find out about a person psychology. But anyways it is among the few methods to compare people's intelligence… I've done an IQ test in distant 2008 and I scored about 118 out of 180  – meaning my  IQ level is a little bit above average. The IQ conversation triggered my curiousity so I decided to check if my current IQ has changed over the last 6 years. Here is results from test I took March, 2013 on free-iqtest.net

IQ Test
IQtest just prooved, my IQ kept almost same, still a little bit above avarage.
Further on, I did investgation online to see if I can prove to my wife the thesis Bulgarians overall IQ is higher than Belarusian. I googled for IQ world rank by Country
Here is what I found ;


Nations Intelligence as sorted by Country

Rank
——–

Country
———————–

%
————-

1

Singapore

108

2

South Korea

106

3

Japan

105

4

Italy

102

5

Iceland

101

5

Mongolia

101

6

Switzerland

101

7

Austria

100

7

China

100

7

Luxembourg

100

7

Netherlands

100

7

Norway

100

7

United Kingdom

100

8

Belgium

99

8

Canada

99

8

Estonia

99

8

Finland

99

8

Germany

99

8

New Zealand

99

8

Poland

99

8

Sweden

99

9

Andorra

98

9

Australia

98

9

Czech Republic

98

9

Denmark

98

9

France

98

9

Hungary

98

9

Latvia

98

9

Spain

98

9

United States

98

10

Belarus

97

10

Malta

97

10

Russia

97

10

Ukraine

97

11

Moldova

96

11

Slovakia

96

11

Slovenia

96

11

Uruguay

96

12

Israel

95

12

Portugal

95

13

Armenia

94

13

Georgia

94

13

Kazakhstan

94

13

Romania

94

13

Vietnam

94

14

Argentina

93

14

Bulgaria

93

15

Greece

92

15

Ireland

92

15

Malaysia

92

16

Brunei

91

16

Cambodia

91

16

Cyprus

91

16

FYROM

91

16

Lithuania

91

16

Sierra Leone

91

16

Thailand

91

17

Albania

90

17

Bosnia and Herzegovina

90

17

Chile

90

17

Croatia

90

17

Kyrgyzstan

90

17

Turkey

90

18

Cook Islands

89

18

Costa Rica

89

18

Laos

89

18

Mauritius

89

18

Serbia

89

18

Suriname

89

19

Ecuador

88

19

Mexico

88

19

Samoa

88

20

Azerbaijan

87

20

Bolivia

87

20

Brazil

87

20

Guyana

87

20

Indonesia

87

20

Iraq

87

20

Myanmar (Burma)

87

20

Tajikistan

87

20

Turkmenistan

87

20

Uzbekistan

87

21

Kuwait

86

21

Philippines

86

21

Seychelles

86

21

Tonga

86

22

Cuba

85

22

Eritrea

85

22

Fiji

85

22

Kiribati

85

22

Peru

85

22

Trinidad and Tobago

85

22

Yemen

85

23

Afghanistan

84

23

Bahamas, The

84

23

Belize

84

23

Colombia

84

23

Iran

84

23

Jordan

84

23

Marshall Islands

84

23

Micronesia, Federated States of

84

23

Morocco

84

23

Nigeria

84

23

Pakistan

84

23

Panama

84

23

Paraguay

84

23

Saudi Arabia

84

23

Solomon Islands

84

23

Uganda

84

23

United Arab Emirates

84

23

Vanuatu

84

23

Venezuela

84

24

Algeria

83

24

Bahrain

83

24

Libya

83

24

Oman

83

24

Papua New Guinea

83

24

Syria

83

24

Tunisia

83

25

Bangladesh

82

25

Dominican Republic

82

25

India

82

25

Lebanon

82

25

Madagascar

82

25

Zimbabwe

82

26

Egypt

81

26

Honduras

81

26

Maldives

81

26

Nicaragua

81

27

Barbados

80

27

Bhutan

80

27

El Salvador

80

27

Kenya

80

28

Guatemala

79

28

Sri Lanka

79

28

Zambia

79

29

Congo, Democratic Republic of the

78

29

Nepal

78

29

Qatar

78

30

Comoros

77

30

South Africa

77

31

Cape Verde

76

31

Congo, Republic of the

76

31

Mauritania

76

31

Senegal

76

32

Mali

74

32

Namibia

74

33

Ghana

73

34

Tanzania

72

35

Central African Republic

71

35

Grenada

71

35

Jamaica

71

35

Saint Vincent and the Grenadines

71

35

Sudan

71

36

Antigua and Barbuda

70

36

Benin

70

36

Botswana

70

36

Rwanda

70

36

Togo

70

37

Burundi

69

37

Cote d'Ivoire

69

37

Ethiopia

69

37

Malawi

69

37

Niger

69

38

Angola

68

38

Burkina Faso

68

38

Chad

68

38

Djibouti

68

38

Somalia

68

38

Swaziland

68

39

Dominica

67

39

Guinea

67

39

Guinea-Bissau

67

39

Haiti

67

39

Lesotho

67

39

Liberia

67

39

Saint Kitts and Nevis

67

39

Sao Tome and Principe

67

40

Gambia, The

66

41

Cameroon

64

41

Gabon

64

41

Mozambique

64

42

Saint Lucia

62

43

Equatorial Guinea

59


North Korea

N/A


– Countries are ranked highest to lowest national IQ score.

Above statistics are taken from a work carried out earlier this decade by Richard Lynn, a British psychologist, and Tatu Vanhanen, a Finnish political scientist. To extract statistics they analized  IQ studies from 113 countries.  

For my surprise it appeared Belarusian (ranking 10th in the world) have generally higher IQ than Bulgarians (ordering 14th). Anyways being 14th in world IQ Ranking is not bad at all as we still rank in the top 20 smartest nations.

IQ is a relative way to measure intelligence, so I don't believe these statistics are revelant but they give some very general idea about world IQs.

I learned there are some claims that in more developed economies people have higher IQs than less developed. If we take in consideration above statistics its obvious such claims are dubious as you can see there are countries in top 5 countries with highest IQ, and surely Mongolia is not to be ordered in countries with high economic development.

There are plenty of other interesting researches like "Does IQ relates to people Income?", Does Religious people score higher than atheists? According to research done in U.S. Atheists score 6 IQ points higher than Religious people. However most "religous" people IQ tested were from protestant origin so results are relative (I'm sure Orthodox Christian would score higher 🙂 ). The IQ nation world ranks fail in a way that, a social, economic and historical factors are not counted. According to Gallups research, the world poorest people tend to be the most religious, a fact supporting well the saying of all saints who say that for saintly life people who preferred deliberately to live as poor people.


How to check Microsoft Windows uptime – Check server uptime in Windows server

Wednesday, May 21st, 2014

how-to-check-windows-uptime-windows-server-uptime-logo
In Linux to check uptime there is the uptime command, so how is it possible to check your system uptime – e.g. check when was last time Windows host was rebooted?

Or in other words what is Windows server equivalent to Linux's uptime command?

To check uptime on Windows OS, there is the:

net statistics server

command a shorter reference to this command is net stats srv

To run it quickest way is to press Windows (button)+r type cmd.exe and exec command in Windows command prompt:


C:UsersGeorgi>net statistics server
Server Statistics for \SM07862

Statistics since 21.05.2014 09:55:21

Sessions accepted 1
Sessions timed-out 0
Sessions errored-out 0

Kilobytes sent 0
Kilobytes received 0

Mean response time (msec) 0

System errors 0
Permission violations 0
Password violations 0

Files accessed 0
Communication devices accessed 0
Print jobs spooled 0

Times buffers exhausted

Big buffers 0
Request buffers 0

The command completed successfully.

C:UsersGeorgi>

Statistics since 21.05.2014 09:55:21 – shows when system booted last time, so to check the difference between current time and when system booted last – you need to check current time with time command


C:UsersGeorgi>time
The current time is: 16:59:26,60
Enter the new time:

Alternative command to check when Windows system booted is:

C:UsersGeorgi>systeminfo|findstr "System Boot Time"
System Boot Time: 21.05.2014, 09:54:11
System Manufacturer: HP
System Model: ProLiant BL460c G7
System Type: x64-based PC
System Directory: C:Windowssystem32
Boot Device: DeviceHarddiskVolume1
System Locale: de;German (Germany)
Time Zone: (UTC+01:00) Amsterdam, Berlin, Bern, Rome, Stockholm, Vienna

C:UsersGeorgi>

If you want to check Windows boot time "the Windows way" through the GUI, launch Windows Task Manager – run taskmgr command and go to Performance tab

images/check-windows-server-uptime-with-taskmanager-performance-tab-screenshot


Disable php notice logging / stop variable warnings in error.log on Apache / Nginx / Lighttpd

Monday, July 28th, 2014

disable_php_notice_warnings_logging_in-apache-nginx-lighttpd
At one of companies where I administrate few servers, we are in process of optimizing the server performance to stretch out the maximum out of server hardware and save money from unnecessery hardware costs and thus looking for ways to make server performance better.

On couple of web-sites hosted on few of the production servers, administrating, I've noticed dozens of PHP Notice errors, making the error.log quickly grow to Gigabytes and putting useless hard drive I/O overhead. Most of the php notice warnings are caused by unitialized php variables.

I'm aware having an unitialized values is a horrible security hole, however the websites are running fine even though the notice warnings and currently the company doesn't have the necessery programmers resource to further debug and fix all this undefined php vars, thus what happens is monthly a couple of hundreds megabytes of useless same php notice warnings are written in error.log.

That  error.log errors puts an extra hardship for awstats which is later generating server access statistics while generating the 404 errors statistics and thus awstats script has to read and analyze huge files with plenty of records which doesn't have nothing to do with 404 error

We found this PHP Notice warnings logged is one of the things we can optimize had to be disabled.

Here is how this is done:
On the servers running Debian Wheezy stable to disable php notices.

I had to change in /etc/php5/apache2/php.ini error_reporting variable.

Setting was to log everything (including PHP critical errors, warning and notices) like so:
 

vi /etc/php5/apache2/php.ini

error_reporting = E_ALL & ~E_DEPRECATED

to

error_reporting = E_COMPILE_ERROR|E_ERROR|E_CORE_ERROR


On CentOS, RHEL, SuSE based servers, edit instead /etc/php.ini.

This setting makes Apache to only log in error.log critical errors, php core dump (thread) errors and php code compilation (interpretation errors)

To make settings take affect on Debian host Apache webserver:

/etc/init.d/apache2 restart

On CentOS, RHEL Linux, had to restart Apache with:

/etc/init.d/httpd restart

For other servers running Nginx and Lighttpd webservers, after changing php.ini:

service nginx reload
service lighttpd restart

To disable php notices errors only on some websites, where .htaccess enabled, you can use also place in website DocumentRoot .htaccess:
 

php_value error_reporting 2039


Other way to disable via .htaccess is by adding to it code:
 

php_flag display_errors off


Also for hosted websites on some of the servers, where .htaccess is disabled, enabling / disabling php notices can be easily triggered by adding following php code to index.php

define('DEBUG', true);

if(DEBUG == true)
{
    ini_set('display_errors', 'On');
    error_reporting(E_ALL);
}
else
{
    ini_set('display_errors', 'Off');
    error_reporting(0);
}


Monitoring multi core / (multiple CPUs) servers with top, tload and on Linux

Thursday, March 17th, 2011

The default GNU / Linux top command does allow to see statistics on servers and systems with multiple CPUs.
This is quite beneficial especially on Linux systems which are not equipped with htop which does show statistics to the multiple-core system load.

To examine the multiple CPUs statistics with the default top command available on every Linux system and part of the procps/proc file system utilities

1. Start top:

linux:~# top

When the top system load statistics screen starts up refreshing,

2. press simply 1
You will notice all your system cpus to show up in the top head:

8 cpu top screen statistics on Linux

As I have started talking about top, a very useful way to use top to track processes which are causing a system high loads is:

linux:~# top -b -i

This command will run top in batch mode interactively and will show you statistics about the most crucial processes which does cause a server load, look over the output and you will get an idea about what is causing you server troubles.
Moreover if you’re a Linux console freak as me you will also probably want to take a look at tload

tload command is a part of the procps – /proc file system utilities and as you can read in the tload manual tload – graphic representation of system load average

Here is a picture to give you an idea on the console output of tload :

tload console/terminal system load statistics on Linux screenshot

Another tool that you might find very usefel is slabtop it’s again a part of the procps linux package.
slabtop – displays a listing of the top caches sorted by one of the listed sort criteria., in most of the cases the slabtop kernel cache monitoring tool won’t be necessary for the regular administrator, however on some servers it might help up to the administrator to resolve performance issues which are caused by the kernel as a bottleneck.
slabtop is also used as a tool by kernel developers to write and debug the Linux kernel.

How to check if your Linux WebServer is under a DoS attack

Friday, July 22nd, 2011

There are few commands I usually use to track if my server is possibly under a Denial of Service attack or under Distributed Denial of Service

Sys Admins who still have not experienced the terrible times of being under a DoS attack are happy people for sure …

1. How to Detect a TCP/IP Denial of Service Attack This are the commands I use to find out if a loaded Linux server is under a heavy DoS attack, one of the most essential one is of course netstat.
To check if a server is under a DoS attack with netstat, it’s common to use:

linux:~# netstat -ntu | awk '{print $5}' | cut -d: -f1 | sort | uniq -c | sort -n|wc -l

If the output of below command returns a result like 2000 or 3000 connections!, then obviously it’s very likely the server is under a DoS attack.

To check all the IPS currently connected to the Apache Webserver and get a very brief statistics on the number of times each of the IPs connected to my server, I use the cmd:

linux:~# netstat -ntu | awk '{print $5}' | cut -d: -f1 | sort | uniq -c | sort -n
221 80.143.207.107 233 145.53.103.70 540 82.176.164.36

As you could see from the above command output the IP 80.143.207.107 is either connected 221 times to the server or is in state of connecting or disconnecting to the node.

Another possible way to check, if a Linux or BSD server is under a Distributed DoS is with the list open files command lsof
Here is how lsof can be used to list the approximate number of ESTABLISHED connections to port 80.

linux:~# lsof -i TCP:80
litespeed 241931 nobody 17u IPv4 18372655 TCP server.www.pc-freak.net:http (LISTEN)
litespeed 241931 nobody 25u IPv4 18372659 TCP 85.17.159.89:http (LISTEN)
litespeed 241931 nobody 30u IPv4 29149647 TCP server.www.pc-freak.net:http->83.101.6.41:54565 (ESTABLISHED)
litespeed 241931 nobody 33u IPv4 18372647 TCP 85.17.159.93:http (LISTEN)
litespeed 241931 nobody 34u IPv4 29137514 TCP server.www.pc-freak.net:http->83.101.6.41:50885 (ESTABLISHED)
litespeed 241931 nobody 35u IPv4 29137831 TCP server.www.pc-freak.net:http->83.101.6.41:52312 (ESTABLISHED)
litespeed 241931 nobody 37w IPv4 29132085 TCP server.www.pc-freak.net:http->83.101.6.41:50000 (ESTABLISHED)

Another way to get an approximate number of established connections to let’s say Apache or LiteSpeed webserver with lsof can be achieved like so:

linux:~# lsof -i TCP:80 |wc -l
2100

I find it handy to keep track of above lsof command output every few secs with gnu watch , like so:

linux:~# watch "lsof -i TCP:80"

2. How to Detect if a Linux server is under an ICMP SMURF attack

ICMP attack is still heavily used, even though it’s already old fashioned and there are plenty of other Denial of Service attack types, one of the quickest way to find out if a server is under an ICMP attack is through the command:

server:~# while :; do netstat -s| grep -i icmp | egrep 'received|sent' ; sleep 1; done
120026 ICMP messages received
1769507 ICMP messages sent
120026 ICMP messages received
1769507 ICMP messages sent

As you can see the above one liner in a loop would check for sent and recieved ICMP packets every few seconds, if there are big difference between in the output returned every few secs by above command, then obviously the server is under an ICMP attack and needs to hardened.

3. How to detect a SYN flood with netstat

linux:~# netstat -nap | grep SYN | wc -l
1032

1032 SYNs per second is quite a high number and except if the server is not serving let’s say 5000 user requests per second, therefore as the above output reveals it’s very likely the server is under attack, if however I get results like 100/200 SYNs, then obviously there is no SYN flood targetting the machine 😉

Another two netstat command application, which helps determining if a server is under a Denial of Service attacks are:

server:~# netstat -tuna |wc -l
10012

and

server:~# netstat -tun |wc -l
9606

Of course there also some other ways to check the count the IPs who sent SYN to the webserver, for example:

server:~# netstat -n | grep :80 | grep SYN |wc -l

In many cases of course the top or htop can be useful to find, if many processes of a certain type are hanging around.

4. Checking if UDP Denial of Service is targetting the server

server:~# netstat -nap | grep 'udp' | awk '{print $5}' | cut -d: -f1 | sort |uniq -c |sort -n

The above command will list information concerning possible UDP DoS.

The command can easily be accustomed also to check for both possible TCP and UDP denial of service, like so:

server:~# netstat -nap | grep 'tcp|udp' | awk '{print $5}' | cut -d: -f1 | sort |uniq -c |sort -n
104 109.161.198.86
115 112.197.147.216
129 212.10.160.148
227 201.13.27.137
3148 91.121.85.220

If after getting an IP that has too many connections to the server and is almost certainly a DoS host you would like to filter this IP.

You can use the /sbin/route command to filter it out, using route will probably be a better choice instead of iptables, as iptables would load up the CPU more than simply cutting the route to the server.

Here is how I remove hosts to not be able to route packets to my server:

route add 110.92.0.55 reject

The above command would null route the access of IP 110.92.0.55 to my server.

Later on to look up for a null routed IP to my host, I use:

route -n |grep -i 110.92.0.55

Well hopefully this should be enough to give a brief overview on how, one can dig in his server and find if he is under a Distributed Denial of Service, hope it’s helpful to somebody out there.
Cheers 😉