![]()
Haproxy Load Balancers could do pretty much to load balance traffic between application servers. The most straight forward way to use is to balance traffic for incoming Frontends towards a Backend configuration with predefined Application machines and ports to send the traffic, where one can be the leading one and others be set as backup or we can alternatively send the traffic towards a number of machines incoming to a Frontend port bind IP listener and number of backend machine.
Besides this the more interesting capabilities of Haproxy comes with using Access Control Lists (ACLs) to forward Incoming Frontend (FT) traffic towards specific backends and ports based on logic, power ACLs gives to Haproxy to do a sophisticated load balancing are enormous.
In this post I'll give you a very simple example on how you can save some time, if you have already a present Frontend listening to a Range of TCP Ports and it happens you want to redirect some of the traffic towards a spefic predefined Backend.
This is not the best way to it as Access Control Lists will put some extra efforts on the server CPU, but as today machines are quite powerful, it doesn't really matter. By using a simple ACLs as given in below example, one can save much of a time of writting multiple frontends for a complete sequential port range, if lets say only two of the ports in the port range and distinguish and redirect traffic incoming to Haproxy frontend listener in the port range of 61000-61230 towards a certain Ports that are supposed to go to a Common Backends to a separate ones, lets say ports 61115 and 61215.
Here is a short description on the overall screnarios. We have an haproxy with 3 VIP (Virtual Private IPs) with a Single Frontend with 3 binded IPs and 3 Backends, there is a configured ACL rule to redirect traffic for certain ports, the overall Load Balancing config is like so:
Frontend (ft):
ft_PROD:
listen IPs:
192.168.0.77
192.168.0.83
192.168.0.78
On TCP port range: 61000-61299
Backends (bk):
bk_PROD_ROUNDROBIN
bk_APP1
bk_APP2
Config Access Control Liststo seperate incoming haproxy traffic for CUSTOM_APP1 and CUSTOM_APP2
By default send all incoming FT traffic to: bk_PROD_ROUNDROBIN
With exception for frontend configured ports on:
APP1 port 61115
APP2 port 61215
If custom APP1 send to bk:
RULE1
If custom APP2 send to bk:
RULE2
Config on frontends traffic send operation:
bk_PROD_ROUNDROBIN (roundrobin) traffic send to App machines all in parallel
traffic routing mode (roundrobin)
Appl1
Appl2
Appl3
Appl4
bk_APP1 and bk_APP2
traffic routing mode: (balance source)
Appl1 default serving host
If configured check port 61888, 61887 is down, traffic will be resend to configured pre-configured backup hosts:
Appl2
Appl3
Appl4
/etc/haproxy/haproxy.cfg that does what is described with ACL LB capabilities looks like so:
#———————————————————————
# Global settings
#———————————————————————
global
log 127.0.0.1 local2chroot /var/lib/haproxy
pidfile /var/run/haproxy.pid
maxconn 4000
user haproxy
group haproxy
daemon# turn on stats unix socket
stats socket /var/lib/haproxy/stats#———————————————————————
# common defaults that all the 'listen' and 'backend' sections will
# use if not designated in their block
#———————————————————————
defaults
mode tcp
log global
option tcplog
#option dontlognull
#option http-server-close
#option forwardfor except 127.0.0.0/8
option redispatch
retries 7
#timeout http-request 10s
timeout queue 10m
timeout connect 30s
timeout client 20m
timeout server 10m
#timeout http-keep-alive 10s
timeout check 30s
maxconn 3000
#———————————————————————
# Synchronize server entries in sticky tables
#———————————————————————peers hapeers
peer haproxy1-fqdn.com 192.168.0.58:8388
peer haproxy2-fqdn.com 192.168.0.79:8388
#———————————————————————
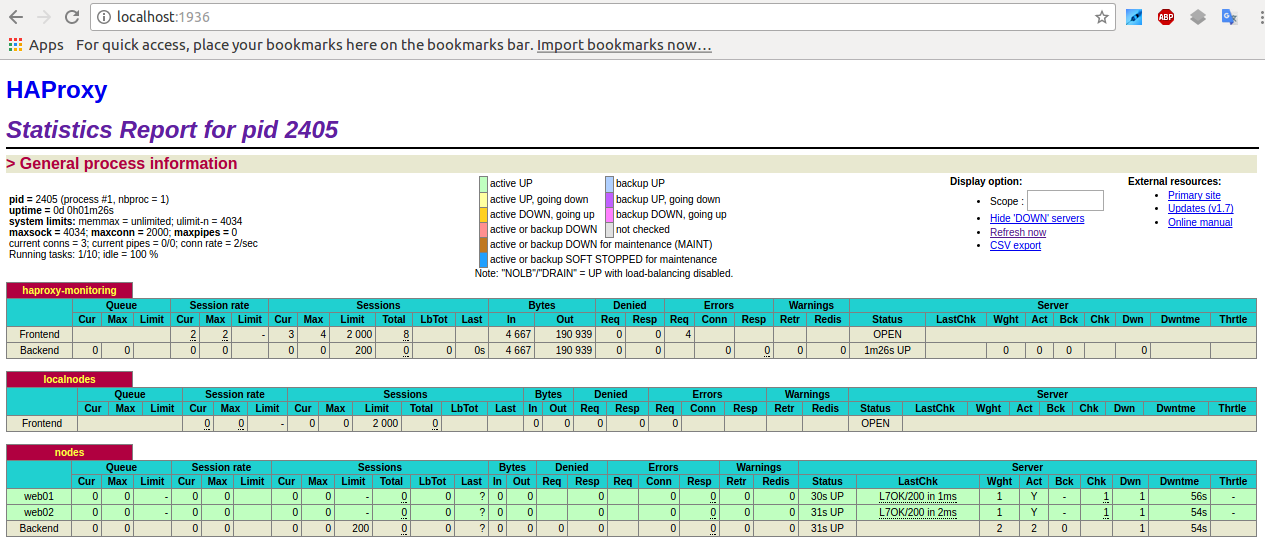
# HAProxy Monitoring Config
#———————————————————————
listen stats 192.168.0.77:8080 #Haproxy Monitoring run on port 8080
mode http
option httplog
option http-server-close
stats enable
stats show-legends
stats refresh 5s
stats uri /stats #URL for HAProxy monitoring
stats realm Haproxy\ Statistics
stats auth hauser:secretpass4321 #User and Password for login to the monitoring dashboard
stats admin if TRUE
#default_backend bk_Prod1 #This is optionally for monitoring backend
#———————————————————————
# HAProxy Monitoring Config
#———————————————————————
#listen stats 192.168.0.83:8080 #Haproxy Monitoring run on port 8080
# mode http
# option httplog
# option http-server-close
# stats enable
# stats show-legends
# stats refresh 5s
# stats uri /stats #URL for HAProxy monitoring
# stats realm Haproxy\ Statistics
# stats auth hauser:secretpass321 #User and Password for login to the monitoring dashboard
# stats admin if TRUE
# #default_backend bk_Prod1 #This is optionally for monitoring backend#———————————————————————
# HAProxy Monitoring Config
#———————————————————————
# listen stats 192.168.0.78:8080 #Haproxy Monitoring run on port 8080
# mode http
# option httplog
# option http-server-close
# stats enable
# stats show-legends
# stats refresh 5s
# stats uri /stats #URL for HAProxy monitoring
# stats realm Haproxy\ Statistics
# stats auth hauser:secretpass123 #User and Password for login to the monitoring dashboard
# stats admin if TRUE
# #default_backend bk_DKV_PROD_WLPFO #This is optionally for monitoring backend
#———————————————————————
# frontend which proxys to the backends
#———————————————————————
frontend ft_PROD
mode tcp
bind 192.168.0.77:61000-61299
bind 192.168.0.83:51000-51300
bind 192.168.0.78:51000-62300
option tcplog
# (4) Peer Sync: a sticky session is a session maintained by persistence
stick-table type ip size 1m peers hapeers expire 60m
# Commented for change CHG0292890
# stick on src
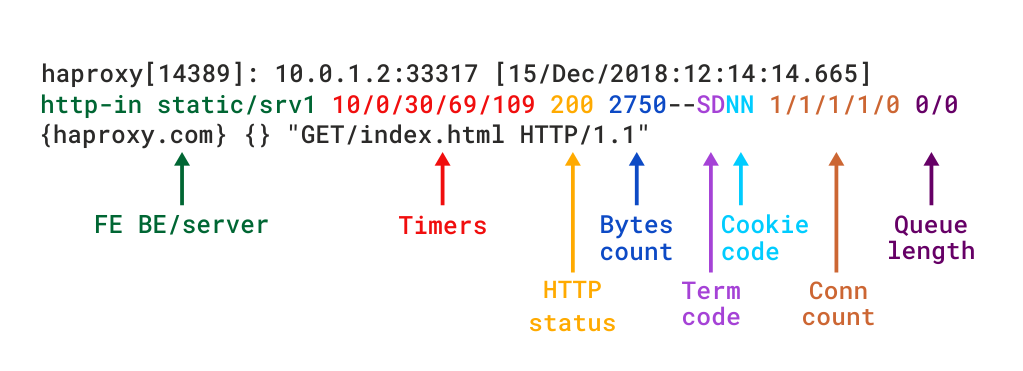
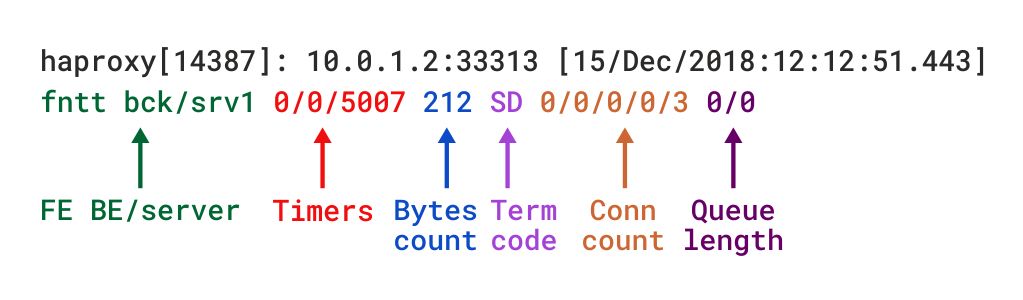
log-format %ci:%cp\ [%t]\ %ft\ %b/%s\ %Tw/%Tc/%Tt\ %B\ %ts\ %ac/%fc/%bc/%sc/%rc\ %sq/%bq
acl RULE1 dst_port 61115
acl RULE2 dst_port 61215
use_backend APP1 if app1
use_backend APP2 if app2
default_backend bk_PROD_ROUNDROBIN
#———————————————————————
# round robin balancing between the various backends
#———————————————————————
backend bk_PROD_ROUNDROBIN
mode tcp
# (0) Load Balancing Method.
balance roundrobin
# (4) Peer Sync: a sticky session is a session maintained by persistence
stick-table type ip size 1m peers hapeers expire 60m
# (5) Server List
# (5.1) Backend
server appl1 10.33.0.50 check port 31232
server appl2 10.33.0.51 check port 31232
server appl2 10.45.0.78 check port 31232
server appl3 10.45.0.79 check port 31232#———————————————————————
# source balancing for the GUI
#———————————————————————
backend bk_APP2
mode tcp
# (0) Load Balancing Method.
balance source
# (4) Peer Sync: a sticky session is a session maintained by persistence
stick-table type ip size 1m peers hapeers expire 60m
stick on src
# (5) Server List
# (5.1) Backend
server appl1 10.33.0.50 check port 55232
server appl2 10.32.0.51 check port 55232 backup
server appl3 10.45.0.78 check port 55232 backup
server appl4 10.45.0.79 check port 55232 backup#———————————————————————
# source balancing for the OLW
#———————————————————————
backend bk_APP1
mode tcp
# (0) Load Balancing Method.
balance source
# (4) Peer Sync: a sticky session is a session maintained by persistence
stick-table type ip size 1m peers hapeers expire 60m
stick on src
# (5) Server List
# (5.1) Backend
server appl1 10.33.0.50 check port 53119
server appl2 10.32.0.51 check port 53119 backup
server appl3 10.45.0.78 check port 53119 backup
server appl4 10.45.0.79 check port 53119 backup
You can also check and download the haproxy.cfg here.
Enjjoy !


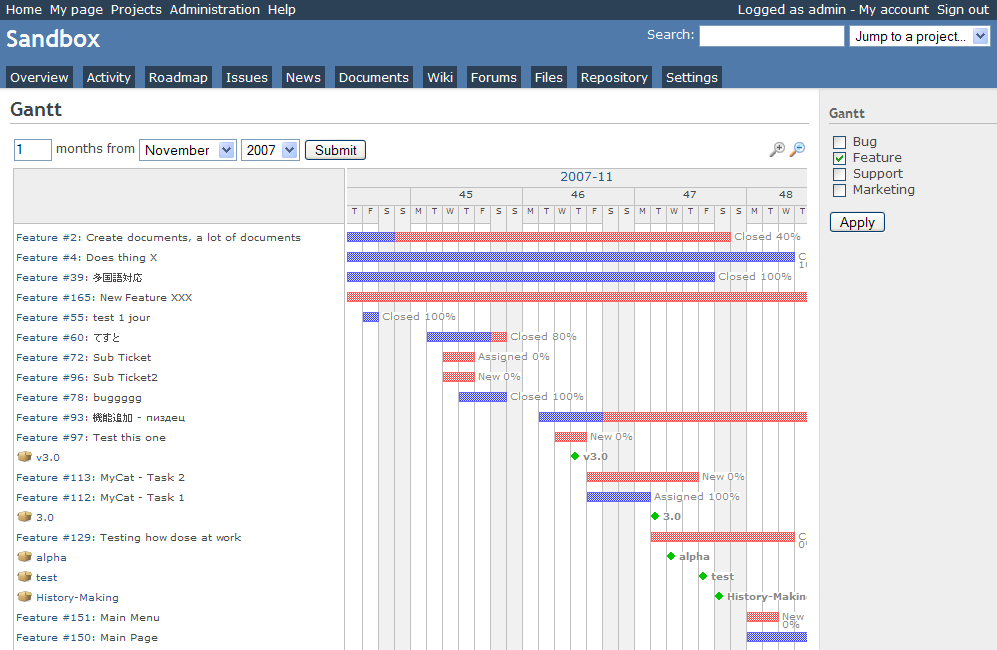
 GANTTProject Chart
  Planner GANTT Chone Chart
  Task Juggler